Implementing 130/30 Equity Strategies:
Diversification Among Quantitative Managers
Abstract
The high degree of correlation among the returns of quantitative equity strategies during July and August 2007 has been extensively analyzed, and the literature to date has focused largely upon return forecasting models as the source of that correlation. This topic is particularly relevant to plan sponsors making allocations to “relaxed-long” or “130/30” strategies because, among other things, those strategies are predominantly implemented using quantitative processes and generally target higher levels of tracking error than is the case for analogous long-only strategies. This paper argues that
overlapping risk models constitute an overlooked source of correlation among quantitative equity managers. In particular, it demonstrates that the deployment of common risk models can greatly narrow the opportunity set used in security selection, and that during a market dislocation contagion can spread among managers even in the absence of a high degree of overlap in their forecasting models. The paper concludes by considering the implications of this analysis for both investment managers and plan sponsors.
Tony Foley
Head of Quantitative Research
D. E. Shaw Investment Management, L.L.C. 39th Floor, Tower 45
120 West Forty-Fifth Street New York, NY 10036 [email protected] March 28, 2008
The views expressed in this paper are solely those of its author as of the date of this paper and not of D. E. Shaw Investment Management, L.L.C., D. E. Shaw & Co., L.P., or any other member of the D. E. Shaw group.
1.
Introduction
The performance of quantitative equity strategies in July and August 2007 has been extensively analyzed. (See Khandani and Lo (2007) for an academic account and Rothman (2007) for an impressively timely analysis.) One red thread running through this work highlights the high degree of correlation among the excess returns of quantitative strategies during this period. This was particularly striking given that other styles of equity investing did not experience anything close to the same degree of dislocation. It certainly felt as if the market had turned into a Quantron Bomb that took out quantitative equity strategies and left everything else more or less untouched.
The level of correlation among quantitative equity managers is directly relevant to plan sponsor decision making on “relaxed-long” or “130/30” equity strategies for three primary reasons. First, many managers colonizing this investment space utilize quantitative strategies, and the bulk of 130/30 assets have been placed with quantitative managers. Second, plan sponsors often allocate to several managers in the 130/30 space because this approach to equity investing is relatively new. (It’s not uncommon for a given plan to hire three or four managers when implementing 130/30 strategies.) Finally, since 130/30 strategies generally afford managers more room to increase tracking error without degrading the expected information ratio, such mandates are often set at tracking error targets that exceed the long-only mandates that they replace. A higher level of tracking error increases the importance of understanding the correlations of excess returns among quantitative managers and the
implications of those correlations for the overall risk of allocations to 130/30 equity strategies.
2.
Risk Models as a Driver of Positive Correlation
Similarity in alpha models has received top billing as the source of high correlation among quantitative equity strategies during August 2007. Both
Another potential source of correlation that has received far less attention is similarity in the risk models deployed by quantitative managers. Overlooking the impact of risk models on the performance of quantitative equity strategies during August 2007 seems somewhat odd. After all, while the degree of overlap in excess return models is difficult to ascertain (and, as will be argued below, is easy to overestimate), many quantitative managers use not just similar but
literally identical risk models and portfolio construction methodologies obtained from a relatively small set of external providers. Given these circumstances, it’s worth highlighting the potential impact of identical or very similar risk models on the concentration of manager positions.
The dominant paradigm for the construction of multi-factor equity risk models is the factor risk approach, which is loosely based on arbitrage pricing theory (APT). This approach assumes that the risk of a stock can be broken down into a set of exposures to common risk factors and to a residual that corresponds to the idiosyncratic risk of that stock. (See the appendix for a mathematical expression of this idea.)
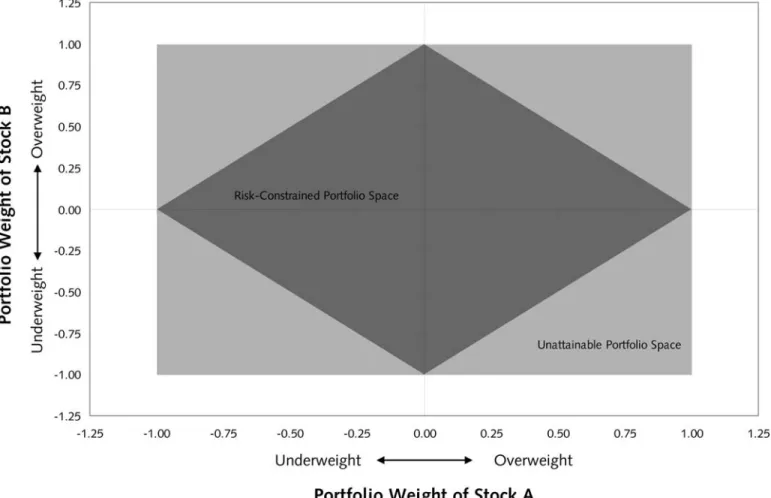
Like any constraint, this approach effectively rules out some potential portfolios and implies that the optimal portfolio will be chosen from a subspace of the overall set of possible portfolios. To see how this works, consider a simple example in which price-to-book ratio is the relevant risk factor and serves as a proxy for “value” style exposure. Consider two stocks, one with a higher than average price-to-book and one with a below average price-to-book. Assume that without a risk constraint, the manager’s benchmark-relative weights would be in the ±1.0% range. With a strict risk constraint applied, some regions of this space will be unattainable. Figure 1 illustrates these conditions.
Figure 1: Impact of Factor Risk Constraint on Feasible Portfolio Choices
All managers who constrain risk by using the same risk model end up selecting from the same smaller set of feasible portfolios. When this set of conditions is scaled up and applied to a larger universe of instruments, the feasible space remains large, but the basic principle still applies: if a subgroup of managers uses the same risk model, then each manager in that subgroup will select portfolios from the same, smaller subset of portfolio space. Certainly, not all managers will constrain exposures to specific factors. But as long as managers deploy the same risk model, the same regions of portfolio space will be expensive
Implicit in this argument is the notion that managers using identical risk models will also be using mean-variance optimization in one form or another. This assumption would not seem to be overly heroic because major providers of risk models are also leading suppliers of portfolio optimization software, and the industry is in any case dominated by the mean-variance paradigm. A lack of diversity in portfolio construction methodology will clearly tend to increase correlations. Moreover, as many practitioners will appreciate, mean-variance optimizations are not robust in their raw state. A small change in expected returns or risk inputs can lead to very large and not always particularly intuitive changes in the optimal portfolio allocation. As such, implementing
mean-variance models requires a litany of constraints to ensure reasonable outcomes. This exacerbates cross-manager correlations because managers tend to impose similar constraints, such as putting tight limits on benchmark-relative active stock or industry misweights and restricting factor risk in the manner already discussed.
3.
Contagion without Direct Overlap in Forecasting Models
All this notwithstanding, it is likely that overlapping alpha models played a significant role in the market events of July and August 2007, and this has potential implications for the implementation of 130/30 equity strategies. However, the very high excess return correlations seen during this period may well overstate the degree of overlap in return forecasting models. In fact, it is perfectly possible for the kind of contagion witnessed in the summer of 2007 to materialize even in the absence of significant overlap in alpha models. For example, Manager A may have no overlap at all in forecasting models with Manager C, but if both have some degree of forecasting model overlap with Manager B, then Manager B can serve as a conductor of contagion between Manager A and Manager C. In such circumstances, the longer term pair-wise excess return correlation of Managers A and C would seriously underestimate the correlation in the event that Manager B decided to take off leverage or otherwise reduce its active exposure. Figure 2 illustrates this scenario.
Figure 2: Potential for Contagion
In this stylized example, even a complete disclosure of the forecasting models used by Managers A and C would not have alerted an observer to the common exposure to Manager B, unless that observer also happened to know the details of Manager B’s investment process.
4.
Conclusion
The foregoing analysis suggests that there is likely to be a lower bound on the excess return correlations of quantitative managers in times of market
disruption. All things being equal, managers who do not rely upon generic risk models and widely known return drivers such as valuation and momentum are less likely to be correlated than other managers. But the general expectation should be that most managers will be unable to fully inoculate themselves against another liquidity crisis like that of July and August 2007.
answer on how to do 130/30 could be somewhat different. While recognizing that quantitative managers may be unable to reduce correlations to de minimis
levels, plan sponsors may now pay more attention to those features likely to leave managers most exposed, in particular the degree to which a given process relies on generic technologies and portfolio construction methodologies.
5.
Appendix
The factor risk approach can be written as:
t t t t X f
r = ∗ +ε (1)
where rt is excess return, Xt is an N by F matrix of exposures of the N stocks n to a
set of F common factors, ft is an F by1 vector of factor exposures,
ε
t is an N by 1vector of residual returns, and t is the estimation horizon. In this framework, the co-variance matrix is given by:
t t t t
t X F X Q
V = ∗ ∗ ′+ (2)
where Vt is portfolio variance, Ft is the F by F matrix of factor variances (assumed
to be diagonal because the risk factors are assumed to be uncorrelated), and Qt is
the N by N diagonal matrix of residual stock variances. Given this structure, the tracking error (
σ
t) of a portfolio can be written as:(
t t t) (
t t t)
t t t t = w′∗X ∗S ∗ S ∗X′∗w +w′∗Q ∗wσ (3)
where St is an F by F matrix of factor risks, and wt are the active portfolio weights.
The product w′t ∗ Xt ∗ St is a linear combination of the portfolio weights, factor
exposures, and factor standard deviations. Within this framework, a manager wishing to constrain its exposure to a given common risk factor can easily do so by imposing a linear constraint on the sum of the exposure multiplied by the associated volatility of that risk factor.
6.
References
[1] Khandani, Amir E. and Andrew W. Lo (2007). What Happened to the Quants in August 2007? Working Paper. MIT Sloan School of Management, September 20, pp. 1-56.
[2] Rothman, Mathew S. (2007). Turbulent Times in Quant Land. Market Commentary. Lehman Brothers Equity Research, August 9, pp. 1-10.
The views expressed in this paper are solely those of its author as of the date of this paper and not of D. E. Shaw Investment Management, L.L.C., D. E. Shaw & Co., L.P., or any other member of the D. E. Shaw group. Other professionals in the D. E. Shaw group may have inconsistent or conflicting views. The views expressed in this paper are subject to change without notice, and may not reflect the criteria employed by any company in the D. E. Shaw group to evaluate investments or investment strategies. This paper is provided to you for informational purposes only. This paper does not and is not intended to constitute investment advice, nor does it constitute an offer to sell or provide or a solicitation of an offer to buy any security, investment product, or service. This paper does not take into account any particular investor’s investment objectives or tolerance for risk. The information contained in this paper is presented solely with respect to the date of the preparation of this paper, or as of such earlier date specified in this paper, and may be changed or updated at any time without notice to any of the recipients of this paper (whether or not some other recipients receive changes or updates to the information in this paper).
No assurances can be made that any aims, assumptions, expectations, and/or
objectives described in this paper would be realized or that the investment strategies described in this paper would meet their objectives. None of the companies in the D. E. Shaw group; nor their affiliates; nor any shareholders, partners, members, managers, directors, principals, personnel, trustees, or agents of any of the foregoing shall be liable for any errors (to the fullest extent permitted by law and in the absence of willful misconduct) in the information, beliefs, and/or opinions included in this paper, or for the consequences of relying on such information, beliefs, or opinions.