CENSUS DAY ENROLLMENT STATISTICS
Summer 2014 (201405)
This publication represents enrollments as of August 14, 2014
Source: 201405 Enrollment Extract
XAVIER UNIVERSITY
Students % Credit Hours %
UNDERGRADUATE TOTAL 1,486 48.5% 7,776.5 47.2%
GRADUATE TOTAL 1,577 51.5% 8,683.5 52.8%
UNIVERSITY TOTAL 3,063 100.0% 16,460.0 100.0%
UNDERGRADUATE STUDENTS Students Credit Hours GRADUATE STUDENTS Students Credit Hours
TOTAL BY CREDIT HOUR STATUS TOTAL BY CREDIT HOUR STATUS
Full-Time (12 +) 82 1,069.00 Full-Time (9+) 261 2,922.0
Part-Time (7-11) 210 1,815.0 Part-Time (0-8) 1,316 5,761.5
Part-Time (0-6) 1,194 4,892.5
TOTAL 1,486 7,776.5 TOTAL 1,577 8,683.5
TOTAL BY DEGREE STATUS TOTAL BY DEGREE STATUS
Degree Seeking AS Degree (ENGL, THEO) 8 26.0
Radiologic Technology 18 93.0 AS Non-Degree 1 3.0
Senior Citizen 5 27.0 CAS Sub-Total 9 29.0
Weekend Degree Program 78 494.0
* All Other Degrees 1,136 6,243.0
Sub-Total Degree Seeking 1,237 6,857.0 WB Degree (Incl. MBA, XMBA, OMBA) 446 2,633.5
WB Non-Degree (XTRA & Others) 2 9.0
Non-Degree WCB Sub-Total 448 2,642.5
English as a Second Lang. (ESL) 78 242.5
Senior Citizen 5 14.0 SSHE Degree (MEd, MA COMM, MA PSYC & PSYD 760 4,594.0
Weekend Degree Program 2 10.0 MOT, MHSA, MS CJUS, MSN)
High School Programs 46 141.0 SSHE Non-Degree (Educ. Cert. Prgm., 360 1,418.0
Consortium 12 58.0 and misc. other)
Collegium 0 0.0
Visiting (Transient) 87 364.0 CSSHE Sub-Total 1,120 6,012.0
Miscellaneous Non-Degree 19 90.0
Sub-Total Non Degree 249 919.5
UNDERGRADUATE TOTAL 1,486 7,776.5 GRADUATE TOTAL 1,577 8,683.5
* Includes Pre-Pharmacy and Pre-MSN Science Majors with degree BDU.
Student Headcount and Credit Hours by Degree Status, All Students Summer 2014
2 of 11
Full-Time (12+) Part-Time (0-11) Total Full-Time (12+) Part-Time (0-11) Total
Students Cr. Hrs. Students Cr. Hrs. Students Cr. Hrs. Students Cr. Hrs. Students Cr. Hrs. Students Cr. Hrs.
COLLEGE OF ARTS AND SCIENCES (AS) NO-COLLEGE, BY CLASSIFICATION
Freshmen 0 0.0 23 125.0 23 125.0 Freshmen 1 13.0 241 885.5 242 898.5
Sophomores 2 24.0 103 476.0 105 500.0 Sophomores 0 0.0 0 0.0 0 0.0
Juniors 8 101.0 132 682.0 140 783.0 Juniors 0 0.0 0 0.0 0 0.0
Seniors 26 351.0 192 1,052.0 218 1,403.0 Seniors 1 14.0 6 7.0 7 21.0
CAS TOTAL 36 476.0 450 2,335.0 486 2,811.0 TOTAL 2 27.0 247 892.5 249 919.5
WILLIAMS COLLEGE OF BUSINESS (WB)
Freshmen 0 0.0 11 57.0 11 57.0
Sophomores 5 61.0 57 274.0 62 335.0
Juniors 7 90.0 126 637.0 133 727.0
Seniors 16 209.0 175 827.0 191 1,036.0
WCB TOTAL 28 360.0 369 1,795.0 397 2,155.0
COLLEGE OF SOCIAL SCIENCES, HEALTH & EDUCATION (SSHE)
Freshmen 2 24.0 3 12.0 5 36.0
Sophomores 2 27.0 71 373.0 73 400.0
Juniors 6 76.0 100 501.0 106 577.0
Seniors 6 79.0 164 799.0 170 878.0
CSSHE TOTAL 16 206.0 338 1,685.0 354 1,891.0 Full-Time (12+) Part-Time (0-11) Total
Students Cr. Hrs. Students Cr. Hrs. Students Cr. Hrs.
ALL THREE COLLEGES, BY CLASSIFICATION ALL UNDERGRADUATES, BY CLASSIFICATION
Freshmen 2 24.0 37 194.0 39 218.0 Freshmen 3 37.0 278 1,079.5 281 1,116.5
Sophomores 9 112.0 231 1,123.0 240 1,235.0 Sophomores 9 112.0 231 1,123.0 240 1,235.0
Juniors 21 267.0 358 1,820.0 379 2,087.0 Juniors 21 267.0 358 1,820.0 379 2,087.0
Seniors 48 639.0 531 2,678.0 579 3,317.0 Seniors 49 653.0 537 2,685.0 586 3,338.0
TOTAL 80 1,042.0 1,157 5,815.0 1,237 6,857.0 TOTAL 82 1,069.0 1,404 6,707.5 1,486 7,776.5
6.5% 93.5% 100.0% 5.5% 94.5% 100.0%
15.2% 84.8% 100.0% 13.7% 86.3% 100.0%
Student Headcount and Credit Hours, by Classification & Degree within College: Undergraduate Students Only Summer 2014
Full-Time (9+) Part-Time (0-8) Total
Students Credit Hours Students Credit Hours Students Credit Hours COLLEGE OF ARTS AND SCIENCES
English 0 0.0 3 12.0 3 12.0
Theology 0 0.0 5 14.0 5 14.0
MA Sub-total 0 0.0 8 26.0 8 26.0
Non-Degree 0 0.0 1 3.0 1 3.0
CAS TOTAL 0 0.0 9 29.0 9 29.0
WILLIAMS COLLEGE OF BUSINESS
Regular MBA 80 834.0 304 1,377.5 384 2,211.5
Executive MBA 1 9.0 8 48.0 9 57.0
On-Site MBA 3 27.0 50 338.0 53 365.0
Non-Degree 0 0.0 2 9.0 2 9.0
WCB TOTAL 84 870.0 364 1,772.5 448 2,642.5
COLLEGE OF SOCIAL SCIENCES, HEALTH & EDUCATION Education:
MEd 92 1,000.0 212 964.0 304 1,964.0
MA Counseling 23 233.0 98 422.0 121 655.0
Non-Degree Education 18 191.0 308 1,105.0 326 1,296.0
Education Sub-Total 133 1,424.0 618 2,491.0 751 3,915.0
Psychology:
MA 0 0.0 9 54.0 9 54.0
PsyD 1 9.0 57 273.0 58 282.0
Non-Degree Psychology 0 0.0 17 51.0 17 51.0
Psychology Sub-Total 1 9.0 83 378.0 84 387.0
MHSA 8 78.0 37 136.0 45 214.0
MS Criminal Justice 3 33.0 4 22.0 7 55.0
MS Human Resource Development 0 0.0 29 96.0 29 96.0
MS Nursing 32 508.0 134 703.0 166 1,211.0
MOT 0 0.0 21 63.0 21 63.0
Non-Degree Other 0 0.0 17 71.0 17 71.0
CSSHE TOTAL 177 2,052.0 943 3,960.0 1,120 6,012.0
ALL GRADUATE STUDENTS 261 2,922.0 1,316 5,761.5 1,577 8,683.5
16.6% 83.4% 100.0%
33.7% 66.3% 100.0%
Student Headcount and Credit Hours, by Degree Status Within College: Graduate Students Only Summer 2014
4 of 11
Student Headcount by Age Range and Level Xavier University, Office of Institutional Research
Student Level FULL-TIME (12+) PART-TIME (0-11) TOTAL Undergraduate
Under 18 0 47 47
18-19 5 257 262
20-21 32 683 715
22-24 23 240 263
25-29 10 59 69
30-34 7 32 39
35-39 3 25 28
40-49 2 33 35
50-64 0 21 21
65 and over 0 6 6
Unknown 1 1
Undergraduate Total 82 1,404 1,486 FULL-TIME (9+) PART-TIME (0-8) TOTAL Graduate
Under 20 0 0 0
20-21 4 1 5
22-24 66 174 240
25-29 103 396 499
30-34 40 235 275
35-39 25 128 153
40-49 19 236 255
50-64 4 138 142
65 and over 0 6 6
Unknown 2 2
Graduate Total 261 1,316 1,577 UNIVERSITY TOTAL 343 2,720 3,063
Student Level FULL-TIME (12+) PART-TIME (0-11) TOTAL Undergraduate
Student Veteran 17 29 46
Dependent of a Veteran 1 8 9
Active Duty Military 0 0 0
Undergraduate Total 18 37 55
FULL-TIME (9+) PART-TIME (0-8) TOTAL Graduate
Student Veteran 11 12 23
Dependent of a Veteran 1 1 2
Active Duty Military 0 0 0
Graduate Total 12 13 25
UNIVERSITY TOTAL 30 50 80
Summer 2014
Student-Veteran Headcount by Level Summer 2013
5 of 11
Enrollment by Ethnicity and Gender Summer 2014
Xavier University, Office of Institutional Research
MALE FEMALE UNKNOWN TOTAL PERCENTAGE
UNDERGRADUATE
Non-Resident Alien 1 79 38 1 118 7.94%
Hispanic 2 21 32 0 53 3.57%
American Indian or Alaskan Native 3 2 3 0 5 0.34%
Asian 4 17 25 0 42 2.83%
Black or African American 5 75 79 0 154 10.36%
Hawaiian or Pacific Islander 6 1 3 0 4 0.27%
White 7 463 529 0 992 66.76%
More than one 8 16 18 0 34 2.29%
Unknown 9 40 43 1 84 5.65%
UNDERGRADUATE TOTAL 714 770 2 1,486 100.0%
48.0% 51.8% 0.1% 100.0%
GRADUATE
Non-Resident Alien 1 16 17 0 33 2.09%
Hispanic 2 18 43 0 61 3.87%
American Indian or Alaskan Native 3 3 3 0 6 0.38%
Asian 4 24 34 0 58 3.68%
Black or African American 5 34 80 0 114 7.23%
Hawaiian or Pacific Islander 6 0 2 0 2 0.13%
White 7 461 803 1 1,265 80.22%
More than one 8 4 9 0 13 0.82%
Unknown 9 8 17 0 25 1.59%
GRADUATE TOTAL 568 1,008 1 1,577 100.0%
36.0% 63.9% 0.1% 100.0%
UNIVERSITY
Non-Resident Alien 1 95 55 1 151 4.93%
Hispanic 2 39 75 0 114 3.72%
American Indian or Alaskan Native 3 5 6 0 11 0.36%
Asian 4 41 59 0 100 3.26%
Black or African American 5 109 159 0 268 8.75%
Hawaiian or Pacific Islander 6 1 5 0 6 0.20%
White 7 924 1,332 1 2,257 73.69%
More than one 8 20 27 0 47 1.53%
Unknown 9 48 60 1 109 3.56%
UNIVERSITY TOTAL 1,282 1,778 3 3,063 100.0%
6 of 11
Full-Time/Part-Time Enrollment by College and Gender Xavier University, Office of Institutional Research
Full-Time Part-Time Full-Time Part-Time Full-Time Part-Time Full-Time Part-Time
(12+) (0-11) Total (12+) (0-11) Total (12+) (0-11) Total (12+) (0-11) Total
Undergraduate
College of Arts & Sciences 20 211 231 16 239 255 0 0 0 36 450 486
Williams College of Business 23 255 278 5 114 119 0 0 0 28 369 397
College of Social Sciences, Health & Education 6 68 74 10 270 280 0 0 0 16 338 354
No College 1 130 131 1 115 116 0 2 2 2 247 249
Undergraduate Total 50 664 714 32 738 770 0 2 2 82 1,404 1,486
Full-Time Part-Time Full-Time Part-Time Full-Time Part-Time Full-Time Part-Time
Graduate (9+) (0-8) Total (9+) (0-8) Total (9+) (0-8) Total (9+) (0-8) Total
College of Arts & Sciences 0 2 2 0 7 7 0 0 0 0 9 9
Williams College of Business 50 262 312 34 102 136 0 0 0 84 364 448
College of Social Sciences, Health & Education 44 210 254 133 732 865 0 1 1 177 943 1,120
Graduate Total 94 474 568 167 841 1,008 0 1 1 261 1,316 1,577
Full-Time Part-Time Full-Time Part-Time Full-Time Part-Time Full-Time Part-Time Total
Total University
College of Arts & Sciences 20 213 233 16 246 262 0 0 0 36 459 495
Williams College of Business 73 517 590 39 216 255 0 0 0 112 733 845
College of Social Sciences, Health & Education 50 278 328 143 1,002 1,145 0 1 1 193 1,281 1,474
No College 1 130 131 1 115 116 0 2 2 2 247 249
University Total 144 1,138 1,282 199 1,579 1,778 0 3 3 343 2,720 3,063
Summer 2014
7 of 11 Enrollment by State
Xavier University, Office of Institutional Research
STATE Undergraduate Graduate TOTAL STATE Undergraduate Graduate TOTAL
Students % Students % Students % Students % Students % Students %
Alabama 2 0.13% 0 0.00% 2 0.07% New Hampshire 1 0.07% 4 0.25% 5 0.16%
Alaska 0 0.00% 0 0.00% 0 0.00% New Jersey 9 0.61% 4 0.25% 13 0.42%
Arizona 3 0.20% 1 0.06% 4 0.13% New Mexico 0 0.00% 1 0.06% 1 0.03%
Arkansas 1 0.07% 0 0.00% 1 0.03% New York 48 3.23% 1 0.06% 49 1.60%
California 20 1.35% 4 0.25% 24 0.78% North Carolina 2 0.13% 4 0.25% 6 0.20%
Colorado 6 0.40% 0 0.00% 6 0.20% North Dakota 0 0.00% 0 0.00% 0 0.00%
Connecticut 8 0.54% 3 0.19% 11 0.36% Ohio 794 53.43% 1,243 78.82% 2,037 66.50%
Delaware 1 0.07% 0 0.00% 1 0.03% Oklahoma 0 0.00% 0 0.00% 0 0.00%
Dist. Columbia 1 0.07% 0 0.00% 1 0.03% Oregon 1 0.07% 1 0.06% 2 0.07%
Florida 10 0.67% 1 0.06% 11 0.36% Pennsylvania 25 1.68% 4 0.25% 29 0.95%
Georgia 6 0.40% 1 0.06% 7 0.23% Rhode Island 3 0.20% 0 0.00% 3 0.10%
Hawaii 0 0.00% 0 0.00% 0 0.00% South Carolina 1 0.07% 1 0.06% 2 0.07%
Idaho 1 0.07% 1 0.06% 2 0.07% South Dakota 0 0.00% 0 0.00% 0 0.00%
Illinois 75 5.05% 0 0.00% 75 2.45% Tennessee 14 0.94% 4 0.25% 18 0.59%
Indiana 85 5.72% 23 1.46% 108 3.53% Texas 15 1.01% 5 0.32% 20 0.65%
Iowa 0 0.00% 0 0.00% 0 0.00% Utah 1 0.07% 1 0.06% 2 0.07%
Kansas 4 0.27% 1 0.06% 5 0.16% Vermont 0 0.00% 0 0.00% 0 0.00%
Kentucky 120 8.08% 191 12.11% 311 10.15% Virginia 6 0.40% 2 0.13% 8 0.26%
Louisiana 0 0.00% 0 0.00% 0 0.00% Washington 2 0.13% 0 0.00% 2 0.07%
Maine 3 0.20% 6 0.38% 9 0.29% West Virginia 11 0.74% 4 0.25% 15 0.49%
Maryland 11 0.74% 1 0.06% 12 0.39% Wisconsin 11 0.74% 5 0.32% 16 0.52%
Massachusetts 19 1.28% 13 0.82% 32 1.04% Wyoming 0 0.00% 0 0.00% 0 0.00%
Michigan 25 1.68% 7 0.44% 32 1.04%
Minnesota 12 0.81% 2 0.13% 14 0.46% US Military 0 0.00% 0 0.00% 0 0.00%
Mississippi 0 0.00% 0 0.00% 0 0.00% Puerto Rico 1 0.07% 0 0.00% 1 0.03%
Missouri 13 0.87% 1 0.06% 14 0.46% N. Mariana Islands 1 0.07% 0 0.00% 1 0.03%
Montana 0 0.00% 0 0.00% 0 0.00% Virgin Islands 0 0.00% 0 0.00% 0 0.00%
Nebraska 3 0.20% 2 0.13% 2 0.07% Foreign Country 92 6.19% 29 1.84% 121 3.95%
Nevada 0 0.00% 0 0.00% 0 0.00% Unknown 19 1.28% 6 0.38% 25 0.82%
TOTALS: 1,486 48.51% 1,577 51.49% 3,063 100.00%
8 of 11
Enrollment by Country of Origin
Xavier University, Office of Institutional Research
COUNTRY Undergraduate Graduate TOTAL COUNTRY Undergraduate Graduate TOTAL
Students % Students % Students % Students % Students % Students %
Brazil 5 5.43% 0 0.00% 5 4.13% Nigeria 4 4.35% 0 0.00% 4 3.31%
Canada 2 2.17% 0 0.00% 2 1.65% Pakistan 1 1.09% 0 0.00% 1 0.83%
China 6 6.52% 1 3.45% 7 5.79% Peru 1 1.09% 0 0.00% 1 0.83%
Colombia 1 1.09% 0 0.00% 1 0.83% Philippines 0 0.00% 1 3.45% 1 0.83%
Congo Kinshasa 2 2.17% 0 0.00% 2 1.65% Saudi Arabia 47 51.09% 4 13.79% 51 42.15%
Finland 1 1.09% 0 0.00% 1 0.83% Singapore 0 0.00% 1 3.45% 1 0.83%
Germany 1 1.09% 0 0.00% 1 0.83% South Korea 1 1.09% 11 37.93% 12 9.92%
Honduras 1 1.09% 0 0.00% 1 0.83% Taiwan 0 0.00% 2 6.90% 2 1.65%
India 0 0.00% 3 10.34% 3 2.48% Thailand 1 1.09% 1 3.45% 2 1.65%
Iraq 1 1.09% 0 0.00% 1 0.83% The Bahamas 0 0.00% 1 3.45% 1 0.83%
Japan 1 1.09% 0 0.00% 1 0.83% Turkey 1 50.00% 0 0.00% 1 33.33%
Kenya 4 4.35% 0 0.00% 4 3.31% Uganda 1 50.00% 0 0.00% 1 33.33%
Libya 1 1.09% 0 0.00% 1 0.83% United Arab Emirates 0 0.00% 1 3.45% 1 0.83%
Malaysia 1 1.09% 0 0.00% 1 0.83% United Kingdom 2 2.17% 0 0.00% 2 1.65%
Mauritania 1 1.09% 0 0.00% 1 0.83% Venezuela 3 3.26% 1 3.45% 4 3.31%
Morocco 0 0.00% 1 3.45% 1 0.83% Vietnam 2 2.17% 1 3.45% 3 2.48%
TOTALS: 92 76.03% 29 23.97% 121 100.00%
9 of 11
Enrollment by Religious Affiliation
Xavier University, Office of Institutional Research
Banner Undergraduate Graduate All
Code Students Students Students
# % # % # %
Baptist BP 77 5.18% 63 3.99% 140 4.57%
Buddhist BU 2 0.13% 5 0.32% 7 0.23%
Church of Christ CC 22 1.48% 19 1.20% 41 1.34%
Congregational CG 4 0.27% 0 0.00% 4 0.13%
Disciples of Christ DC 5 0.34% 3 0.19% 8 0.26%
Episcopalian EP 9 0.61% 11 0.70% 20 0.65%
Hindu HI 3 0.20% 13 0.82% 16 0.52%
Islam IS 40 2.69% 8 0.51% 48 1.57%
Jewish JE 13 0.87% 15 0.95% 28 0.91%
Lutheran LT 25 1.68% 27 1.71% 52 1.70%
Methodist MT 47 3.16% 40 2.54% 87 2.84%
No religion NR 28 1.88% 34 2.16% 62 2.02%
Other Christian OC 147 9.89% 179 11.35% 326 10.64%
Other non-Christian ON 1 0.07% 15 0.95% 16 0.52%
Other Protestant OP 9 0.61% 7 0.44% 16 0.52%
Orthodox Catholic OR 13 0.87% 1 0.06% 14 0.46%
Presbyterian PR 19 1.28% 23 1.46% 42 1.37%
Roman Catholic RC 697 46.90% 551 34.94% 1,248 40.74%
Unitarian UN 2 0.13% 4 0.25% 6 0.20%
Declined to Disclose & Unknown 323 21.74% 559 35.45% 882 28.80%
TOTAL 1,486 100.00% 1,577 100.00% 3,063 100.00%
* NOTE: The Catholic percentages, exclusive of the categories "Declined to Disclose & Unknown", are as follows:
Undergraduate 697 of 1,163 = 59.93%
Graduate 551 of 1,018 = 54.13%
All Students 1,248 of 2,181 = 57.22%
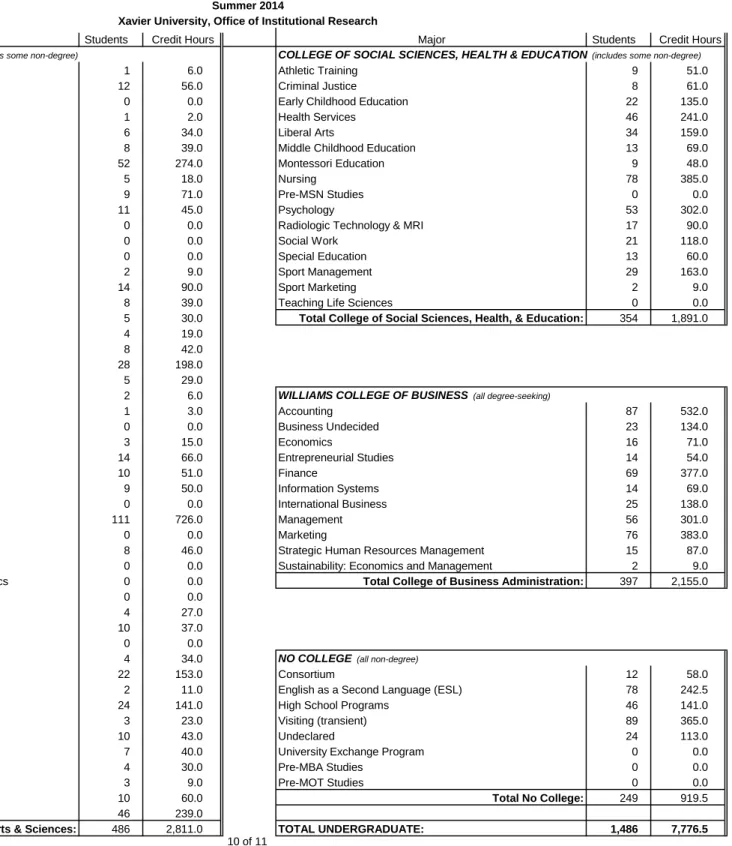
Major Students Major Students Credit Hours
COLLEGE OF ARTS AND SCIENCES (includes some non-degree) COLLEGE OF SOCIAL SCIENCES, HEALTH & EDUCATION (includes some non-degree)
Actuarial Science 1 6.0 Athletic Training 9 51.0
Advertising 12 56.0 Criminal Justice 8 61.0
Applied Biology 0 0.0 Early Childhood Education 22 135.0
Applied Chemistry 1 2.0 Health Services 46 241.0
Applied Physics 6 34.0 Liberal Arts 34 159.0
Art 8 39.0 Middle Childhood Education 13 69.0
Biology 52 274.0 Montessori Education 9 48.0
Biophysics 5 18.0 Nursing 78 385.0
Chemical Science 9 71.0 Pre-MSN Studies 0 0.0
Chemistry 11 45.0 Psychology 53 302.0
Classics 0 0.0 Radiologic Technology & MRI 17 90.0
Classical Humanities 0 0.0 Social Work 21 118.0
Communication Arts 0 0.0 Special Education 13 60.0
Communication Arts Undecided 2 9.0 Sport Management 29 163.0
Computer Science 14 90.0 Sport Marketing 2 9.0
Communication Studies 8 39.0 Teaching Life Sciences 0 0.0
Economy, Sustainability and Society 5 30.0 Total College of Social Sciences, Health, & Education: 354 1,891.0
Economics 4 19.0
Electronic Media 8 42.0
English 28 198.0
Environmental Science 5 29.0
French 2 6.0 WILLIAMS COLLEGE OF BUSINESS (all degree-seeking)
Gender and Diversity Studies 1 3.0 Accounting 87 532.0
German 0 0.0 Business Undecided 23 134.0
Graphic Design 3 15.0 Economics 16 71.0
History 14 66.0 Entrepreneurial Studies 14 54.0
Honors Program 10 51.0 Finance 69 377.0
International Studies 9 50.0 Information Systems 14 69.0
Land, Agriculture and Community 0 0.0 International Business 25 138.0
Liberal Arts 111 726.0 Management 56 301.0
Life Sciences for Business 0 0.0 Marketing 76 383.0
Mathematics 8 46.0 Strategic Human Resources Management 15 87.0
Medical Laboratory Sciences 0 0.0 Sustainability: Economics and Management 2 9.0
Modern Languages and International Economics 0 0.0 Total College of Business Administration: 397 2,155.0
Music 0 0.0
Music Education 4 27.0
Natural Sciences 10 37.0
Organizational Communications 0 0.0
Philosophy 4 34.0 NO COLLEGE (all non-degree)
Philosophy, Politics and the Public 22 153.0 Consortium 12 58.0
Physics 2 11.0 English as a Second Language (ESL) 78 242.5
Political Science 24 141.0 High School Programs 46 141.0
Pre-Pharmacy (non-degree only) 3 23.0 Visiting (transient) 89 365.0
Public Relations 10 43.0 Undeclared 24 113.0
Sociology 7 40.0 University Exchange Program 0 0.0
Spanish 4 30.0 Pre-MBA Studies 0 0.0
Theatre 3 9.0 Pre-MOT Studies 0 0.0
Theology 10 60.0 Total No College: 249 919.5
Undecided 46 239.0
Total College of Arts & Sciences: 486 2,811.0 TOTAL UNDERGRADUATE: 1,486 7,776.5
Credit Hours
Enrollment by Departmental Majors: Undergraduate Students (Primary Major) Summer 2014
11 of 11
Enrollment by Departmental Majors: Graduate Students (Primary Major) Xavier University, Office of Institutional Research
Major Students Credit Hours Major Students Credit Hours
COLLEGE OF ARTS AND SCIENCES (includes some non-degree) COLLEGE OF SOCIAL SCIENCES, HEALTH & EDUCATION (includes some non-degree)
Consortium 0 0.0 Clinical Mental Health Counseling 87 465.0
English 3 12.0 Clinical Psychology (PsyD) 58 282.0
Theology 6 17.0 Consortium 1 3.0
Counseling 47 228.0
Total College of Arts and Sciences: 9 29.0 Criminal Justice 7 55.0
Educational Administration 112 622.0
WILLIAMS COLLEGE OF BUSINESS (includes some non-degree) Elementary Education 190 1,021.0
Business Intelligence 6 51.0 Health Services Administration 45 214.0
Consortium 0 0.0 Healthcare Law 1 4.0
Executive MBA 0 0.0 Human Resource Development 29 96.0
Finance 26 147.0 Leadership Studies 4 15.0
Health Industry 1 6.0 Montessori Education 58 240.0
International Business 13 108.0 Multicultural Literature for Children 0 0.0
Business Administration (No Concentration) 374 2,162.5 Nursing (all areas) 178 1,272.0
Management 9 57.0 Occupational Therapy 21 63.0
Management Information Systems 1 3.0 Psychology 26 105.0
Marketing 13 84.0 Reading Specialist 56 300.0
Post-MBA (XTRA non-degree) 1 6.0 Secondary Education 79 378.0
Pricing Strategy 3 15.0 Special Education 90 460.0
Transient/Visiting 1 3.0 Sport Administration 29 189.0
University Exchange Program 0 0.0 Transient/Visiting 2 0
Values-Based Leadership 0 0.0
Total College of Social Sciences, Health & Education: 1,120 6,012.0
Total Williams College of Business: 448 2,642.5 TOTAL GRADUATE: 1,577 8,683.5