Marine Policy 117 (2020) 103958
Available online 29 April 2020
0308-597X/© 2020 The Authors. Published by Elsevier Ltd. This is an open access article under the CC BY license (http://creativecommons.org/licenses/by/4.0/).
Supporting the essential - Recommendations for the development of
accessible and interoperable marine biological data products
D. Lear
a,*, P. Herman
b, G. Van Hoey
c, L. Schepers
d, N. Tonn
�
e
e, M. Lipizer
f, F.
E. Muller-Karger
g, W. Appeltans
h, W.D. Kissling
i, N. Holdsworth
j, M. Edwards
a, E. Pecceu
c,
H. Nygård
k, G. Canonico
l, S. Birchenough
m, G. Graham
a, K. Deneudt
d, S. Claus
d, P. Oset
d aMarine Biological Association, Citadel Hill, Plymouth, UKbDeltares, Boussinesqweg 1, 2629 HV Delft, the Netherlands
cResearch Institute for Agriculture, Fisheries and Food, Ankerstraat 1, 8400, Oostende, Belgium dFlanders Marine Institute, Wandelaarkaai 7, 8400 Oostende, Belgium
eEMODnet Secretariat, InnovOcean Site, Wandelaarkaai 7, 8400 Oostende, Belgium
fIstituto Nazionale di Oceanografia e di Geofisica Sperimentale, Borgo Grotta Gigante 42/C, 34010, Sgonico TS, Italy gUniversity of South Florida, 4202 E Fowler Ave, Tampa, FL 33620, USA
hIntergovernmental Oceanographic Commission of UNESCO, Wandelaarkaai 7, 8400 Oostende, Belgium
iInstitute for Biodiversity and Ecosystem Dynamics (IBED), University of Amsterdam, P.O. Box 94240, 1090 GE, Amsterdam, The Netherlands jInternational Council for the Exploration of the Seas, H. C. Andersens Blvd. 46, 1553 København, Denmark
kFinnish Environment Institute, Latokartanonkaari 11, 00790 Helsinki, Finland
lNational Oceanic and Atmospheric Administration, 1315 East-West Highway 2nd Floor, Silver Spring, MD 20910, USA mCefas, Pakefield Rd, Lowestoft, UK
A R T I C L E I N F O Keywords:
Biodiversity Data Data products Stakeholder engagement EOV
EBV
A B S T R A C T
In this paper we outline the stakeholder-led approaches in the development of biological data products to support effective conservation, management and policy development. The requirements of a broad range of stakeholders and iterative, structured processes framed the development of tools, models and maps that support the FAIR (Findable, Accessible, Interoperable, Reusable) data principles. By structuring the resultant data products around the emerging biological Essential Ocean Variables, and through the engagement with a broad range of end-users, the EMODnet (European Marine Observation and Data Network) Biology project has delivered a suite of demonstration data products. These products are presented in the European Atlas of Marine Life, an online resource demonstrating the value of open marine biodiversity data and help to answer fundamental and policy- driven questions related to managing the natural and anthropogenic impacts in European waters.
1. Introduction
The need for effective management and custodianship of our seas has never been greater, as highlighted by specific targets for the marine environment within Goal 14 of the UN Sustainable Development Goals [1], multiple Aichi Targets [2], the UN declaration of a Decade of Ocean Science for Sustainable Development (2021–2030) and increasing
pub-lic awareness on the anthropogenic impacts on the marine environments [3,4]. Societal benefits of ocean observation and data include supporting human health, safety and economy through improved understanding of the changes in marine ecosystems [5], the status of living resources and the current health of the oceans. Knowledge of the marine environment
is essential to draft national and global policy agendas, such as the ocean-related Sustainable Development Goals [6], and to inform global ocean assessments and conservation targets (e.g., IPBES, World Ocean Assessment, CBD Aichi targets). In addition, the increased knowledge about the Earth’s system and climate change helps to prepare society for
natural risks, such as storms, droughts, rainfall anomalies and wet sea-sons [7,8].
These drivers require marine baseline data, especially biological data combined with physical and chemical parameters, to create effective, evidence-based information that is critical to support conservation and management of the marine environment. However, collecting robust and fit for purpose evidence in the marine environment is logistically
* Corresponding author.
E-mail address: [email protected] (D. Lear).
Contents lists available at ScienceDirect
Marine Policy
journal homepage: http://www.elsevier.com/locate/marpol
https://doi.org/10.1016/j.marpol.2020.103958
challenging, complex and expensive. The complexity is aggravated by the irreversibility of time. When new management and policy issues surface, historical time series suitable for detecting changes and effects of management policies are often lacking or of insufficient quality. This is especially true for biodiversity data, where data series are often too short to avoid the problem of ‘shifting baselines’, suitable control areas
(e.g. areas without fishing pressure) are lacking and indicator develop-ment and application are limited because the necessary data have not been collected in the past. There is a growing need to assemble, stan-dardize and make available whatever historic data on the marine ecosystem are available, in order to fill this gap in reference data.
1.1. EMODnet and essential variables
As a first step in this process, the European Marine Observation and Data Network (EMODnet) has undertaken unparalleled activity in the collation and standardisation of marine environmental data from all European seas and the wider North East Atlantic region since 2009 [9,
10] through a series of thematic projects and a coordinating secretariat. EMODnet Biology, the thematic lot on marine biological data, has currently collated and standardised more than 25 million species ob-servations. Significant efforts have also been invested in the adoption and further development of standards, guidelines and best practices for the initial acquisition of biological and biodiversity observations, and their subsequent curation and publication [11–14] and how these can be maintained to meet future challenges [15].
Despite all efforts, it is clear that historic data on marine biodiversity and ecosystems are scattered, incomplete and insufficient for future policy needs in marine management. In order to improve this situation, targeted efforts by the international community have concentrated on the development of Essential Ocean Variables (EOVs) [16–18] to pro-mote cost-effective, interoperable observations across multiple platform types and on Essential Biodiversity Variables (EBVs) to provide infor-mation on the traits, health and diversity of organisms and communities
[19–21]. Efforts to collate existing historical data should complement
this approach, by providing, wherever possible, databased descriptions of past conditions that are consistent with these selected variables and monitoring strategies.
Whilst these future-oriented approaches are valuable, a dedicated EMODnet Biology workstream on outreach and stakeholder engagement revealed an imminent need, amongst a broad range of stakeholders and communities, for scalable, information-rich data products describing past and present states of the marine system. A diversity of policy and operational needs have been identified. Emphasis was placed on the need to enable comparisons across member states and sea basins. Through being based on transparent (open-access) data and interna-tional standards, the products are requested to be interoperable, reproducible and as such facilitate the (re)creation of similar products across governments, regulatory authorities, academia, NGOs and industry.
In this paper we aim to showcase and analyse the work of EMODnet Biology in the development of stakeholder-led data products to support conservation, management and advisory decisions by regulators, in-dustry and policy makers. Following a definition of the term “Data
Product” we explain the steps taken to ensure the resultant products are
meeting specific use-cases, derived from a range of stakeholder engagement exercises and through the synthesis of previous exercises in reviewing the availability and applicability of marine biological data. We critically review the development of these products and illustrate what improvements could be achieved in subsequent iterations. The EMODnet Biology Engagement Lifecycle (Fig. 1) summarises the ongoing approach and methodology.
2. What is a data product?
In order to ensure a common understanding with stakeholders,
policy makers and the academic community it is vital that all parties can agree on what constitutes a biological data product.
The Remote Sensing community has a well-defined system for the definition of data products [22], but no similar standards exist for the ecological communities. Within EMODnet Biology a common set of definitions is essential to streamline development and to ensure stake-holders are working to a common set of standards in order to fulfil wider expectations.
The EU Horizon 2020 funded ENVRI Plus project sought to develop a common, cross-Research Infrastructure approach within the environ-mental science domain. Central to this is a standard Reference Model
(https://confluence.egi.eu/display/EC/ENVRIþReferencþModel).
Within the context of the ENVRI Plus Reference Model a data product is “an instance of persistent [meta]data which has been processed to be offered to external users.” [23]. This approach to defining data products
has also been adopted by the Research Data Alliance based on the guidelines from DataONE (https://www.dataone.org/best-practices/de
scribe-method-create-derived-data-products).
2.1. Data product categorisation
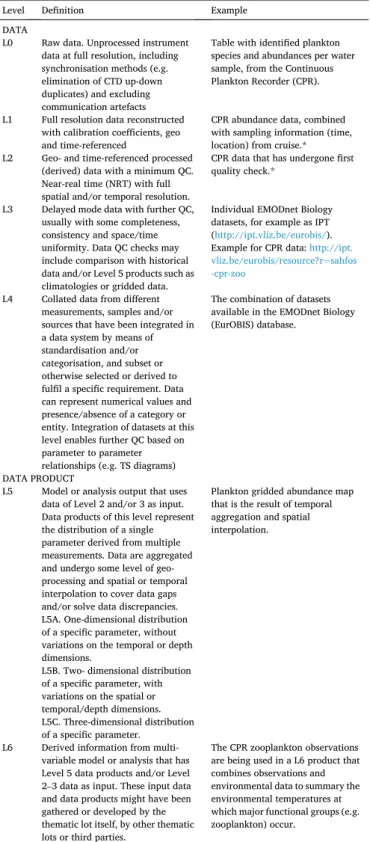
As a single definition this is adequate, however the range of potential data and data products required within the marine ecology community requires a tiered approach to describing a data product. EMODnet has developed a series of categories defining data and data products based on the amount of processing and/or analysis that has taken place to come to a particular level, as defined in Table 1. These categorisations align with the suggestions for EBV data products as outlined in Kissling et al., [20]. In the case of EMODnet each data category (from 0 to 4) implies an increased amount of processing and quality control with regards to the previous level(s), ranging from raw data to harmonized collections of thematic quality controlled (QC’d) data. Additionally, two
categories of data products (from 5 to 6) are also defined according to the complexity of the processing needed. Data products of Level 5 (a,b and c) display the modelled distribution of a single parameter (e.g. species occurrence or abundance, chlorophyll), built upon QC’d data
from levels described previously. Data products of Level 6 are the result of multi-variate modelling that may include both data and data products as inputs (e.g. predicted seabed habitats).
These categories have been developed as part of an effort undertaken to compile the current offer available across the EMODnet thematic lots in the EMODnet Data and Data Product Portfolio [24]. The definitions serve as a basis for communication among the seven EMODnet themes as well as with the wider community to help users to better understand the different types of available data and data products that could be used or deployed for multiple purposes and applications. The portfolio is a living document that will be updated regularly, through the EMODnet Central portal.
3. How data products can support global marine management
There is an increasing need to monitor the marine environment for conservation and legislative reasons which in response encourages global science-driven initiatives for development of state metrics such as ‘Essential Ocean/Biodiversity Variables’ (EOVs and EBVs) for the Global
Ocean Observing System (GOOS) and the Group on Earth Observations Biodiversity Observation Network (GEO BON). The network of EMOD-net observations operating in the Atlantic as well as integrated obser-vation programmes such as the EU Horizon 2020 project ‘AtlantOS’ are
seen as a critical ongoing network for a sustained and internationally coordinated effort for biological observation at these ocean-basin scales [25].
Biology and ecosystem EOVs are currently in development with input from global experts and cover phytoplankton biomass and di-versity; zooplankton biomass and didi-versity; fish abundance and distri-bution; marine turtles, birds and mammals abundance and distridistri-bution; hard coral cover and composition; seagrass cover and composition; mangrove cover and composition and macroalgal canopy cover and composition and ocean sound [16]; EOV list at http://goosocean. org/eov).
3.1. Challenges of indicator development
A key component for the development and then successful uptake of ocean monitoring indicators is the need for the essential variables to have a high impact in responding to scientific and societal needs and crucially are technically and practically sound hence have a high feasibility of sustained observation. These requirements are not neces-sarily mutually compatible. It is true that ocean observations are the ‘bread and butter’ of ocean and climate change science [26], but the
research community does not have the resources to continue observa-tions of variables that are unlikely to lead to new discoveries or scientific breakthroughs. There is a tendency to use advanced instrumentation and to document, describe and quantify newly-discovered and uncertain but potentially important processes. Scientists having to choose between sustained observation of chlorophyll, nutrients and phytoplankton spe-cies composition with sufficient spatial and temporal resolution using traditional methods, or application of new methods (e.g. omics, acous-tics, opacous-tics, etc) as a potential means to automate these measurements, will rarely choose the former as their top priority. Scientific effort con-centrates on expanding conceptual frameworks needed to understand new developments in natural systems and link them to governance and global change. This requires comprehensive sets of variables to be measured in order to abstract the most essential variables fit for evalu-ating policies and management actions. However, science typically works in relatively short cycles (e.g. PhD projects are normally 2 to 4 years) and can, in general, not sustain observations over time periods needed for the evaluation and correction of management policies.
On the European-level policy side, the International Council for the Exploration of the Sea (ICES) and the Regional Sea Commissions (OSPAR, HELCOM, BSC and UNEP-MAP) greatly influence the European science policy landscape. The Commissions are collaboratively imple-menting ecosystem-based management in their regions to meet the EU Marine Strategy Framework Directive [27] requirements to achieve Good Environmental Status (GES) of European seas by 2020. The legal requirements of the MSFD and Marine Spatial Planning Directive (MSPD) processes necessitate robust and defensible decisions based upon the best available evidence. The environmental monitoring required for implementing the MSFD presents high demands in terms of data collection methodologies, Quality Control and Assurance (QC/QA) and metadata. However, much of the information used to generate ev-idence is likely to be produced by bodies other than the responsible authorities, who lack the mandate and resources to execute the required monitoring efforts. Being dependent on monitoring and data collection performed by scientists, member states or regional authorities within those member states, the Commissions are forced to rely on heteroge-neous and often poorly compatible datasets as a basis for their policies and policy evaluations. Therefore, the pursuance for more harmonized monitoring across member states borders increases the scientific and monetary value of each resulting dataset, support integrated status as-sessments and increase cost-efficiency [28]. At the other side, the
Table 1
Categories of Data Products as defined by EMODnet and developed by EMODnet Biology partners. *Note that data from EMODnet Biology are only distributed from L2 and above.
Level Definition Example
DATA
L0 Raw data. Unprocessed instrument data at full resolution, including synchronisation methods (e.g. elimination of CTD up-down duplicates) and excluding communication artefacts
Table with identified plankton species and abundances per water sample, from the Continuous Plankton Recorder (CPR). L1 Full resolution data reconstructed
with calibration coefficients, geo and time-referenced
CPR abundance data, combined with sampling information (time, location) from cruise.* L2 Geo- and time-referenced processed
(derived) data with a minimum QC. Near-real time (NRT) with full spatial and/or temporal resolution.
CPR data that has undergone first quality check.*
L3 Delayed mode data with further QC, usually with some completeness, consistency and space/time uniformity. Data QC checks may include comparison with historical data and/or Level 5 products such as climatologies or gridded data.
Individual EMODnet Biology datasets, for example as IPT (http://ipt.vliz.be/eurobis/). Example for CPR data: http://ipt. vliz.be/eurobis/resource?r¼sahfos -cpr-zoo
L4 Collated data from different measurements, samples and/or sources that have been integrated in a data system by means of standardisation and/or categorisation, and subset or otherwise selected or derived to fulfil a specific requirement. Data can represent numerical values and presence/absence of a category or entity. Integration of datasets at this level enables further QC based on parameter to parameter relationships (e.g. TS diagrams)
The combination of datasets available in the EMODnet Biology (EurOBIS) database.
DATA PRODUCT
L5 Model or analysis output that uses data of Level 2 and/or 3 as input. Data products of this level represent the distribution of a single parameter derived from multiple measurements. Data are aggregated and undergo some level of geo- processing and spatial or temporal interpolation to cover data gaps and/or solve data discrepancies. L5A. One-dimensional distribution of a specific parameter, without variations on the temporal or depth dimensions.
L5B. Two- dimensional distribution of a specific parameter, with variations on the spatial or temporal/depth dimensions. L5C. Three-dimensional distribution of a specific parameter.
Plankton gridded abundance map that is the result of temporal aggregation and spatial interpolation.
L6 Derived information from multi- variable model or analysis that has Level 5 data products and/or Level 2–3 data as input. These input data and data products might have been gathered or developed by the thematic lot itself, by other thematic lots or third parties.
The CPR zooplankton observations are being used in a L6 product that combines observations and environmental data to summary the environmental temperatures at which major functional groups (e.g. zooplankton) occur.
evidence-generating bodies often lack the resources to utilise raw data and need some kind of readily available and directly useable data sets (Type 4 as defined in Table 1) or products (Type 5–6 as defined in Table 1).
3.2. The role of EMODnet data products
EMODnet data products operate at the intersection of these different agents, interests and constraints. With respect to content, EMODnet Biology data products serve a function to provide historic background on the most important variables within the globally defined Essential Ocean Variables. EMODnet provides some of the critical data infra-structure to allow the distribution of European EOV data and the crea-tion of data products and contributes to and also uses data from global networks such as the Ocean Biogeographic Information System (OBIS) of the International Oceanographic Data and Information Exchange pro-gramme (IODE) of IOC-UNESCO.
With respect to policy, governments and public bodies require evi-dence in a wide range of situations, from long-term policy development to urgent crisis management [29], often with an estimation of uncer-tainty. In many cases existing data were not purposefully collected to fulfil these needs. New needs arise as the state of the ocean changes (e.g. due to global change), the use of the sea changes (e.g. construction of wind farms, increased sand mining to protect shores, new forms of aquaculture, etc) or the interest of the public to particular aspects changes (e.g. increased importance of emblematic and charismatic species). One of the challenges in preparing data products is to make optimal use of existing data to fulfil these varied needs as much as possible. Ideally, the critical appraisal of the products should feed back into the (re)design of future monitoring programmes.
Since the challenges facing marine and coastal ecosystems are complex, decision making requires integration of new and evolving knowledge in a transparent and accountable manner. Such an approach is exemplified by the EMODnet Seabasin Checkpoint exercises detailed later in this paper, and the global development of EOVs and EBVs. Comparison between the policy needs and the availability of data and data products can lead to more informed and efficient environmental monitoring assessment strategies with benefits for governments, in-dustry, society and the economy. Transparency, the flexibility to incorporate interdisciplinary and multi-sector datasets and the ability to visualise the decision-making process result in a powerful framework to support discussions with experts, stakeholders and policy makers [30].
4. Informing the discussion – the EMODnet Checkpoint Data Adequacy Reports
The EMODnet Sea-Basin Checkpoints exercises (http://www.emo
dnet.eu/checkpoints) were carried out to test the quality of the
currently available observation data. These “Checkpoints” evaluate
EMODnet-held data at the scale of regional sea-basins (Arctic, Atlantic, Baltic Sea, Black Sea, Mediterranean Sea, North Sea) by testing the data availability and quality against specific pre-defined end-user ‘chal-lenges’. Common challenges were evaluated in all basins for 7 maritime
applications, which were of an economic nature (wind farm, oil plat-forms, fisheries) or directly related to conservation policy (Marine Protected areas, eutrophication, alien species and river input).
4.1. Approach of the data adequacy reports
As part of the stakeholder engagement, as outlined in Section 4.3
below and to inform the development of data products with an end-user- centric approach, the Data Adequacy Reports [31–35], generated for the
Sea-Basin checkpoint exercises were evaluated by the authors for bio-logical data and product needs. These reviews were then used to identify data and data product gaps which, if met, would support the develop-ment of these challenges at the aforedevelop-mentioned sea-basin scales.
Therefore, we listed for each challenge what type of biological data (species, abundance or biomass data for certain ecosystem component) and data products (spatial maps, modelling, time series) were needed (Table 2).
Despite the common outline of the challenges (detailed below), they were tackled differently over the sea-basins. Existing data and products were used for some basins (Baltic, North Sea), whereas other basins mainly looked to potential data and known data gaps that need to be gathered and filled.
4.2. Summarising the checkpoint exercises
Our summary of the Checkpoint exercises (Table 2) shows that in relation to biological data needs, data about mammals, fish, birds and phytoplankton are most requested. Indirectly, sea-bottom fauna data are needed to construct habitat maps for the sea-basins. Spatial distribution maps and phytoplankton time-series were identified as data products that are requested to address several of the challenges.
For two of the challenges, bathymetric maps and coastal protection, the ecological aspects were not specified in the objective definition and therefore not further considered in detail. The wind farm siting challenge aimed to identify potential new wind farm sites, considering generating capacity, construction and maintenance, potential environment impacts and current sea-use factors. To serve this challenge, there was a clear requirement for distribution maps for cetaceans and seabirds and additionally, data on population characteristics (including migration) as summarised in Table 2.
For the Marine Protected Area (MPA) challenge spatial maps of ecologically important species (e.g. HELCOM, OSPAR species lists of ecologically important marine species) were needed to gain an under-standing of whether the ecological coherence of a network of MPAs is robust enough to represent a series of processes and patterns that are reflecting the ecological nature and overall processes taking place in the wider environment.
The challenge relating to an oil platform leak was to determine the likely trajectory of the slick resulting from a (simulated) leak at an oil platform and the likelihood that sensitive coastal habitats, species or tourist beaches would be impacted. For this challenge, there was nothing reported on sensitive coastal habitats or species, except for the Arctic, where spatial maps of the occurrence of certain charismatic megafauna (birds, cetaceans, polar bears) can be helpful.
To serve the climate change challenge temporal data for selected climate (temperature, internal energy, ice and phytoplankton [not in North Sea – Med]) and coastal (sea level rise, sediment balance)
vari-ables were requested. The only biotic variable, phytoplankton time se-ries were mostly available in the sea-basins, but were found to be both temporally and spatially ‘patchy’ (only present for certain sub-areas),
resulting in a low confidence to predict climate related changes of the ecosystem on sea basin scale.
The fisheries management challenge aimed to produce basin-wide statistics on biomass, number of landings of commercial fish discards and bycatch (of fish, mammals, reptiles and seabirds) by species and year. Those fishery statistics were available for most sea-basins, however the collected data on fisheries discards and/or bycatch are less readily available (including fragmented or missing data on protected, endan-gered and threatened species) than commercial landings or catch data. The fisheries impact challenge sought to evaluate where seabed habi-tats have been disturbed by bottom trawling (numbers of disturbances per month and how this changes over the past ten years) and damage to sea floor to both living and non-living components (Arctic). This chal-lenge could not be met for the biological components, due to inadequate data (and product) availability at the time. The availability of data has increased since the Checkpoint exercise, but much still remains inac-cessible. In all the sea-basins, well known issues related to fisheries data were mentioned (data limitations, resolution, gaps in the data with re-gard to fisheries discards, by-catch and spatial activity, fragmented data
and privacy issues).
In relation to the river inputs challenge, the data adequacy reports outlined the need for data and products focused on the migration of salmon and eels. Migration data are a clear gap in the classic databases and products, as these types of data are collected by new technologies (E.g. species tagging and the use of biosensors), generating differing types of data.
The objective of the alien species challenge was to provide a table and digital map of alien species in each of the sea basins. The available in-formation included: species name; classification (fish, algae, mammals, sponges etc); year of introduction; possible cause or vector of intro-duction (climate change, ballast water discharge etc); geographical area; impact on ecosystem and economy. In this challenge, products reflecting distributions over time are very useful, but difficult to make, due to lack of comprehensive, comparable datasets, the exception being for Mar-enzelleria spp. in the Baltic Sea region.
In the eutrophication challenge data adequacy reports, no real focus on biological data was made, as the goal was to check for gridded data layers showing changes in eutrophication (seasonal, over past 10 years). Nevertheless, spatial maps and time series on phytoplankton would be useful in the assessment.
4.3. Stakeholder consultation
In a formal discussion with relevant stakeholders,1 the EMODnet
Biology project further specified data needs and priorities for product development. Even though most participants in the discussion were operating at large scales of regional seas and global initiatives, the need for data and knowledge at a diversity of scales was immediately apparent. Important data gaps were identified in a range of marine policy and management problems. These vary from relatively localized issues such as those arising from restoration assessment and conserva-tion effectiveness, e.g. in restored coastal habitats or Marine Protected Areas, to linked local-regional scale marine spatial planning issues and identification of cumulative impacts on ecosystems to regional-sea scale issues such as eutrophication, fisheries, toxic substances and species invasions. However, even the latter type of issues tightly interacts with more local (national and subnational) policies, e.g. on nutrient and toxicant emissions, harbour policies, economic embedding of the fish-eries sector etc., and thus also require the spatial downscaling of information.
In order to provide rational, empirically based policies in all of these domains, the stakeholders identified standardised, interoperable time- series data as being a major data gap. Other gaps identified included
Table 2
Overview of the biological data and product needs when executing the EMODnet Sea-Basin Checkpoint exercises. NC.: not considered; SO: species occurrence; D: density/biomass; P: population (behaviour, reproduction); div: diversity; SM: spatial maps; TS: time series, O: other (migration); ?: not specified.
Challenges DATA PRODUCTS
Arctic Atlantic Baltic Black Sea Med Sea North Sea Arctic Atlantic Baltic Black
Sea Med Sea North Sea Wind Farm
Siting NC Birds Ecosystem NC Birds, Fish Birds, Cetaceans NC ? SM, TS, O NC ? SM
SO, D, P SO, D P, D, Div SO, P
Marine Protected Areas
NC Birds,
Cetaceans, Fish
HELCOM
Red List Ecosystem Ecosystem OSPAR spp. NC SM, O SM ? ? SM Oil Platform
Leak Birds, Cetaceans, Polar Bears
NC NC NC NC NC SM NC NC NC NC NC
Climate
Changea Phyto D Phyto D Phyto D D Phyto NC NC TS TS SM, TS TS NC NC
Fisheries
Management Fisheries Statistics SM, TS
Fisheries
Impactb Not Possible Not Possible Habitats Fisheries Statistics NC NC ? ? SM ? NC NC Riverine Input Salmon, Eel Salmon, Eel Salmon NC Fish Salmon,
Eel Not Possible O No Info NC ? SM
D D D D
Alien Species SO Ecosystem Ecosystem Zooplankton NC NC SM, TS ? SM ? NC NC
SO, D, Div SO, P D, Div
Eutrophication NC NC NC Phyto NC Ecosystem NC NC NC ? NC SM, TS
D, Div SO
aSpecifically asked for Phytoplankton (Phyto). b Check if Fishery Pressure applied (VMS).
1 To explore the need of a range of stakeholders involved in environmental
conservation, management, ecosystem, environmental and strategic assess-ments a workshop was organized to collect views and suggestions on relevant data products required for the sustainable use of the sea. A heterogeneous audience coming from the Regional Sea Conventions (OSPAR, HELCOM, UNEP- MAP and BSC), from conservation bodies (UNEP/WCMC, WWF), from the Eu-ropean Environmental Agency (EEA) and from global initiatives (GEO BON, OBIS, MBON) and industry (AECOM) participated in the workshop, contrib-uting with different perspectives on data products needed to support the management of Europe’s Regional Seas. To inform these discussions the Checkpoint Data Adequacy Reports review, as summarised above, was pre-sented. Prior to the workshop participants were requested to provide feedback on their current needs for how data should be presented and what gaps were a barrier to their sectors’ activities. The full outcomes of the workshop can be reviewed in Lear et al., [49].
data relating to deep sea species and habitats, and data relating to the effects of cumulative impacts on the marine environment. Participants expressed a desire to seamlessly integrate other environmental param-eters with the biological data.
There was general consensus that the limiting factor for the provision of biological data products is not the technical format of the data or products, but the heterogeneous nature of the majority of underlying existing biological data. This can partly be overcome by providing high- quality metadata and provenance in order to increase confidence, transparency and traceability. However, it still requires the combination and standardisation of datasets from diverse origins. The provision of worked-up data sets (i.e. Level 4 data products as specified in Table 1) was therefore identified as the top priority.
Modelled presence and absence for key species and functional groups, and map-based data products including habitat maps under-pinned by species records for seagrass, macroalgae and habitat condi-tion, have been indicated as very relevant to demonstrate changes in habitat condition over time. This can inform restoration and conserva-tion effectiveness and track changes related to policy developments. In addition, summary information on species listed in legislative docu-ments (eg. Red Lists, Habitats Directive, etc) such as area statistics for different key geographic regions including Regional Seas, Marine Pro-tected Areas and national waters, may facilitate the assessment of trends in environmental status and global ecological changes. The stakeholder participants also strongly advised EMODnet Biology to frame any data products within the context of the emerging biological EOVs and EBVs as outlined above, in order to align with global initiatives and to ensure interoperability between regions.
In line with the diversity of scales in marine policy and management challenges, clear needs were expressed for data products to cover a range of spatial and temporal scales, showing trends and changes over time to assess effective conservation, management and policy measures. These scalable products should, ideally, provide a link between mapped (gridded) biological data results and a diversity of environmental vari-ables and drivers, while keeping the underlying data (e.g. occurrence of species or habitat types) visible. In addition, products demonstrating the relative importance of diverse habitat-determining variables for biodi-versity could contribute to coherent data-driven story-telling, which underlies policy development. Assessing policies, especially when some spatial variation in the applied policies exist, can profit most from (spatially differentiated) time series analysis.
However, it is very clear that ‘contributing to answering policy questions’ is very distinct from directly answering these questions.
Governance bodies such as Regional Sea Commissions have a need and obligation to tightly control the validity of the indicators used to eval-uate policies. As such they cannot depend on external organisations or projects such as EMODnet Biology to fill in this essential part of their tasks. It is therefore imperative that the products of EMODnet Biology are as neutral as possible with respect to the questions and answers regarding policy. EMODnet’s niche in the process is to provide the data
and products needed to calculate the value of indicators and to establish temporal trends in these indicators. The choice of indicators and espe-cially the final evaluation is outside this task.
These recommendations, taken in the context of the global, societal needs and informed by the gaps expressed through the Checkpoint Data Adequacy Reports, have led to the coordinated development of the Eu-ropean Atlas of Marine Life. This innovative showcase for EMODnet Biology data products delivers the tools, models and maps, demon-strating the value of open biodiversity data.
5. EMODnet biological data products, their relevance and utility
The EMODnet Biology data products were developed as example applications addressing, as much as possible, the diversity of re-quirements expressed during the stakeholder consultation. We aimed to cover the different types of data products, the different European
regional seas, and several of the most important EOVs in these example products. An important aim was also to establish workflows for biodi-versity data integration [20] that can be re-used for the preparation of further data products in the future. In order to ensure that products align with FAIR guidelines [36], all workflows are made publicly available.2
All products, including details of data used and procedures applied, are documented in the European Atlas of Marine Life website. Table 3
provides a short overview of the products.
All data products have been worked up to level Level L5B or L6 (as defined in Table 1), depending on whether some modelling was involved or not. Most products are based on more than one underlying data set, and all involve the compilation of a level L4 data layer at the basis of the analysis. These level L4 data layers are either directly available through the Github site, or following the procedures outlined in the workflow there.
5.1. Critique of gridded data products
A central data product of EMODnet Biology are gridded maps of species occurrences, as derived from the EurOBIS database. All species occurrences recorded in EMODnet, as well as other data, are stored in this database. It provides overviews or known places of occurrence for thousands of species. Combining this information with societal traits stored in WoRMS,3 such as invasiveness, protection status, status as
endangered species, etc. can provide overviews of sensitive areas and areas with high known occurrences of species with special protection status. This is of direct relevance to conservation policy, choice of ma-rine protected areas, project development and selection of areas where fishing disturbance should be reduced.
The major shortcoming of this dataset of gridded maps is that illus-trating the uncertainty of these data products is not trivial. The maps only records affirmed positives, i.e. well-established places of occur-rence, but that it gives no information on the nature of the absences. Places where a species has not been recorded can fall into two cate-gories: either the species is absent, or the species has not been observed although in reality it is present. These false negatives are not unlikely. An option for how to visualise the uncertainty of gridded maps showing species presences is to in parallel show information on the sampling effort to give hints on the spatial and temporal coverage of data. This message is illustrated for the Southern Bight of the North Sea, which is a well-sampled area, illustrating that available presence records are very unevenly spread in space. Fig. 2C illustrates the spatial distribution, gridded on a 0.05 (longitude) x 0.1 (latitude) degrees grid, of the number of ‘sampling events’ of macrobenthos per grid cell. For this map,
all campaigns targeting pelagic, epibenthic or meiobenthic groups have been excluded. Also records of single species, such as museum collec-tions, have been excluded as they provide no basis for estimating di-versity of the assemblage. Relatively large areas of the Southern Bight are represented in the database by very few samples, whereas some areas are sampled much more intensively (Fig. 2C). Areas known to be ‘special’, i.e. having rare species or exceptionally high species diversity
(Fig. 2A shows the average number of species per sample and highlights
some of these areas), are generally well sampled. However, there is considerable chance that this common knowledge overlooks high-value habitats in those areas where hardly any samples are available at all. The frequency distribution of number of samples per grid cell (Fig. 2B) is approximately log-normal, indicating that a large proportion of sam-pling and monitoring effort goes to a small proportion of the area. Although over 30,000 samples are recorded in the database, these only cover approximately one-third of the grid cells (2200 out of 6400). It is encouraging, however, that compared to many other regions which
2 See the EMODnet GitHub site http://github.com/search?q¼topic%3Abiolo
gyþorg%3AEMODnet&type¼Repositories.
often lack recent data, most of the observations here are relatively recent, with the most recent sample per grid cell coming most often from the past decade (Fig. 2D).
5.2. Traits-based approaches
The vast number of taxa encountered in the sea creates an obvious problem for the use of species distribution maps directly in policy analysis. One cannot judge the appropriateness of certain policies against occurrence maps of thousands of species, most of which have only been observed once or a relatively few times. Some form of infor-mation condensation is essential, as done through the development of indicators. A bewildering number of indicators have been proposed in the scientific literature [37]. Many of these are based on species abun-dance patterns, although recently the use of ecological traits of species has been proposed as an alternative approach [21,38], including life-history traits of benthic species related to sediment disturbance by fisheries [39,40], as well as to water quality and eutrophication [41,42]. Life-history traits are those traits such as animal adult size, time to maturity, number of offspring produced, etc. In the European Atlas of Marine Life, two products have been prepared that show the spatial distribution of life-history trait groups in macrobenthos and fish. For example, the macrobenthos product is used for further developing the
Fishery Benthic impact framework (FBIT) within ICES [43]. While not responding to policy needs directly, these intermediary products are of great importance to facilitate this type of indicator development. Other relevant intermediary products can be maps of the trait values them-selves, e.g. mean, range, max of fish size. This application is restricted to traits with a continuous numerical scale, which is only a subset of the traits used. Other applications however, such as the calculation of the bioturbation potential of the benthic fauna, combine qualitative traits with quantitative information (abundance, size) to produce targeted products yielding insight in a particular ecosystem function [44].
5.3. Addressing cumulative effects
Analysis of cumulative effects on marine ecosystems has repeatedly been mentioned by stakeholders as one of the major gaps in marine policies. Cumulative effects are difficult to estimate, because of the large number of distinct human pressures on the marine ecosystem and the complex ways in which these pressures may interact and follow diverse causal pathways of influence on the ecosystem [45]. The construction, calibration and validation of such complex interaction matrices (e.g. Ref. [46] is clearly out of the scope of EMODnet, but the project can contribute by providing spatial (and where possible temporal) data layers on a multitude of species and communities. In the face of
Table 3
EMODnet Biology Data Products. Full metadata and citations are available through the European Atlas of Marine Life.
Product Supported EOV/
Audience EMODnet Product Category
Impact/Importance Issues Addressed Doi
Gridded abundance maps of various
species/groups All EOVs L5B Evolution and distribution of key species/species groups. Marine Spatial planning, Fisheries,
Habitat specifications Neural network modelling of Baltic
zooplankton abundances Zooplankton abundance L5B Predicted gridded abundance maps of zooplankton in Baltic Sea, based on multiple sampling campaigns and using environmental information for abundance modelling
Marine Spatial planning, Eutrophication, Invasive Species
https://doi. org/10. 14284/381
Distribution of fish living modes in
European seas Fish abundance and distribution L5B Distributions of the main functional types of benthic and bentho-pelagic fish species. Marine Habitats specification Fisheries policies
https://doi. org/10. 14284/374
Distribution of benthic
macroinvertebrate living modes in European seas
Benthic invertebrate abundance and distribution
L6 Distributions of the main functional types of
benthic macroinvertebrates Marine Habitats specification Fisheries policies, related to fishing pressure on benthos Eutrophication
https://doi. org/10. 14284/373
Thermal affinities for European
marine species All EOVs L6 Shows temperature and vulnerability to temperature change of species. Global change effects on marine ecosystems https://doi. org/10. 14284/378
OOPS - Copepods: ICES Operational Oceanographic Products and Services - Gridded Copepod abundance data
Zooplankton biomass
and diversity L5B Zooplankton data of Continuous Plankton Recorder in N.Atlantic, used to illustrate temporal change in spatial patterns. ICES uses this product in their Operational Oceanographic Products and Services (OOPS)
Global change, regime shifts in marine ecosystems
https://doi. org/10. 14284/380
Invasive marine species occurring in
European marine harbours All EOVs L6 Use EMODnet Biology and EUROBIS occurrence data of invasive species to check for false negatives in samples of invasive species in harbours
Basis for ballast water policy,
Exemption policy from ballast water checks
https://doi. org/10. 14284/375
Temporal trend of invasive species
Marenzellaria in the Baltic Sea Benthic invertebrate abundance and distribution
L5B Temporal trend of invasive species Invasive species Phytoplankton community analysis
in the Northern and Middle Adriatic
Phytoplankton community composition
L5B Show temporal patterns in species and species groups, and interpret in terms of seasonality and long-term trend
Eutrophication
Pollution https://doi. org/10. 14284/377 https://doi. org/10. 14284/376
Temporal trend of algal toxicity
along the French coast Phytoplankton community composition
L5B Show spatio-temporal distribution of toxic algae
along French coast Eutrophication Pollution Long term zooplankton time series
analysis from Villefranche, Western Mediterranean
Zooplankton biomass
and diversity L5B Show temporal patterns in species and species groups, and interpret in terms of seasonality and long-term trend
Eutrophication,
Pollution https://doi. org/10. 14284/379
incomplete and biased spatial coverage of the marine domain, modelling species distributions may be one way to improve the spatial distribution data. The ‘neural network modelling of Baltic zooplankton abundances’
data product is an example of such modelling approach, where the incomplete spatial coverage of zooplankton monitoring stations within the Baltic basin has been completed, using environmental information on such variables as salinity (probably the most important variable), oxygen content and others. The modelled distributions compare favourably with the observations, and moreover the temporal variation in subsequent years is usually very limited, demonstrating the robust-ness of the approach. This approach may form the basis for consistent space-covering indicators to be used in evaluating cumulative effects.
5.4. Species thermal tolerance & sensitivity to changes
Of particular importance for marine policy is the uncertainty in ecological background conditions created by global change. Whereas it is already challenging to predict the outcome of many different local or regional human pressures on the ecosystem, these effects might in addition be modulated by increases in temperature or acidification ef-fects. Considerable uncertainty exists on the sensitivity of ecosystems to these global changes. The ‘thermal affinities for European marine spe-cies’ data product concentrates on these uncertainties. It uses the present
and past spatial distribution of thousands of marine species to determine their optimal temperature and temperature sensitivity. These sensitiv-ities compare favourably with experimentally obtained results for a subset of species. It can subsequently be used to map the sensitivity of species assemblages to temperature increase. The results demonstrate
Fig. 2. Overview of data in EUROBIS containing information on benthic macrobenthic community composition. From all records within the polygon, only species known to be benthic were retained. Datasets focussing on plankton, fish, epibenthos or meiobenthos were subsequently removed, as were museum collections containing only a single specimen per sampling event. Sampling events were defined as all species records sharing date and location. These events were gridded in grid cells of 0.1 degree longitude by 0.05 degree latitude, which is order(5 km) in both directions. A. Number of sampling events per grid cell. B. Distribution of number of cells over the classes of sampling frequency. C. Diversity, expressed as the average number of species per sampling event in each of the sampled grid cells. D. Date of the most recent sample per grid cell, showing a clear west-east gradient in how up-to-date the information is.
that this sensitivity is not homogeneously distributed in space, with certain zones being much more likely affected than others. In contrast to the recent study by Burrows et al. [47]; the approach does not estimate realized trends in species’ thermal affinity, as this requires consistent
long time series and therefore limits the number of available data sets. Rather, it estimates the community’s sensitiveness to such trends, which
is a complementary approach with a broader taxonomic and methodo-logical coverage.
5.5. Products to support invasive species management
Despite the inevitable incompleteness of the accumulated scientific information in the EurOBIS database, the product on ‘invasive marine species occurring in European marine harbours’ demonstrates that even
limited datasets can be extremely useful in assessing policy decisions based on false negatives. This product illustrates a workflow to check a procedure proposed for a number of European harbours. By sampling the harbours for invasive species, the procedure proposed to determine which harbour pairs host all invasive species and could therefore be pre- empted from extensive checks on invasive species in ballast waters. Our workflow compares the currently used harbours database with known species occurrences in EurOBIS, and demonstrates the incompleteness of the restricted new datasets. It shows that collection of additional data can add, in a few cases, to new records of occurrence, but is generally flawed with respect to recording the absence of species in particular areas, e.g. because not all seasons or habitats have been sampled.
Precautionary policies with respect to species invasions are fraught with difficulties, because it is not always clear what species to look for, and what transport mechanisms to consider. Retrospective analysis of successful invasions can inform future-oriented policies, if sufficient data are available to document the course of the invasion. A product demonstrating such invasion was prepared on the ‘temporal trend of invasive species Marenzellaria in the Baltic Sea’. Similar products cannot
be made for many other species due to insufficient data, although the coverage by monitoring stations in certain areas may allow the work-flow to be expanded to other examples.
5.6. Planktonic time series
Long-term time series, especially of phytoplankton variables, were emphasized by the stakeholders as very important information for the evaluation of policies aimed at addressing eutrophication and pollution. Several long-term monitoring stations for phytoplankton routinely collect data across Europe, but only few of these are available in the public domain. An EMODnet Biology data product using two of these series, one 30-years long and a shorter 13-year long series illustrates the ‘phytoplankton community analysis in the Northern and Middle Adri-atic’. The series can be examined by species, but furthermore a
multi-variate analysis shows the major seasonal trends and comparison over long time scales. In addition to the evaluation of eutrophication policies in the larger region, the second, shorter, series is also useful in the context of the evaluation of consequences of aquaculture in the near- shore region. The comparison of several of these time series would allow to better separate regional from local effects. The product of ‘temporal trend of algal toxicity along the French coast’ also
concen-trates on phytoplankton, focussing on Harmful Algal Blooms as the most prominent eutrophication indicator, and adds a spatial component to the analysis. This spatial component is also prominent in the maps of ‘gridded copepod abundance’, showing spatio-temporal series of
zooplankton in the North-West Atlantic. It is based on the 60-year time series of the Continuous Plankton Recorder, and provides input to ICES0
regular evaluation of the state of the ecosystem in this large sea region.
5.7. Do the data products meet the marine policy requirements?
Compared to the demands formulated by the Regional Checkpoints
and the stakeholders, the example products developed to date fulfil a number of requirements, while still missing some of the more prominent demands.
The most obvious gaps concern the population estimates of emblematic species (such as marine mammals and birds) over large spatial scales but also covering in some detail certain project areas. While data on mammals and birds are systematically collected, e.g. in the North Sea region, only older data are publicly available and are often incomplete in the EMODnet databases. Collection and analysis of these population estimates are a concerted action involving specialists and many volunteers. The results are held and curated by these groups themselves. Inclusion into the European Atlas of Marine Life will require co-operation projects to be set up, but cannot be fully covered within the scope of EMODnet Biology.
In general, we observe an inverse relation between the availability of data in the public domain, and the demand for this information from management authorities. There are exceptions, and notably the infor-mation gathered by public authorities themselves are usually freely available, but scientists or volunteer groups having heavily invested in data collection, act against their own interest when making the data available too early. This is also the reason why it is difficult to compose a comprehensive overview of phytoplankton time series across Europe. While the existence of many datasets is documented by the EMODnet metadata, availability is in many cases restricted.
The products developed now do, however, address many of the other demands from policy. Information on past and present condition of the ecosystem has been shown to contribute to data needs in the fields of fisheries policy (both with respect to fish stocks and effects of fisheries on the rest of the ecosystem), eutrophication control, conservation ef-forts and selection of marine protected areas, control of invasive species, marine spatial planning, evaluation of the effect of global change.
The heterogeneity in data products proposed in terms of typology, temporal and spatial coverage reflects the large heterogeneity in marine biological data, covering several levels of the trophic web and several degrees of taxonomic as well as functional precision (eg. from species level to functional traits). Nevertheless, this effort represents the first initiative, at European level, to propose a shared and harmonized approach to represent spatial and/or temporal variability of biological EOVs in the European seas, using several data sources and sampling programmes. By combining data from several programmes, these products particularly address the need of wider areas - covering infor-mation that is essential for maritime spatial planning and for the assessment of regional policies. These products represent examples that can be applied also to other areas, where data availability allows, and can be further implemented and adapted upon user needs. The demonstrated biological data products provide valuable information for environmental management, biodiversity conservation, maritime spatial planning, as well as for scientific research and for the improve-ment of marine policies.
6. Improvements to data and products
At the same time, the development of these prototype products has highlighted the inherent limitations of data products that depend on the random process of data collection in the marine environment by a wide variety of uncoordinated bodies, each pursuing disparate goals. The most fundamental limitation is the irreversibility of time. One can never know the true value of a variable in the past unless you have measured it in the past. This is problematic in combination with the ever-changing nature of marine policy priorities. In addition the external (climatic) conditions in the ocean are changing, as is the human use of the ocean and the political focus on particular aspects of the ocean ecosystem. The implication of these changes is that today’s priority questions differ from
those of the past, and most probably also those of the future. Monitoring programmes that are tightly focussed to only address the challenges of today (with all other questions being regarded as lower priority) will
undoubtedly lead to a shortage of useable data in the future. However, budget and time constraints prohibit the measurement of all variables, in all places and at all times. Defining monitoring programmes in terms that are generic enough to withstand future changes in policy questions, while remaining feasible from a budgetary point of view, is a major challenge. Overviews of where it failed in the past, in terms of e.g. un-biased spatial coverage but also type of variables measured, and where it was successful, should inform decisions on how to better allocate the resources for monitoring. Thus, the large uncertainty in gridded prod-ucts in certain areas can inspire improvements or reallocations of efforts and resources in the future.
Preparing the products has also revealed other weaknesses in the present practice of data collection and curation. Large effort has been spent in many data series to remove the artefacts caused by the ‘market model’ for the organisation of monitoring. Agencies executing
moni-toring change on average every four to five years, with enormous con-sequences for changes in taxonomy and how species are recorded, data formats and other details that can render long time series close to useless for product development. It is questionable whether this problem can be solved with better protocols, or that a replacement of the market model is required. In comparison, long term data collected by research in-stitutes usually show more consistency in the approach to taxonomy, but suffer from other disruptions. Scientists have an endless desire to adopt to the most modern technology, and to swiftly concentrate all their effort on the latest scientific questions. As a result, it is rare to find scientific time series without methodological shifts. Reconstructing the time series of zooplankton from Villefranche demanded an overview of who had been working on what thesis in what year, in order to know what species had been looked for in what series of samples. The usability of the time series as a whole has suffered much under these switches, despite the large efforts invested in it. More detailed and comprehensive metadata and provenance information would go some way to mitigating these short-comings.
A concern expressed by one of the Regional Checkpoints was that the same dataset, curated by different organisations, was found to have inconsistent versions. There appears to be an inverse relation between the number of curators of a dataset and its quality and consistency. We observed that the quality of the average dataset was far insufficient to be used ‘as is’. All datasets needed extensive checks and corrections in
taxonomy, methodological details, and to account for changes in approach etc. This is a common situation for whoever tries to make single datasets useable, let alone compile overarching datasets based on different sources. No two curators will do this in the same way, and if too many people are involved in the preparation of data products, parallel and inconsistent results may appear, diminishing utility and raising concerns of trust in the product. This problem is larger when the basic quality of the underlying dataset is poorer. Setting high standards for the collection and reporting of the basic monitoring data is therefore called for, in order to reduce the impact of this problem in the future. In addition the openness of the workflows applied to dataset can avoid many problems, as they will at least show which corrections have been applied and why.
7. Stakeholder evaluation and enhancement
At the current stage, the European Atlas of Marine Life has been launched with a set of data products that can help to address the key issues, summarised in Section 5, that were highlighted by the stake-holders. However, the full utility of these products still has to be evaluated.
This evaluation will be achieved, as during other stages of data product development within EMODnet Biology, through focussed and targeted stakeholder engagement. Each of the nascent data products will be presented as case-studies alongside relevant examples of the issues they address from a diverse range of stakeholders. We then discuss the product limitations and scope for further enhancement within focussed
breakout groups to capture feedback and potential refinements that can be integrated into the next product iteration, as illustrated in Fig. 1.
A number of these iterations have already taken place within the context of EMODnet Biology, but also with wider communities including recent European Maritime Day and European Ocean Observing System events.
In the next phase of EMODnet Biology there will be opportunity to expand and further develop the prototype products in addition to the development of guidance and training in their implementation. The products provide a demonstration of what can be achieved with quality assured, open marine biological data, and should empower the creation of sector and use-case specific products across the marine domain.
The proposed principals for data products to support Essential Biodiversity Variables [48], the “Bari Manifesto”, lays out ten desirable
outcomes to improve interoperability and FAIRness of biological data products. The application of these principles to the EMODnet Biology data products provides an indication of their level of maturity and in steering the direction of future product development.
The underlying data infrastructure supporting the EMODnet Biology products provided by EurOBIS, clearly meets many of the principles relating to data quality, structure, metadata, services and preservation. For the products defined within the European Atlas of Marine Life, many have well described workflows and are as open and FAIR as possible. However further work is required to implement transparent, standards- based provenance information alongside the products. Such information provides any data product users with the necessary information to reproduce the product development, using new or updated raw data. Guidance for the creation of future EMODnet Biology data products will include recommendations to ensure such guiding principles are considered.
We hope that a critical evaluation of the present EMODnet Biology data products can also contribute to the discussion, at national and European levels, on how to improve the entire chain of data collection, curation and interpretation for evaluation of marine policies.
8. Summary/conclusions
The development of scientifically robust and user-friendly data products is key to communicating with, and engaging the broadest range of stakeholders, in order to inform, educate and improve the capacity to respond to the challenges facing the marine environment. Such products have, for a long time, been developed in isolation, or with limited end- user engagement, especially when resulting from time-limited projects or initiatives.
The EMODnet Biology community has demonstrated the benefits and limitations of utilising existing resources to inform and steer such product development in an engaged and interactive manner. Such an approach increases the utility and value of the original data as well as resulting products, facilitates information sharing within a broader community and ensures the highest degree of interoperability. If global integration is to be achieved, and support for the EOV approach ne-cessitates this, then such engagement models need to be expanded and resourced to facilitate effective management of the world’s seas and
oceans.
Funding
This work was supported by the European Union under Regulation (EU) No 508/2014 of the European Parliament and of the Council of May 15, 2014 on the European Maritime and Fisheries Fund.
Declaration of competing interest