Performance Evaluation of Masonry
Buildings Using a Probabilistic Approach
A. Bakhshi
and K. Karimi
1In many countries, there are traditional houses made of stone, adobe and brick, which perform relatively weakly in earthquakes. To mitigate casualties in future earthquakes, it is necessary to evaluate the current status of these buildings and propose eective methods to retrot them. One method of evaluating the performance of buildings in earthquakes is through the use of fragility curves. These diagrams show the probability of exceeding a specic state of damage versus seismic intensity parameters, such as P GA, MMI, Ia, CAV etc. Fragility curves will provide an important basis for analytical methods, based on probabilistic approaches. Much work has been done on bridges, concrete and steel structures, while limited studies have been conducted on masonry buildings. Considering the prevalence of these buildings and the high seismic activity in some regions where they are built, fragility curves for dierent types of masonry buildings are developed in this research. The results obtained show the probable damage to those types of masonry building chosen in this research for dierent earthquake intensities and restates that, by providing horizontal and vertical ties and retrotting these buildings, by the methods proposed in some seismic code provisions (such as FEMA 356 and 357), their behavior in earthquakes are apparently eected and structural damage reduced. Furthermore, results indicate that soil type does not signicantly inuence the seismic behavior of masonry buildings.
INTRODUCTION
Each year earthquakes occur in several countries, killing many people and causing extreme loss. It is obvious that unreinforced masonry buildings are among the most vulnerable structures in earthquakes.
These buildings are traditionally made of low-strength materials, such as brick or adobe, without any structural system to resist earthquakes. Therefore, evaluating the seismic performance of these buildings and proposing some eective methods to rehabilitate them against earthquakes is an essential step toward hazard mitigation and risk assessment.
Developing fragility curves for a specic type of building is a probabilistic method to estimate the probability that the building will exceed a specic state of damage for a denite value of the seismic intensity parameter. This parameter can be taken as P GA, MMI, Ia, CAV and so on. Usually, P GA (Peak
*. Corresponding Author, Department of Civil Engineering, Sharif University of Technology, P.O. Box 11155-9313, Tehran, Iran. E-mail: [email protected]
1. Department of Civil Engineering, Sharif University of Technology, Tehran, Iran.
Ground Acceleration) is used as the seismic intensity parameter in developing fragility curves, but, in this paper, CAV (Cumulative Absolute Velocity) has been chosen for this purpose, since it is found to be well associated with structural damage [1].
Fragility Curves are categorized into two types: Empirical and Analytical. Empirical fragility curves are developed using real damage data, obtained from previously occurred earthquakes, while analytical fragility curves are constructed, based on nonlinear dynamic analysis. Much work has been done on developing fragility curves for some types of structure, such as bridges [2,3], reinforced concrete structures [4-6] and tall buildings [7]. However, not sucient eort has been made toward developing fragility curves for masonry buildings, especially the unreinforced ones, which are very common in several countries and which are much more vulnerable to earthquake than many other types of building.
In this paper, analytical fragility curves are de-veloped for masonry buildings, before and after using seismic provisions and retrotting. Uncertainty is considered in some structural parameters, including the compressive and tensile strength of the brick laying unit, the compressive strength of the concrete and
the tensile strength of the reinforcing bars. For developing each fragility curve, 15 dierent models are made, based on the values for uncertain structural parameters, which are resulted from the Monte Carlo Simulation method [8]. These models are analyzed under various earthquake records using the IDARC 4.0 nonlinear analysis program [9]. Twelve earth-quake records are used in this study; half of which are recorded on rock and the rest of which on soil sites. Hence, separate fragility curves are obtained for dierent site conditions. Also, two types of masonry building are considered, based on the number of stories that is, one and three-stories. Seismic damage cost and the eect of dierent parameters, such as number of stories, site condition, horizontal and vertical ties and reinforcing bars, on the seismic performance of masonry buildings is further investigated, using the obtained fragility curves. Finally, the results obtained in this research are veried through comparison with some other works done in this area.
SELECTION OF EARTHQUAKE RECORDS As noted earlier, 12 Earthquake records are used in this paper. They are selected, such that each site provides sucient records for both rock and soil sites. The near fault eect is also considered in choosing some of these records. The records used in this research are shown in Table 1, with their corresponding seismic parame-ters, including CAV (Cumulative Absolute Velocity), arms (root mean square of accelerations), Ia (Arias intensity), Ic (characteristic intensity), C:F: (Central Frequency), S:F: (Shape Factor), M:P:A: (Median Peak Acceleration) and TDominant (dominant period). These parameters are dened and discussed in another paper by the authors [1].
CAV , which is used frequently in this paper as the seismic intensity parameter in developing fragility curves, is well recognized as follows:
CAV = T Z 0
ja(t)dtj; (1)
where a(t) is the ground acceleration time history and T is the duration of the earthquake. Since most of the design engineers are more familiar with P GA than CAV , the relation between these two parameters for the selected records is shown in Figure 1.
DAMAGE STATES AND DAMAGE INDICES
When buildings are subjected to earthquakes, various states of damage occur. In this paper, ve damage states are considered:
Figure 1. Correlation between P GA and CAV for the selected earthquake records.
1. Nonstructural damage, 2. Slight structural damage, 3. Moderate structural damage, 4. Severe structural damage, 5. Collapse.
These damage states are dened, using the damage index proposed by Park and Ang [10,11].
The Park and Ang damage index for a structural element is dened as follows [11]:
DIP A= m y
u y +
e Myu
Z
dE; (2)
where:
m = Maximum curvature caused by an earthquake,
y = Yield curvature,
u = Ultimate deformation under monotonic loading,
R
dE = Cumulative dissipated energy, My = Yield moment,
e = Coecient related to structural types. The building damage index will, further, be ob-tained on the basis of its individual element damage indices. The range and best-estimate values of the building damage index, DT , corresponding to various states of damage, are shown in Table 2.
FRAGILITY CURVES AND DAMAGE PROBABILITY MATRIX
The probability P Fij, that the damage exceeds the ith damage state, given the occurrence of an earthquake with CAV equal to vj, can be determined as follows:
P Fij = prob(DT DTijCAV = vj)
Table 1. Earthquake records on rock and soil sites, used in this paper. Records on Rock
Earthquake Kocaeli Tabas Loma Prieta Kobe Northridge Friuli Date 17/8/1999 16/9/1978 18/10/1989 16/1/1995 17/1/1994 6/5/1976 Station Izmit Tabas Gilroy#1 KJMA Tarzana Tolmezzo Component 090 LN 000 000 090 000 PGA (m/s/s) 2.154 8.199 4.031 8.057 17.456 3.443 PGV (m/s) 0.298 0.978 0.316 0.813 1.136 0.220 PGD (m) 0.171 0.369 0.064 0.177 0.332 0.041 Soil Type Rock Deep Rock Shallow Shallow Shallow (Geomatrix) (narrow) soil (sti) soil (sti) soil (sti) soil T(total) (s) 30.000 32.860 39.950 48.000 40.000 36.345
T(Page-Bolt) (s) 24.005 27.220 13.250 21.400 27.320 7.415
TTrifunac (s) 13.242 16.487 6.530 8.351 10.538 4.245
CAV (m/s) 7.678 30.529 6.596 20.913 36.294 5.571 arms (m/s/s) 0.460 1.627 0.705 1.565 2.280 0.811
Ia (m/s) 0.813 11.543 1.055 8.391 22.748 0.780
Ic (m1:5/S2:5) 1.528 10.832 2.156 9.055 17.999 1.988
C.F. (Hz) 3.823 5.207 6.969 2.343 5.623 4.130 S.F. 0.604 0.599 0.612 0.507 0.643 0.547 M.P.A. (m/s/s) 1.521 5.602 2.325 4.905 7.396 2.419 TDominant(s) 0.868 0.489 0.492 0.898 0.408 0.401
Records on Soil
Earthquake Bam Loma Prieta Kobe Northridge Mammoth Lakes
Imperial Valley Date 26/12/2003 18/10/1989 16/1/1995 17/1/1994 25/5/1980 15/10/1979 Station Bam Gilroy#2 Takatori Sylmar 54099
Convict Creek
5028 El Centro Array #7
Component L 000 000 360 180 140
PGA (m/s/s) 7.783 3.603 5.998 8.273 4.33602 3.31578 PGV (m/s) 1.235 0.329 1.271 1.296 0.231 0.476 PGD (m) 0.343 0.072 0.358 0.327 0.054 0.247 Soil Type
(Geomatrix) Soil
Deep (broad) soil
Soft (deep) soil
Deep (broad) soil
Deep (broad) soil
Deep (broad) soil T(total) (s) 66.560 39.950 40.960 40.000 29.955 36.820
T(Page-Bolt) (s) 39.225 12.760 31.750 12.740 14.350 8.035
TTrifunac (s ) 8.004 10.978 11.343 5.317 9.345 6.825
CAV (m/s) 22.225 8.170 26.000 14.156 12.116 6.394 arms (m/s/s) 1.125 0.765 1.308 1.568 1.067 0.817
Ia (m/s) 7.946 1.197 8.697 5.012 2.619 0.858
Ic (m1:5/S2:5) 7.471 2.392 8.428 7.005 4.179 2.093
C.F. (Hz) 6.175 3.391 2.128 3.022 8.360 2.889 S.F. 0.604 0.581 0.720 0.623 0.529 0.739 M.P.A. (m/s/s) 4.061 2.325 4.228 4.768 3.642 2.360 TDominant(s) 0.997 0.756 1.331 0.984 0.335 0.902
Table 2. Damage states based on Park & Ang damage index.
Damage State DT Range Best
Estimate 1 Nonstructural damage 0.01-0.10 0.05 2 Slight structural damage 0.10-0.20 0.15 3 Moderate structural damage 0.20 - 0.50 0.35 4 Severe structural damage 0.50 - 0.85 0.67 5 Collapse 0.85 - 1.15 1.00
where:
DTi= Damage index corresponding to the ith damage state,
FDT(:) = Probability distribution function of DT . Considering log-normal distribution for DT , P Fij would be calculated as follows:
P Fij = 1 ln(DIi) ln(DI) ln(DI)
CAV = vj !
; (4) where:
()= Normal distribution function,
ln(DI)= Mean natural logarithm of damage index, ln(DI)= Standard deviation of logarithm of damage
index.
The fragility curve, with respect to the ith dam-age state, can be constructed using P Fij values at various CAV levels.
The damage probability matrix shows the prob-ability that the damage occurred will be located in a specic damage state. The probability P DSij, which shows that the damage to a structure caused by an earthquake with CAV equal to vj is in the ith damage state, can be derived from the fragility data as follows:
P DSij = (
P Fij P Fi+1j (i 4)
P Fij (i = 5) (5)
The damage index can be related to earthquake loss through using a damage cost function. In this way, the Annual Earthquake Loss (AEL) of a structure is determined.
PROPERTIES OF THE MATERIALS
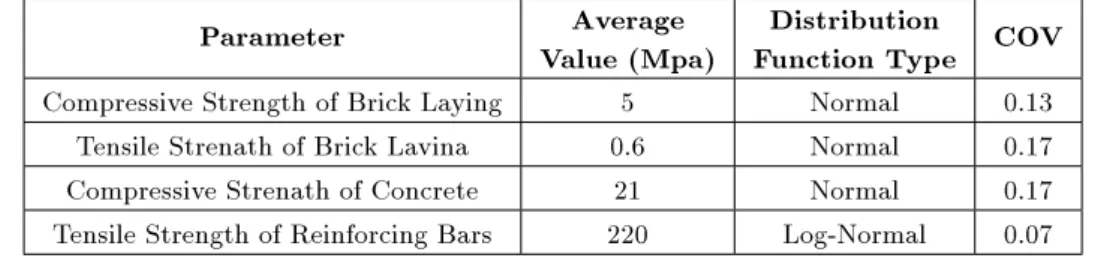
Several laboratory experiments have been done on the behavior of masonry in various regions around the world [12]. To consider uncertainty in structural pa-rameters, rst, a probabilistic distribution is assigned to each of them [10]. Then, by using the Monte Carlo Simulation method [8], 15 dierent values have been generated for each structural parameter, based on its distribution function. These parameters, with their assigned average value, type of distribution function and coecient of variation, are shown in Table 3. The average compressive and tensile strength of traditional brick laying in Iran are considered to be 5 and 0.6 MPa, respectively [13].
NUMERICAL MODELING OF THE BUILDINGS
The nonlinear analysis program, IDARC 4.0 [9], is used to model the buildings and calculate the damage indices. Reinforced concrete buildings, steel buildings and masonry inll panels can be modeled using this program. But, the models for masonry buildings can-not be generated directly using IDARC. By comparing brick and concrete, it can be recognized that both have similar properties. Although there is a long gap between their compressive strength, they both behave much stronger in compression, so, their tensile strength is almost abandoned. Consequently, in this paper, an unreinforced masonry panel is modeled as a concrete shear wall without any reinforcement. The assumed stress-strain curves for masonry and concrete in IDARC are shown in Figure 2.
The behavior of brick can be simulated by using a concrete stress-strain model, through considering equivalent values for corresponding parameters in their stress-strain diagrams. These parameters include: Compressive and tensile strength, strain corresponding to compressive strength, ultimate strain and the slopes of the initial and descending sections of the diagram (Figure 2).
The structural elements used to model masonry buildings in this research include beams, shear walls and edge columns, as presented in Figure 3, with their assigned degrees of freedom.
Table 3. Material properties with their average value, type of distribution function and coecient of variation. Parameter Average
Value (Mpa)
Distribution
Function Type COV Compressive Strength of Brick Laying 5 Normal 0.13
Tensile Strenath of Brick Lavina 0.6 Normal 0.17 Compressive Strenath of Concrete 21 Normal 0.17 Tensile Strength of Reinforcing Bars 220 Log-Normal 0.07
Figure 2. Stress-strain curve for masonry and concrete in IDARC program.
Figure 3. Structural elements used in modeling masonry buildings (IDARC 4.0 [9]).
As stated earlier, in this paper, masonry walls have been modeled as shear wall elements, substituting concrete properties with those of masonry. Verticals ties are modeled as edge columns, since they behave as axial members, keeping the integrity of the building in a vertical direction, and horizontal ties are modeled as beam elements.
Flexural, shear and axial deformations are
consid-ered in the modeling of shear wall elements in IDARC 4.0 [9]. Flexural and shear deformations are modeled using one of the four dierent hysteretic models: a) Three parameter Park model,
b) Three parameter steel model, c) Bilinear model,
d) Linear-elastic model.
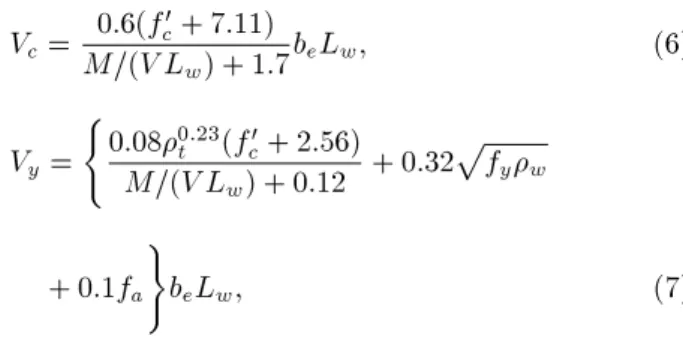
These dierent hysteretic models, with their corre-sponding parameters, are discussed fully in the IDARC manual. The axial deformation component is modeled as a linear-elastic spring and the cracking and shear strengths, Vcand Vy, are determined from the following empirical relations:
Vc = 0:6(f 0
c+ 7:11)
M=(V Lw) + 1:7beLw; (6)
Vy = (
0:080:23
t (fc0+ 2:56) M=(V Lw) + 0:12 + 0:32
p fyw
+ 0:1fa )
beLw; (7)
where M(V Lw) is the shear span ratio; tis the tension steel ratio in percent; wis the wall reinforcement ratio; fa is the axial stress; beis the equivalent web thickness and Lw is the distance between the edge columns.
Five dierent types of building are modeled in this study: One and three-story URM (Un-Reinforced Masonry), with and without ties, and a one-story reinforced masonry building. To obtain fragility curves for each type of building, 450 nonlinear analyses are performed, based on various models, earthquake records and the CAV values used in generating these curves.
Each building is considered 5 m 5 m in plan and each story is 3 m high. The thickness of the masonry walls is assumed to be 0.3 m. The plan and elevation of these buildings are shown in Figure 4. If horizontal or vertical ties are provided, they are used, according to the Iranian Seismic Code [14]. Each tie is 0:3 0:3 m in section, including four 12 reinforcing bars and 6 stirrups with 0.2 m spacing. For retrotting the masonry walls, reinforcing bars are distributed horizontally and vertically in the walls in addition to ties. After designing the masonry walls to resist seismic loading, the required percentage of horizontal and vertical reinforcement in each wall was turned into 0.3%. To satisfy these requirements of
Figure 4. Plan and elevations of masonry buildings considered in study.
reinforcement, 2412 are used horizontally and 4012 vertically in each wall.
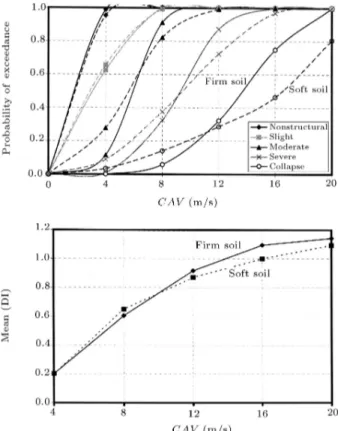
NONLINEAR ANALYSIS RESULTS AND CORRESPONDING FRAGILITY CURVES In Figure 5, fragility curves and corresponding damage matrices are presented for each type of masonry build-ing mentioned before. These diagrams are obtained separately on hard rock and soil sites, in order to de-termine the eects of soil type on the seismic behavior of these buildings.
EARTHQUAKE LOSS
In this paper, the cost of damage to a building resulted from an earthquake is considered to be the direct cost of repairing that building and does not include the cost due to loss of building functions after the earthquake. CDRi, the central damage cost ratio, is dened as the ratio of the mean repair cost of a building in the ith damage state to the replacement cost of that building [10].
In this paper, CDR values, proposed in FEMA 1985, are used to estimate earthquake loss to dierent types of masonry building, as previously discussed (Table 4).
The damage cost ration, DRj, due to an earth-quake with CAV = vj can be calculated as follows:
DRj= 5 X i=1
P DSij CDRi: (8)
Then, the damage cost, DCj, given the occurrence of an earthquake with CAV = vj, would be determined as follows:
DCj = DRj (replacement cost of building): (9) Assuming the occurrence of an earthquake, the ex-pected annual earthquake loss, AEL, of the building is calculated as follows:
AEL= Na
X j=1
DCj:
Fv
vj+v2
Fv
vj v2
; (10)
Table 4. Damage cost ratios corresponding to various damage states (FEMA 1985).
Damage State Damage Cost Ratio Range (%)
Central Damage Cost Ratio (%) 0 No damage 0 - 0.05 0 1 Minor
nonstructural 0.05 - 1.25 0.3 2 Slight 1.25 -7.5 3.5 3 Moderate 7.5 - 20 10 4 Severe 20 - 90 65 5 Collapse 90 - 100 95
Figure 5. Fragility curves and corresponding damage probability matrices for each type of masonry building on hard rock and soil.
Figure 5. Fragility curves and corresponding damage probability matrices for each type of masonry building on hard rock and soil (continued).
Figure 5. Fragility curves and corresponding damage probability matrices for each type of masonry building on hard rock and soil (continued).
where, Fv() is the probability distribution function of CAV in one year.
The calculated values of the mean damage cost ratio for the ve types of masonry building considered in this research are presented in Table 5, corresponding to dierent values of CAV . As seen in this table, by providing vertical and horizontal ties and by rein-forcing masonry buildings, earthquake loss signicantly reduces.
COMPARISON AND SENSITIVITY
ANALYSIS OF THE FRAGILITY CURVES In this section, fragility curves and mean damage indices are compared, in order to show the inuence of some parameters on the seismic behavior of masonry buildings. These parameters include: Number of
stories, soil type, vertical and horizontal ties and reinforcing bars.
In Figure 6, it is observed that the structural damage increases with an increase in the number of stories, from one to three, and the dierence becomes more signicant in severe states of damage.
As seen in Figure 7, for low values of CAV , the nonlinear eect of the soil becomes dominant and increases damage indices. But, as CAV increases, the structural damage on the rock becomes predom-inant. This seems to be consistent, because of the fact that the dominant period of rocky ground is more comparable to the natural period of a one-story masonry building than that of ground made of soil. Totally, however, there is no signicant dierence between the fragility curves and damage indices of one-story masonry buildings on rock and soil, since the
Table 5. Calculated values of mean damage cost ratio for masonry buildings considered in this study. Mean Damage Cost Ratio (%) for Masonry Buildings Located on Rock
CAV (m/s) 1S-UR-W/O(a) 1S-UR-W(b) 3S-UR-W/O(c) 3S-UR-W(d) 1S-R(e)
4 3.6 1.8 2.7 0.8 0.0
8 29.1 9.9 50.6 4.0 0.0
12 67.7 38.0 89.9 24.1 6.9
16 87.5 66.8 95.0 54.4 15.0
20 95.0 82.2 95.0 90.6 26.5
Mean Damage Cost Ratio (%) for Masonry Buildings Located on Soil
CAV (m/s) 1S-UR-W/O 1S-UR-W 3S-UR-W/O 3S-UR-W 1S-R
4 10.0 6.8 6.4 1.2 0.0
8 33.8 14.5 62.4 16.7 0.0
12 58.4 38.6 84.3 48.7 5.4
16 77.4 54.7 95.0 79.1 20.0
20 89.2 73.2 95.0 87.5 27.0
(a): 1Story UnReinforced WithOut; (b): 1Story UnReinforced With ties; (c): 3Story UnReinforced WithOut ties; (d): 3Story UnReinforced With ties; (e): 1Story Reinforced.
Figure 6. The eect of number of stories on fragility curves and mean damage index values in unreinforced masonry buildings without ties on rock.
Figure 7. The eect soil type on fragility curves and mean damage index values in one-story unreinforced masonry building without ties.
Figure 8. The eect of using ties on fragility curves and mean damage index values in one-story unreinforced masonry buildings on rock.
nonlinear eect of soil would not greatly inuence short buildings.
In Figure 8, the signicant dierence between fragility curves in severe states of damage for one-story masonry buildings, before and after using ties, shows the eectiveness of horizontal and vertical ties, in reducing structural damage in masonry buildings. It is seen that the dierence almost increases with CAV . As shown in Figure 9, retrotting masonry walls with horizontal and vertical reinforcements substan-tially decreases the structural damage to masonry buildings. This inuence is so signicant that even the fragility curve for the nonstructural state of damage after retrotting is far below the one for the collapse state of damage before retrotting.
A CORRESPONDENCE BETWEEN FRAGILITY CURVES AND PUSHOVER DIAGRAM
The pushover diagram of a structure is the result of a nonlinear static analysis under an increasingly monotonic force. Any point on the pushover diagram of a structure can be related to the corresponding point on the fragility curves of that structure, as shown in Figure 10.
Figure 9. The eect of reinforcement on fragility curves and mean damage index values in one-story masonry buildings on rock.
Figure 10. A correspondence between fragility curves and pushover diagram of a structure.
base shear, which is related to peak ground acceleration as follows [14]:
F = ABIR W; (11)
where:
A = Peak ground acceleration (g), B = Structure response coecient, I = Importance factor,
R = Structure behavior factor, W = Structure weight,
For masonry buildings, R = 4, I = 1 and B = 2:5
(period < 0:4 s). Hence, Equation 9 becomes:
F = A 2:5 1:04 W ) A = 1:6WF : (12) Then, CAV can be estimated, based on the resulted peak ground acceleration using Figure 1. The obtained value for CAV corresponds to the dierent probabil-ities of exceedance in each state of damage on the fragility curves (point (p; v)) in Figure 10.
The damage index can be evaluated from the pushover diagram of a structure, using each of the following equations [11]:
DI= m y
u y; (13)
F DR = kk0
f
km k0
kf k0; (14)
where:
m = Maximum displacement due to an increasingly monotonic load, y = Yield displacement,
u = Failure displacement months after the publication date of the paper.
k0, km, kf are initial, maximum and failure stiness, respectively, as dened in Figure 11.
The state of damage to the structure is deter-mined, based on the obtained damage index from the pushover diagram. The probability of exceeding this damage state, corresponding to the value of CAV previously obtained, can be estimated from the fragility curves of the structure and it should result in a rea-sonable value, since this state of damage has actually occurred.
COMPARISON WITH OTHER STUDIES A comparison is done between the fragility curves obtained in this study and the resulted fragility curves
Figure 11. Denition of y, m, u, k0, km, kuon the
for 1-story unreinforced masonry buildings in Memphis city, under simulated ground motion, in a report by Abrams and Shinozuka, although the method of devel-oping the fragility curves in this study is completely dierent from the one used in their studies [6]. The dimensions of the 1-story masonry building presented in their study are shown in Figure 12.
In Figure 13, the corresponding fragility curves for this building are shown, in comparison with the ones obtained in this research, for 1-story unreinforced masonry buildings located on hard rock. It should be noticed that these buildings are dierent, according to dimensions, openings, soil type and some other pa-rameters. Also, the seismic intensity parameter diers in the two diagrams and a general comparison would be appropriate. As seen in Figure 13, for moderate earthquakes, with CAV = 8 m/s (or, equivalently, P GA = 0:4 g (refer to Figure 1)), the probability of a slight damage state occurring (equivalent to cracking in the fragility curves by Abrams and Shinozuka) for these type of buildings is 100%, as in Figure 13a and 90%, as in Figure 13b. This probability becomes 30% for a severe damage state, as in Figure 13a. and 20%, as in Figure 13b, while the probability of collapse is negligible in both diagrams.
CONCLUSIONS
Fragility curves provide a powerful tool for anticipating the damage to structures in future probable earth-quakes. Also, the eect of dierent parameters on the seismic behavior of these structures can be investigated through using fragility curves.
Figure 12. Elevations of the 1-story unreinforced masonry building in the study by Abrams and Shinozuka [6]; (a) Door wall; (b) Window wall.
Figure 13. Comparison of fragility curves obtained (a) in this study and (b) by Abrams and Shinozuka [6], for 1-story unreinforced masonry building without ties.
For the most probable earthquakes, which are the ones with moderate intensity (0.2 g < P GA < 0:5 g, equivalent to 5 m/s < CAV < 12 m/s, (refer to Figure 1)), following results could be recognized: 1. In one-story unreinforced masonry buildings
with-out ties, nonstructural and slight damage denitely occur and moderate damage is, therefore, probable. The probability of occurring severe damage is, approximately, 35% and the probability of collapse is less than 20%;
2. In one-story unreinforced masonry buildings with ties, nonstructural and slight damage will certainly occur. The probability of occurring moderate damage is almost 60% and the probability of more severe damage and collapse is insignicant;
3. In three-story unreinforced masonry buildings with-out ties, nonstructural, slight and moderate damage states are completely possible. The probability of occurring severe damage is more than 60% and the probability of collapse is between 30% and 45%; 4. In three-story unreinforced masonry buildings with
ties, nonstructural and slight damage states are very probable. The probability of occurring moder-ate damage is between 10% and 45% and the prob-ability of severe damage and collapse is negligible; 5. In one-story reinforced masonry buildings, the
probability of each state of damage occurring is negligible.
In addition, soil type does not have a signicant eect on the fragility curves of masonry buildings, especially in less destructive states of damage and especially for short buildings (one-story).
The obtained results in this study verify that the minimum requirements incorporated in the seismic provisions of modern codes, in order to improve the performance of URM buildings in earthquakes, are really eective.
Based on the relation found between fragility curves and the pushover diagram of a structure, analyt-ical fragility curves can be updated, using the pushover diagram of the structure, which is resulted from either a nonlinear static analysis or an experiment.
REFERENCES
1. Bakhshi, A., Tavallali, H. and Karimi, K. \Evaluation of structural damage using simplied methods", Jour-nal of European Earthquake Engineering, 3, pp 61-68 (2007)
2. Shinozuka, M. et al. \Statistical analysis of fragility curves", Journal of Engineering Mechanics, 126(12), pp 1224-1231 (2001).
3. Mackie, K. and Stojadinovic, B. \Fragility curves for reinforced concrete highway overpass bridges", Pro-ceedings of the 13th World Conference on Earthquake Engineering, Vancouver, B.C., Canada (2004). 4. Dumova-Jovanoska, E. \Fragility curves for reinforced
concrete structures in Skopje (Macedonia) region", Journal of Soil Dynamics and Earthquake Engineering, 19, pp 455-466 (2000).
5. Singhal, A. and Kiremidjian, A.S. \A method for earthquake motion-damage relationship with applica-tion to reinforced concrete frames", Technical Report NCEER-97-0008, State University of New York at Bualo, USA (1997).
6. Abrams, D.P. and Shinozuka, M. \Loss assessment of Memphis buildings", Technical Report NCEER-97-0018, State University of New York at Bualo, USA (1997).
7. Tantala, M.W. and Deodatis, G. \Development of seismic fragility curves for tall buildings", Proceedings of the 15th ASCE Engineering Mechanics Conference, New York, USA (2002).
8. Rubinstein, R.Y., Simulation and The Monte Carlo Method, John Wiley & Sons, New York, NY (1989). 9. Reinhorn, A., Valles, R.E. et al. \IDARC 2D version
4, a program for inelastic damage analysis of RC structures", State University of New York at Bualo, USA (1995).
10. Hwang, H.H.M. and Huo, J-R. \State generation of hazard-consistent fragility curves for seismic loss estimation studies", Technical Report NCEER- 94-0015, State University of New York at Bualo, USA (1994).
11. Williams, M.S. and Sexsmith, R.G. \Seismic damage indices for concrete structures: A state-of-the-art review", Earthquake Spectra, 11(2), pp 319-349 (1995). 12. Mayes, R.L. and Clough, R.W. \State of the art in seismic shear strength of masonry: an evaluation and review", Report EERC 75-21, University of California, Berkeley, California, USA (1975).
13. Moghaddam, H., Seismic Design of Masonry Build-ings, Sharif University of Technology Publications, Tehran, I.R. Iran (1994).
14. Building & Housing Research Center, Iranian Code of Practice for Seismic Resistant Design of Buildings, Standard No. 2800, 2nd Ed. (1999).