ISSN: 2252-8938, DOI: 10.11591/ijai.v7.i1.pp1-10 1
Performance Analysis of ANN Model for Estimation of Trophic
Status Index of Lakes
Tushar Anthwal1, Akanksha Chandola2, M P Thapliyal3
1Department of Computer Science, Bhagwant University, India
2Uttarakhand State Council for Science and Technology, Dehradun, India
3Department of Computer Science, HNB Garhwal (Central) University, Srinagar Garhwal, India
Article Info ABSTRACT
Article history: Received Nov 10, 2017 Revised Jan 7, 2018 Accepted Feb 9, 2018
The health of water bodies across the globe is of high concern as the pollution is accelerating rigorously. With the interventions of simple technology, some significant changes could be bought up. Lakes are dying because of high Trophic Index Status which shows the eutrophication level of water bodies. Taking this into account, feed forward back propagation neural network model is used to estimate the Trophic Status Index (TSI) of lakes which could compute the value of TSI with the given parameters; pH, temperature, dissolved oxygen, Secchi disk transparency, chlorophyll and total phosphate. Two learning algorithms; Levenberg Marquardt (LM) and Broyden–Fletcher– Goldfarb–Shanno (BFGS) Quasi Newton were used to train the network, which belongs to different classes. The results were analyzed using mean square error function and further checked for the deviation from actual data. Among both the training algorithm; LM demonstrated better performance with 0.0007 average mean square error for best validation performance and BFGS Quasi Newton shows the average mean square error of 1.07.
Keyword:
Artificial neural network Eutrophication
Feed forward back propagation Trophic Status Index
Water quality
Copyright © 2018 Institute of Advanced Engineering and Science. All rights reserved. Corresponding Author:
Tushar Anthwal,
Department of Computer Applications, Bhagwant University, Ajmer, India Email: [email protected]
1. INTRODUCTION
Water bodies all across the world are facing many challenges and getting deteriorated day by day and some of the reasons were pollution, encroachment, illegal construction, water quality issues, water supply management, global warming and much more. It is an urgent need to have a real time monitoring system on water bodies. Recently the Nainital lake of Kumaun Region of Uttarakhand was in news for its drastic diminution in water level which is again an alarming note. These water bodies require a continuous monitoring system that would alarm on any disastrous situation or forecast over their health with lesser manual efforts and use current computing techniques.
With the scientific and statistical intervention, these problems could be addressed and artificial neural network makes it possible to develop such monitoring systems that could predict the conditions of these water bodies. In this research work, the sample data on physiochemical properties of lakes were collected all across the globe and these data were analyzed to identify the level of eutrophication on them. Artificial Neural Network of type Feed Forward Network model was developed with back propagation learning algorithm to train the network with physiochemical parameters (like; temperature, pH, alkalinity, Dissolved Oxygen (DO), Secchi disk transparency, chlorophyll and phosphate). Trophic Index Status (TSI) of the lake is further computed using the neural network and level of eutrophication of water body is predicted.
The entire research work is compiled into following sections; where section II briefs about water quality assessment i.e. basic concepts of lake water eutrophication problem, explains the role of TSI values in
the estimation of lake health and how the ANN could serve the purpose of classification of water bodies on basis of above-mentioned physiochemical properties. Section III; covers the state-of-the-art in this field where types of ANN were used in water quality assessments at different levels. Section IV; covers the methodology on development of the ANN; starting off with data collection on physiochemical properties of water bodies. It also includes the detail specifications of Neural Network model training functions, adapted learning function, number of layers, neurons, and performance function. Section V; gives a detailed performance analysis of developed neural network and comparative results on LM and BFGS Quasi-Newton learning algorithms outcomes. The last section VI; conclude on the outcomes and also threw light on the future scope of research.
2. WATER QUALITY ASSESSMENT
Water quality assessment is the main problem that we had addressed in this research work. Water plays a vital role in the life of all living beings. Humans being, flora, fauna, vertebrate, invertebrate; either one influences the water quality or being influenced by it or both. In this high pace of transition and evolution, water bodies need to be evaluated in frequent gaps. This is because of the high intervention of human contributing to pollution, adverse effects of climate change, miss management of resources etc. This section defines about the problem around which whole of our research revolves around and briefs about Eutrophication and concept on its computing technique i.e. TSI and also brief about the potential of ANNin problem-solving by intelligent means.
2.1. Eutrophication of Lakes
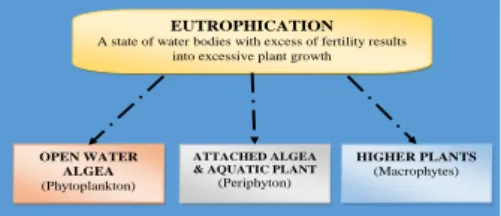
Eutrophication of lake is an emerging problem which fallout to high pollution content, increase in nutrient content of lake water that results into deterioration of water quality. This increase in nutrient content results into algal blooming that reduces the amount of dissolved oxygen in the water body. In this process water bodies get augmented with nutrients thus increasing in the production of entrenched aquatic plants and algae. With eutrophication the following types of vegetation starts growing inside the surface of the water bodies, which is depicted in the Figure 1, given below;
Figure 1. Type of Plant Growth in Eutrophication
According to the report on Nainital lake (Singh & Brij, 2002), it is mentioned that about few factors like; open sewers disposing of large quantities sewage is causing deleterious effect on the water quality. However, that activities had been checked from last one decade, but still the deterioration of lake is not yet stopped. Other anthropogenic activities such as illegal constructions, littering, domestic discharge of waste, and recreational activities on water bodies had now became major elements for triggering the eutrophication of lakes (Sharma, 2014).
As given in the paper (Anthwal & Pandey, 2017), the statistical data predicts that in the next decade, the percentage of lakes with oligotrophic status would decrease by approximate 3%-0.5% and eutrophication increases by 5%-55% (Anthwal & Pandey, 2017). By the year 2008, about 60% of lakes in China were in eutrophic and hypertrophic condition and further predicted that by 2030 all urban lakes would share the same status.
2.2. Trophic Status Index (TSI)
Different types of methods have been adopted for lake water classification with main aim for accessing the water quality. Amongst all most common and widely used method is Trophic State Index formulated by Carlson (Carlson, 1977), which is based on identifying the biomass in the lake water using three parameters; Secchi Disk Transparency (measure of transparency or turbidity), Chlorophyll-a content (measure of algal biomass) and Total Phosphate (indicates the nutrient in direct supply for algal growth). TSI is very powerful technique to identify the actual status of water bodies, where three major components play vital role, chlorophyll content, Secchi Disk transparency mainly a measure of turbidity in water and phosphate.
HIGHER PLANTS
(Macrophytes) ATTACHED ALGEA
& AQUATIC PLANT (Periphyton)
OPEN WATER ALGEA
(Phytoplankton)
EUTROPHICATION
A state of water bodies with excess of fertility results into excessive plant growth
This process of estimation of TSI is data based system and requires minimum sets of data for computation of algal biomass and further provide a single quantitative indexing for classifying and ranking process of water bodies. The range of the index is from approximately 0 – 100 and is based on the relationship among three physiochemical properties Secchi Disk Transparency, Chlorophyll-a, Total Phosphate of water body. The Table 1 given below summarizes the relation of the TSI values in association with the factors impacting water quality and overall health of water body.
Table 1. Brief description over TSI value and Water quality
TSI (Carlson 1977) Trophic Status Index and Water Quality Parameters
<40 Oligotrophic; clear water; sufficient amount of dissolved oxygen throughout year 40-50 Mesotrophic; Moderate clear water; supportive for swimming and other water activities
50-70 Eutrophic; lower classic eutrophic with decrease in transparency, macrophyte problem evident.Upper range with dominance of blue-green algal scums and extensive macrophyte problem
>70 Hypereutrophic; heavy algal blooms throughout summer and dense macrophyte beds
Above 80 TSI value; algal scums, summer fish kills, few macrophytes and dominance of rough fish
The three parameters i.e. Secchi Disk Transparency, Chlorophyll-a, Total Phosphate along with temperature, pH, dissolved oxygen were obtained and these variables are integrated by the linear regression model, resulting in the classification of the water body. Chlorophyll-a is given highest priority for classification because this variable is the most accurate parameter for computation of TSI because of its direct indication and prediction capability on the algal biomass content.
The formulas for calculating the TSI (Trophic State Index) are stated as follows; 1. TSI (Trophic State Index) for Chlorophyll a (CHL)
TSI (CHL) = 9.81 In Chlorophyll a (µg/l-1) + 30.6 (1)
2.
TSI (Trophic State Index) forSecchi Disk Transparency (SDT)
TSI (SDT) = 60-14.41 In Secchi Disk Transparency (meters) (2)
3. TSI (Trophic State Index) for Total Phosphate (TP)
TSI (TP) = 14.42 In Total Phosphate (µg/l) + 4.15 (3)
TSI (Avg) = (TSI (CHL) + TSI (SDT) + TSI (TP))/3 (4)
where, TSI is Carlson Trophic State Index and In is natural logarithm. 2.3. Role of Artificial Neural Network in Water Quality
In these conditions, it is quite important to continuously monitor the health of the lakes. In such cases, new computing techniques and tools could be highly useful and by means of these tools, an overall prediction and early warning on the health of the water body is possible. ANN in past and present scenario proved to be an appropriate tool for deterministic modeling of system behavior. However, if processed with wrong data there is a high chance for failure on its classification and prediction capability. Therefore data analysis results purely depend on the correctness and amount of data used to train the network.
In this work, the physiochemical parameters; Secchi disk transparency (SDT), pH value, dissolved oxygen, temperature, phosphate and chlorophyll (Chl-a) were collected and overall analysis of the condition of the lake is prepared with the main focus on the TSI value. TSI is calculated from above-given data on physiochemical parameters and status of the lake is being produced. The lake status was modeled using Artificial Neural Network with above-mentioned indices as input tools and on basis of these parameters the lake trophic condition was generated. These models are of high importance in the prediction of lake water status for different season and also time series analysis for forecasting the conditions in and after several years.
3. STATE OF THE ART
3.1. Water Quality Analysis Systems
Water quality analysis was always been at prime focus for any civilization to survive, as proved with historical and scientific evidences. Analysis of the water body is of crucial importance, not just in terms of its
water purity but the overall health of water resource matters. As the demand for water is rising drastically, by and large, its management is becoming very important and so its quality.
A general model outlined in (Twigt, Rego, Tyrrell, & Troost,2011) proposed a framework of water quality forecasting system having key components like; real-time data acquisition module, data management module, forecasting model, processing unit, and result dissemination unit. The application of generic forecasting system the Delft-FEWS was implemented for bathing water quality and harmful algae blooms forecasting. This type of systems serves as building block for the development of applications that would facilitate towards early alarming and health monitoring of water resources. With continuous research there had been some integrated system for water quality assessment however, there lacks a single integrated system that could be deployed to any random water body and find out the accuracy of quality parameters. Thus as the water pollution is increasing day after day, a suitable integrated system needs to be developed with the features on data acquisition, assessment, processing, and forecasting of water quality. Currently with this research work, we aim at developing an ANN model which is trained with the data across the globe and is able to assess the water parameters with much diversification.
While focusing on only eutrophication management and control of water body, there are various ways like; chemical monitoring, bio-assessment and estimation techniques as published by (“Planning and
Management,”2017), however, could show some variations in results due to the factors on spatial data, imagery
data correction, classification and other techniques used for computation (Anthwal & Pandey, 2017). There comes another category of water quality assessment systems which aims to identify the type of pollutions, source of pollutions, suspended particulate matter, water shed management or overall health etc. (Wahaab & Badawy 2004, Neamtu et al., 2009, Carreón-Palau et al., 2017, Bastidas et al., 2017).
Alferes, Tik, Copp, & Vanrolleghem, (2013)put emphasis on the continuous monitoring system for water bodies where in situ data should be regularly evaluated and validated for effective interpretation. Thereby proposed software tools for review over water quality data using principal component analysis, statistical metric and developed algorithm illustrated with automated monitoring systems were mounted in at the inlet of wastewater treatment plant in an urban river.
Another work presented by Chang, Bai, & Chen, (2017)also mentioned about the need for water quality monitoring and developed an integrated multi-sensor remote sensing data modeling system with image processing algorithms in collaboration with machine learning resulting into an automated water quality monitoring system. This system was termed as "cross-mission data merging and image reconstruction with machine learning" (CDMIM), and tested by predicting the water quality mainly nutrients, chlorophyll-a and Secchi disk transparency of Lake Nicaragua, providing an efficient tool for lake watershed management.
In this digital era, computers are equipped with endless possibilities and in (Xiao-kai, Zheng-ya, Qi-li, & Da-quan, 2010), authors proposed an information system for monitoring pollution content in water bodies that offers data analysis and prediction features for scientific decision making. The data sets are collected from laboratories and water body quality is diagnosed, however, due to the limitation of these processes, the system could be restrained from delivering high-quality end results.
3.2. Neural Network Models for Water Quality Assessment
Limited water quality data, in situ traditional ways on water quality analysis, the costly water quality monitoring and accuracy over physiochemical parameters recorded etc. all these factors often pose serious problems for process-based modeling approaches to modulate the monitoring system of water bodies for time series forecast. However, in due course of time, artificial intelligence techniques say; knowledge-based system, genetic algorithm, artificial neural network, and fuzzy inference system proved to provide better end results over in situ computations and also showed the innovative way towards better and efficient monitoring system for water quality modeling (Chau, 2009). Among SVM and ANN, later provide reasonable implementation options, because they are computationally very fast and require many fewer inputs parameter and inputs conditions than deterministic models.
Salami, Salari, Ehteshami, Bidokhti and Ghadimi (2016) showed the application of ANN and mathematical modeling to predict water quality of river from the southwest region of Iran and taking into account five indicators (DO, TDS, SAR, BOD5, HCO3) and associate them with parameters EC, temperature and pH. The feed forward model was adopted and results show superior accuracy over the traditional water quality measuring methods. In a similar work, Seo,Yun and Choi (2016)studied the water quality parameters; Temperature, DO, pH, EC, TN, TP, Turbidity, and Chlorophyll-a, from downstream of Cheongpyeong Dam and predicted the values using ANN which shows satisfactory results.
In another study, Kanda, Kipkorir and Kosgei (2016) measured the ability of multilayer perceptron based neural network to predict dissolved oxygen while taking in account temperature, turbidity, pH and electric conductivity as the input variable. The results were analyzed using root mean square error values for the
training data from River Nzoia and correlation among the input and output variables were developed thus showing the computing power of the neural network.
Liu and Lu, (2014) implemented SVM for water quality forecasting in an agricultural nonpoint source polluted river by estimation over total nitrogen and total phosphate content and compared it with ANN results, where later technique delivered superior outcomes. On the other hand, to behave cognitively ANN does require a large pool of representative data sets for training and appropriate learning algorithms. In another experiment by Sattari, Joudi and Kusiak (2016), electrical conductivity (EC) and total dissolved solids (TDS) was estimated using k-nearest neighbors (k-NN) algorithm and support vector regression model in order to identify water quality of Lighvan Chay River and found to deliver accurate predictions over the two values.
Haykin (1991), described a neural network as a processor with parallel- distributing architecture having accepted ability of efficient computing, processing, forecasting, and clustering, and have the advantages of nonlinearity, input-output mapping, adaptively, generalization and fault tolerance. ANN constitutes intelligent bionic models and the nonlinear, large-scale, adaptive dynamics systems which consist of many interconnected neurons (Xiao-kai et al., 2010). ANN models have been widely applied to the water quality analysis using Hopfield neural network (HNN) model (Xiao-kai et al., 2010); back propagation multi-layer perceptron (MLP) (Heydari, Olyaie, Mohebzadeh, & Kisi, 2013); adaptive neuro fuzzy inference system (ANFIS) (Thair, Hameed, & Ayad, 2014) and Multivariate Linear Regression (Chu, Lu, & Zhang 2013).
With the main aim on the conservation of water resources, an application based on Hopfield neural network method and factor analysis technique was introduced and outcome showed that biochemical oxygen demand, lead, zinc, mercury, ammonium nitrate and permanganate index are very crucial water quality indicators (Chu et al., 2013). With HNN, the classification was done on basis of above-mentioned parameters, water samples were categorized and reasonable results were produced. Heydari et al. (2013) presented ANN model with back propagation multi-layer perceptron with configuration 4-5-1 and 4-6-1 where 5 and 6 are neurons in hidden layer, working on two input variables dissolved oxygen and specific conductance, for Delaware River, Pennsylvania U.S. the performance was evaluated with statistical criteria i.e. correlation coefficient, root mean square and mean absolute error, thereby sowing the potential of trained ANN model for water quality measurements.
Another water quality monitoring and assessment system for Euphrates River was proposed by Thair et al. (2014). This ANN model aims to prediction and forecasting total dissolved solid (TDS) with multiple regression (MLR) model and finds out to be more convenient to conventional statistical techniques. A water quality analysis system proposed by Soltani, Kerachian and Shirangi (2010) was based on genetic algorithm simulated on physio-chemical parameters using MLR, RBFN, and ANFIS, with the aim to identify eutrophication of reservoirs. With the inspiration, Chen and Liu (2015) in their study compared two artificial neural network model i.e. RBNF and ANFIS, and MLR model. In the computation DO, TP, Chl-a, and SD values were measured and ANFIS model found to be superior to others. Similar efforts are done by Areerachakul and Sanguansintukul (2009) where a multilayer perception (MLP) neural network using the Levenberg Marquardt (LM) algorithm executed to classify water quality of canals in Bangkok and found to possess 99.34% accuracy with lesser cost and more efficiency.
In our research work, we are also computing on physiochemical properties of reservoirs mainly lakes, to develop a neural network model for identification of eutrophication status of water bodies. We had considered the data across the globe to develop a generic model which could cover up a broader range of properties. Mainly Chl-a, SDT, and TP were taken into account to compute the TSI value, however, other parameters like pH, DO, electrical conductivity and temperature was also included while training of network because all these factors also have a direct contribution towards algal blooming of reservoirs. The TSI values over numerous data available from various sources were collected, auto-corrected, cleaned and ANN model based on feed forward back propagation trained with LM and BFGS Quasi-Newton algorithm were developed to compute and predict the eutrophication level of water bodies.
4. MATERIAL AND METHODS
4.1. Data Collection and Analysis
Data plays an important role in the training of Neural Network and the accuracy of the predictive values also directly relies on the accuracy of former. For our research work the data on physical and chemical field profiling parameters of lake were assimilated from various sources across the globe; water on web portal
(http://www.waterontheweb.org/data/index.html), European Environment Agency
(https://www.eea.europa.eu/data-and-maps/data/waterbase-lakes-6), National Institute of Hydrology, Roorkee, India (http://www.nihroorkee.gov.in/) and several publications with status on eutrophication of Indian lakes.
These data include; temperature, dissolved oxygen level, pH value, electrical conductivity, Secchi disk transparency, total phosphate and chlorophyll-a content. The parameter taken into account were of high significance like; Temperature in ⁰C tells about the water temperature, pH value of water imply acidic or
alkalinity, amount of dissolved oxygen in water which is most important factor for defining the quality of water, Secchi disk transparency which is measured assess the clarity of water body, chlorophyll-a that is measure of algae in the water, total phosphate which depicts the nutrient that are food for biological organisms living in water and have direct impact on quality of water and electrical conductivity which is related to the dissolved elements in an aqueous solution.
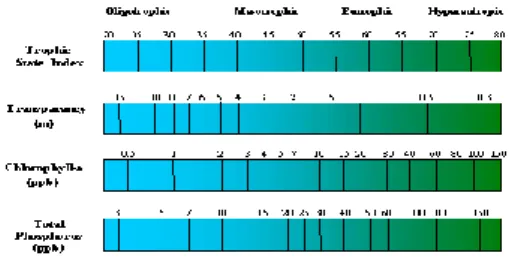
Around 4000 datasets were collected and TSI value of each dataset was computed and Feed Forward Neural Network model with Levenberg-Marquardt and BFGS Quasi Newton Back Propagation learning algorithms were opted. Neural network system was set up and trained with datasets and tested data was simulated to analyze the performance of the network regarding both the learning algorithms. The evolution of a lake from oligotrophic to eutrophic could be computed through measurement of total phosphate (TP), SDT, and chlorophyll a (Chl-a). Figure 2 shows the range of TSI values and attributes that classifies water bodies into oligotrophic, mesotrophic, eutrophic, and hypereutrophic.
Figure 2. Graphical representation of TSI, Transparency, Chlorophyll-a and Total Phosphate values and associated eutrophication level (http://www.lakeaccess.org/lakedata/datainfotsi.html)
4.2. Neural Network Modelling
Artificial Neural Network modeling is a very crucial process where network type, training function, learning algorithm, number of layers and neurons, and performance evaluation function have to decide on and whole learning of system is based on all these above factors. For the network type, the feed-forward back propagation neural network is preferred because of its simple architecture and easy computation method, for large scale data feed forward back propagation deliver better results.
4.2.1. Feed forward neural network with back propagation
A feed-forward neural network is the simplest network that simulates the functionality of the biological neural system in the human body and comprises of large number of neuron i.e. processing units or nodes arranged in layers. Every unit in a layer is connected with all the units in the previous layer and all connections may bear same or different weights. The weights on these connections actually are used to compute and interpret the training of network thus predetermining the knowledge of a network. The entry of data is done through the inputs, which further passes from layer to layer through the network and finally arrives at the outputs. As there does not exist any feedback between layers, it results into non-cyclic network known as the feed-forward neural network.
Figure 3. Feed Forward Neural Network with Back Propagation
Because of its simplicity, back propagation algorithm is preferred and is based on gradient descent techniques. It possesses the capability to minimize the mean squared error by finding a local minimum of the error function. The initialization of the network is done by random weight w, whose function serves as the output of each neuron in the output layer. For each iteration, the gradient of the error function is computed recursively and accordingly weight assigned to the layers is corrected. The equation for minimum error E is shown by the following equation;
∇𝐸 = ( 𝜕𝐸
𝜕𝑤1, 𝜕𝐸 𝜕𝑤2, … … ,
𝜕𝐸
Every time weight w in back propagation is updated using the equation;
𝑤(𝑡 + 1) = 𝑤(𝑡) + ∇𝑤(𝑡) (6)
∆𝑤𝑖 = − 𝛾 𝜕𝐸
𝜕𝑤𝑖 for 𝑖 = 1,2, … , n (7)
where 𝛾 represents a learning constant, i.e., a proportionality parameter which defines the step length of each iteration in the negative gradient direction.
Two training functions; Levenberg-Marquardt and BFGS Quasi-Newton were selected as both belong to the different class of optimization. Levenberg-Marquardt is most widely used optimization algorithm and is based on gradient descent and Gauss-Newton iteration, whereas BFGS belongs to the family of hill climbing optimization technique and Quasi Newton is a method to find the root of the first derivative. Likewise, both of these function defines mean square error variable as a performance analysis parameter which makes our work straight forward to correlate and compare both the functions.
1. Backpropagation with LM algorithm
According to Hagan and Menhaj (1994), back propagation algorithm when combined with the Levenberg Marquardt training function, improved over the training time and imparted momentum to it. And according to Zhou and Si (1998), they proved that LM also enhances the performance of back propagation algorithm thus providing superior results and training accuracy.
2. Backpropagation with BFGS quasi-newton algorithm
BFGS is also apt for solving large nonlinear optimization and suited for the problem with a large number of variables (Fletcher, 1987).
4.3. Simulation and Output
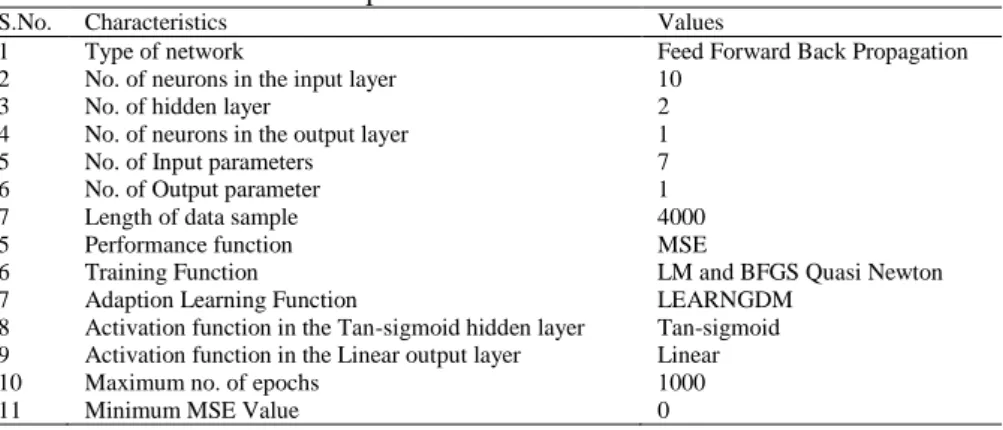
The secondary data is collected across various sources is cleaned and about 4000 samples were finalized to train, test and validate the network. Simulation is carried out with Matlab Neural Network Toolbox and results were further analyzed. Specifications of the neural network to compute the TSI values out from seven input parameters are provided in the Table 2.
Table 2. Specification of Neural Network
S.No. Characteristics Values
1 Type of network Feed Forward Back Propagation
2 No. of neurons in the input layer 10
3 No. of hidden layer 2
4 No. of neurons in the output layer 1
5 No. of Input parameters 7
6 No. of Output parameter 1
7 Length of data sample 4000
5 Performance function MSE
6 Training Function LM and BFGS Quasi Newton
7 Adaption Learning Function LEARNGDM
8 Activation function in the Tan-sigmoid hidden layer Tan-sigmoid 9 Activation function in the Linear output layer Linear
10 Maximum no. of epochs 1000
11 Minimum MSE Value 0
Amongst 4000 set of data is used 75% of data is used to train the network, 15 % as testing set and remaining 10% for validate of the network. In order to update the weight in the network and make the system to learn, training data set performs. The validation set estimate the performance of the network and test data set computes the overall performance of the network. Adaptation learning function that corresponds to the momentum variant of Back Propagation i.e. LEARNGDM, the gradient descent with momentum weight and bias learning function which returns the weight change and a new learning state.
5. PERFORMANCE ANALYSIS OF NEURAL NETWORK
Several phases of training were performed on the neural network with above mentioned characteristics. The results of the network performance on basis of best validation performance and lowest gradient and highest regression results were recorded. To evaluate the performance of the network, the comparative analysis of the results of feed forward back propagation neural network with BFGS Quasi
Newton and Levenberg-Marquardt were recorded. In the overall analysis, the later was found to display more accurate and efficient outputs over the former algorithm. The detail results were shown in the Table 3.
Table 3. Performance Analysis of Feed Forward Back Propagation Neural Network Model based on BFGS Quasi Newton and Levenberg-Marquardt training algorithm.
To get the performance of the neural network, error vector is automatically computed. These error vectors denote for how many times and up to what extent the network was unable to predict the correct target value and up to what extend the error was. The overall neural network means square error was also recorded which the factor for measurement of error was made by computation model throughout the learning phases.
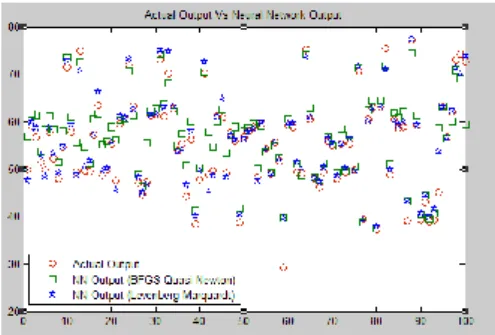
The performances of both the learning functions were further analyzed by giving the same set of data as input to both the network and computing the outcome on TSI value. The predicted output from both the network was evaluated against the actual values of TSI. As it could be interpreted from Figure 4, the output generated from LM training algorithms was mostly found to be nearer to the actual TSI value.
Error i.e. deviation from the actual TSI value and generated output from the networks were
also plotted to depict a better picture of the results. And as the Figure 5 and 6 goes, the outcome from
BFGD Quasi Newton learning algorithm displays the larger number of displacements and lesser
accuracy over the actual data. However, LM algorithm shows a lesser number of fluctuation and even
up to a lesser extent, which shows its accuracy and overall efficiency over its counterpart.
Figure 4. Assessment on output generated by Neural Network for both training algorithm BFGS Quasi Newton and Levenberg-Marquardt
Figure 5. Error plot for Neural Network trained with BFGD Quasi Newton learning algorithm
Figure 6. Error plot for Neural Network trained with Levenberg-Marquardt learning algorithm
EPOCH Gradient Best Validation Performance (Mean Square
Error)
Training Validation Test All
144 3.53 1.297 0.51512 0.98383 0.99199 0.7287 10 0.86 0.9076 0.99066 0.99162 0.98945 0.99057 7 2.26 1.1043 0.99033 0.99126 0.99093 0.99057 6 0.918 0.989 0.99082 0.99177 0.98855 0.99068 258 0.561 0.00146 0.99999 1 0.99973 0.99994 6 0.759 0.0007 0.99992 0.99997 0.99999 0.99994 6 0.251 0.0004 0.99999 0.99999 0.9997 0.99994 6 1.351 0.0005 0.99992 0.99997 0.99999 0.99994 Feed Forward Back
propagation 2-10-1 Model
Levenberg-Marquardt LEARNGDM
Mean Square Error BFGS Quasi Newton LEARNGDM Mean Square Error
Regression Network Type Learning Function Adaptation
Learning Function
Performance Function
6. DISCUSSION AND CONCLUSION
The main aim of this research work was to formulate feed forward back propagation neural network for computing eutrophication level of water bodies. Different physicochemical parameters of water bodies were collected and ANN was trained with the data using two learning algorithms; LM and BFGD Quasi Newton. Among the two learning approaches, LM proved to be efficient as the mean square error was very less. Also while calibrating the deviation from actual data, the BFGD Quasi Newton showed much higher values and uneven distribution, thus displaying the inferior output for TSI values for the given set of data. Feed-forward back propagation neural network with Levenberg-Marquardt learning algorithm will be further used to compute the status of lakes on basis of physicochemical variables and predict the eutrophication level. For the future study, the ANN would be used to compute the eutrophication level of a regional water body with the help of spatial data. With the imagery data of selected lake, mainly chlorophyll-a, SDT and total phosphate (one or more variable) would be computed and using neural network the actual trophic status index of the lake would be assessed. The imagery data of selected water reservoir would be used to compute the SDT and Chlorophyll content at different sites and on different time span. The output from the spatial data would be subjected to analysis using statistical modeling and net outcome would be passed on to the above trained neural network to compute TSI of the water body. The overall efficiency and accuracy of the system would be computed thus giving a vision towards automated analyzer for monitoring water bodies.
ACKNOWLEDGEMENTS
I would like to acknowledge my mentor and fellow researchers for their input in this research work.
REFERENCES
[1] Singh, S., & Brij, G. (2002). Integrated Management of Water Resources of Lake Nainital and its Watershed: An
Environmental Economics Approach. EERC, Indira Gandhi Institute for Developmental Research, Mumbai, India.
[2] Sharma, M. Water Quality Assessment of the Central Himalayan Lake, Nainital. Advances in Environmental
Chemistry, 2014, 1-5. http://dx.doi.org/10.1155/2014/473074.
[3] Anthwal, T., & Pandey, M. (2017). Assessing State of the Art on Artificial Neural Network Paradigms for Level of
Eutrophication Estimation of Water Bodies. IAES International Journal of Artificial Intelligence, 5(4), 135-142.
[4] Twigt, D., Rego, J., Tyrrell, D., & Troost, T. (2011). Water Quality Forecasting Systems: Advanced Warning of
Harmful Events and Dissemination of Public Alerts. In 8th International ISCRAM Conference. Lisbon, Portugal. [5] Planning and Management of Lakes and Reservoirs: An Integrated Approach to Eutrophication. (2017). Unep.or.jp.
[6] Wahaab, R., & Badawy, M. (2004).Water quality assessment of the River Nile system: an overview.Biomedical and
Environmental Sciences, 17(1), 87-100.
[7] Neamtu, M., Ciumasu, I., Costica, N., Costica, M., Bobu, M., Nicoara, M., Catrinescu, C., van, Slooten, K., De, &
Alencastro, L. (2009). Chemical, biological, and ecotoxicological assessment of pesticides and persistent organic
pollutants in the Bahlui River, Romania. Environmental Science and Pollution Research, 16(1), 76-85.
[8] Carreón-Palau, L., Parrish, C., & Pérez-España, H. (2017). Urban sewage lipids in the suspended particulate matter
of a coral reef under river influence in the South West Gulf of Mexico. Water Research, 123, 192-205.
[9] Bastidas, J., Vélez, J., Zambrano, J. & Londoño, A. (2017). Design of water quality monitoring networks with two
information scenarios in tropical Andean basins. Environmental Science and Pollution Research, 1-15.
[10] Alferes, J., Tik, S., Copp, J., & Vanrolleghem, P. (2013). Advanced monitoring of water systems using in situ
measurement stations: data validation and fault detection. Water Science & Technology, 68(5), 1022-30.
[11] Chang, N., Bai, K., & Chen, C. (2017). Integrating multisensor satellite data merging and image reconstruction in
support of machine learning for better water quality management. Journal of Environmental Management, 201,
227-240.
[12] Xiao-kai, W., Zheng-ya, G., Qi-li, Z., & Da-quan,W. (2010). Information System Design of Water Pollution. In
International Conference on Challenges in Environmental Science and Computer Engineering(pp.315-318). Wuhan,
China: IEEE.
[13] Chau, K., (2009). A Review on Integration of Artificial Intelligence into Water Quality Modelling. Marine Pollution
Bulletin, 52 (7), 726-733.
[14] Salami, E., Salari, M., Ehteshami, M., Bidokhti, N., & Ghadimi, H. (2016). Application of artificial neural networks
and mathematical modeling for the prediction of water quality variables (case study: southwest of Iran). Desalination
and Water Treatment, 57(56), 27073-27084.
[15] Seo, I.,Yun, S. & Choi, S. (2016). Forecasting Water Quality Parameters by ANN Model Using Pre-processing
Technique at the Downstream of Cheongpyeong Dam. In 12th International Conference on Hydroinformatics (HIC 2016) - Smart Water for the Future, 154, 1110-1115.
[16] Kanda, E., Kipkorir, E., & Kosgei, J. (2016). Dissolved oxygen modelling using artificial neural network: a case of
River Nzoia, Lake Victoria basin, Kenya. Journal of Water Security, 2, 1-7.
[17] Liu, M., & Lu, J. (2014). Support vector machine―an alternative to artificial neuron network for water quality
forecasting in an agricultural nonpoint source polluted river? Environmental Science and Pollution Research, 21(18),
[18] Sattari, M., Joudi, A., & Kusiak, A. (2016). Estimation of Water Quality Parameters with Data-Driven Model.
Journal - American Water Works Association, 108(4), 232-239.
[19] Haykin, S. (1999). Neural networks: A Comprehensive Foundation. London: Prentice-Hall International.
[20] Heydari, M., Olyaie, E., Mohebzadeh, H., & Kisi, Ö. (2013). Development of a Neural Network Technique for
Prediction of Water Quality Parameters in the Delaware River, Pennsylvania. Middle-East Journal of Scientific
Research, 13 (10), 1367-1376.
[21] Thair, S., Hameed, M., & Ayad, S. (2014). Prediction of water quality of Euphrates River by using artificial neural
network model (spatial and temporal study). International Research Journal of Natural Sciences, 2(3), 25-38.
[22] Chu, H., Lu, W. & Zhang, L. (2013). Application of Artificial Neural Network in Environmental Water Quality
Assessment. Journal of Agricultural Science and Technology, 15, 343-356.
[23] Soltani, F., Kerachian, R., & Shirangi, E. (2010). Developing operating rules for reservoirs considering the water
quality issues: application of ANFIS-based surrogate models. Expert Systems with Applications, 37(9), 6639-6645.
[24] Chen, W., & Liu, W. (2015). Water Quality Modeling in Reservoirs Using Multivariate Linear Regression and Two
Neural Network Models. Advances in Artificial Neural Systems, 15, 1-12.
[25] Areerachakul, S. & Sanguansintukul, S. (2009). Water quality classification using neural networks: Case study of
canals in Bangkok, Thailand. In International Conference for Internet Technology and Secured Transactions, (ICITST), (pp.1-5), London, UK: IEEE.
[26] Hagan, M., & Menhaj, M. (1994). Training feed forward networks with the Marquardt algorithm. IEEE transactions
on Neural Networks, 5(6), 989-993.
[27] Zhou, G., & Si, J. (1998). Advanced neural-network training algorithm with reduced complexity based on Jacobian
deficiency. IEEE Trans Neural Network, 9(3), 448-453.
[28] Byrd, H., Lu, P., Nocedal, J., & Zhu, C. (1995). A Limited Memory Algorithm for Bound Constrained Optimization.
SIAM Journal on Scientific Computing, 16(5), 1190-1208.
[29] Carlson, R. (1977). A trophic state index for lakes. Limnology and Oceanography, 22(2), 361-369.
[30] R. Fletcher (1987), Practical methods of optimization (2nd ed.), New York: John Wiley & Sons, ISBN
978-0-471-91547-8.
BIOGRAPHIES OF AUTHORS
Tushar Anthwal is an Assistant Professor of Computer Applications at Dev Bhoomi Institute of Technology, Dehradun, affiliated to Uttarakhand Technical University. He received his Masters in Computer Application from Hemwati Nandan Garhwal University (A Central University), Srinagar Garhwal. His current research interest includes computer graphics, artificial neural network, geographical information systems, algorithms and logic design. He had about 10 years of experience as faculty including industrial exposure. He had several publications in national and international journals/conferences.
Akanksha Chandola is currently working as Scientist at Uttarakhand State Council for Science and Technology. She is Masters in Computer Application with honors from Birla Institute of Applied Sciences, affiliated to Kumaun University. She had graduation degree in Science from Hemwati Nandan Bahuguna Garhwal University. She had 7 years of working experience as an academician at prime institutes of Uttarakhand. She had the various publications at national and international conferences and journal.She had been a recipient of scholarships from state govt at her post graduation level and govt of India fellowship in Intellectual Property Rights. Her subjects of interest are cloud computing, artificial intelligence, web technology and intellectual property rights (mainly patent and geographical indications).
Dr. M. P. Thapliyal is working as Professor in the Department of Computer Science & Engineering, School of Engineering & Technology, HNB Garhwal University (A Central University), Srinagar (Garhwal) Uttarakhand, India. He has published more than 50 research papers in the International Journals/National journals/Conferences. He has delivered more than 30 talks at national level and chaired many Technical sessions at International/National/Symposium/ Workshop. His major research interests are in the field of Software Engineering, Human-Computer Interaction, E-Learning, educational research and the role of Information and communication technologies for improving teaching and learning process. Dr. Thapliyal had visited China, USA, Itlay, France and Singapore as an expert to present his papers and is Editorial Board Member of various International Journals and Experts of various Indian and Foreign Universities.