Sharif University of Technology
Scientia IranicaTransactions A: Civil Engineering www.scientiairanica.com
Research Note
Evaluation of safety risks in construction using Fuzzy
Failure Mode and Eect Analysis (FFMEA)
A. Ardeshir
a;, M. Mohajeri
aand M. Amiri
ba. Environmental Research Center, Faculty of Civil and Environmental Engineering, Amirkabir University of Technology, Tehran, Iran.
b. Department of Civil Engineering, Payame Noor University (PNU), Tehran, Iran. Received 24 June 2014; received in revised form 4 June 2015; accepted 26 September 2015
KEYWORDS Risk evaluation; Construction safety; Fuzzy logic;
FMEA;
Fault tree analysis; AHP-DEA.
Abstract.The construction industry is one of the most dangerous environments to work in. For this reason, safety-related risk analysis is one of the most signicant tasks that has to be undertaken when managing major construction projects. A combination of fuzzy logic and Failure Mode and Eects Analysis (FMEA), Fault Tree Analysis (FTA), and Analytical Hierarchy Process-Data Envelopment Analysis (AHP-DEA) was applied to improve the process of managing safety risks. Two dierent types of large-scale construction projects were also considered as case studies. It was found that the risk of falling from a height is the most signicant risk in both types of project. Moreover, the factors intensifying the risk of injury in the workers who fall were found to be ignoring safety and lack of personal protective equipment as well as lack of appropriate training for construction workers. It was also concluded that the framework is applicable to all construction sites, covers all safety aspects, and has valid results.
© 2016 Sharif University of Technology. All rights reserved.
1. Introduction
The construction industry is known as one of the most dangerous industries to work in. This is shown in statistics for work-related mortality, injury rates, and worker compensation payments [1]. The con-struction section has a unique dynamic nature [2]; it changes continually, uses many dierent resources, has poor working conditions, and provides no steady employment for the workers. Almost all construction workers in Iran are untrained for safety in tough en-vironments [3]. These features make construction sites exposed to many risks not found in other environments.
*. Corresponding author. Tel./Fax: +98 21 64542648 E-mail addresses: [email protected] (A. Ardeshir); mehdi [email protected] (M. Mohajeri);
[email protected] (M. Amiri)
The aim of risk management is to identify the sources of risk and uncertainties, to determine their inuence, and to develop an appropriate manage-ment tool to respond to risk items [4]. For the risk management processes, a range of methods have been suggested by dierent researchers. Risk manage-ment involves a number of approaches, including risk identication, risk assessment, response to risk, and risk review and supervision [5]. There are numerous techniques to carry out risk analysis in projects.
Among the techniques that were identied to be relevant, fuzzy techniques have been widely applied in construction management. They are useful because of the nature of uncertainty in the concept of risk management.
In the construction industry, many authors have used fuzzy FMEA (e.g., [6-9]). For example, in 2010, Abdelgawad and Fayek suggested a model for risk
management in the construction industry through the integration of FMEA and FAHP [8].
Conducting root cause analysis can also assist managers to nd critical points and prepare proactive risk response strategies to minimize critical root causes. Therefore, Fault Tree Analysis (FTA) was applied in risk assessment. Fuzzy FTA (FFTA), as a more recent method, has been applied in the eld of risk analysis to some extent [10-12].
In this paper, fuzzy sets are combined with both Failure Mode and Eect Analysis (FMEA) and Fault Tree Analysis (FTA) to provide a practical and thor-ough approach for screening of critical safety risk events in the construction industry. A framework designed for integrating risk management in the pursuit of con-tinuous improvement is then developed. Two Iranian case studies are used to evaluate safety risks in large-scale house construction projects and to demonstrate the tool.
2. Theoretical concepts
In the following subsections, theoretical concepts of the methodologies used in this study are explained. 2.1. Use of fuzzy theory in risk assessment Dierent methods are used for risk assessment in construction projects such as FTA and FMEA. More recent risk assessment approaches are mostly based on linguistic assessments rather than numerical ones. During the use of fuzzy logic theory, the data are dened in terms of linguistic variables such as low probability, extreme severity, or high risk. These variables cannot be numerically shown, but fuzzy sets theory may provide a method to manipulate these variables arithmetically [13].
2.1.1. Fuzzy sets theory
The fuzzy sets theory was developed by Professor Lot Zadeh in 1965. The theory is particularly useful when the available data is uncertain or vague [14].
Fuzzy numbers are special cases of fuzzy sets which are both convex and normal. A fuzzy number is characterized by a given interval of real numbers, each with a grade of membership between 0 and 1 [15]. A linguistic variable is a variable whose values are words or sentences in a natural or articial language. Fuzzy numbers can appropriately express linguistic variables [16].
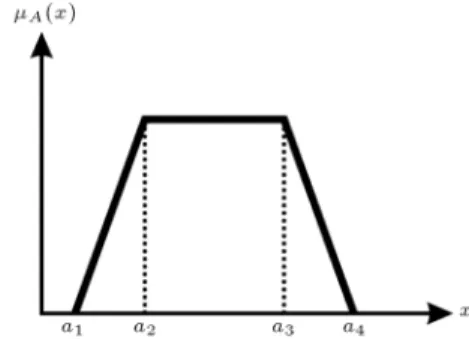
There are many dierent types of fuzzy mem-bership functions such as triangular, trapezoidal, and Gaussian. In the current paper, trapezoidal member-ship functions are used to quantify the subjective and vague uncertainty in the knowledge of an expert [17]. As shown in Figure 1, the trapezoidal fuzzy number of A can be dened as (a1, a2, a3, a4).
Figure 1. Trapezoidal fuzzy number A.
2.1.2. Alpha sections in fuzzy sets
To facilitate numerical computations, it is convenient to express a fuzzy number as a set of upper and lower bounds of a nite number of -cut subsets.
For trapezoidal fuzzy number like (a; b; c; d), Eqs. (1) and (2) are used to calculate the upper and lower bounds, respectively, at each alpha cut level:
Lower bound = (ai+ (bi ai)) ; (1)
Upper bound = (di+ (di ci)) : (2)
If A and B are two fuzzy sets represented over the interval A = [a1 d1], B = [a2 d2], then A+ B,
A B, and A Bare dened as shown in Eqs. (3)
to (5) [18]:
(A+B)= A+ B = [a1+ a2; d1+ d2] ; (3)
(A B)= A B= [a1 d2; d1 a2] ; (4)
(AB)=A B=
min(a1 a2; a1 d2; d1
a2; d1 d2); max
a1 a2; a1; d2; d1
a2; d1 d2
: (5)
2.1.3. Defuzzication
In this research, the method used by Lin and Lee [19] is proposed according to the requirements of reecting the real situation, simplicity, eciency, and the viewpoint of the assessment group:
M = (a + 2(b + c) + d)6 : (6) 2.2. Failure Mode and Eects Analysis
(FMEA)
Failure mode and eects analysis is an engineering tech-nique which is able to dene, identify, and eliminate known and/or potential failures, problems, and errors from systems, designs, or processes. According to the
traditional FMEA method, a degree of criticality of failure mode is determined by calculating Risk Priority Number (RPN). By multiplying the values for Severity (S), Occurrence (O), and Detection/control (D), a Risk Priority Number (RPN) is obtained, which is RPN = S O D [20]. Use of RPN calculated based on non-fuzzy methods has been criticized by a number of authors (e.g. [21-25]).
The conventional FMEA method has main short-comings. Hence, instead of using crisp numbers for measuring S, O, and D, fuzzy numbers will be incorpo-rated. These fuzzy numbers may be linguistic variables based on judgment of the experts or outputs of other techniques.
2.3. Fault Tree Analysis (FTA)
This method was initially developed in Bell's telephone laboratory in 1960-1961 and it was improved for as-sessment of safety risks by the Boeing Company [26]. FTA is a graphical representation of relations which traces a system hazard backwards to nd all its root causes.
Gathering adequate statistical data for accurate evaluation of the rate of failure and/or failure proba-bility is often dicult. To overcome this problem, fuzzy sets theory may be used. Fault tree analysis is used for identication of root causes of risk and the assessment of the probability of a top event occurrence [27]. In this article, -cut concept is used for calculating the probability of a top event occurrence.
The probability of the top event of fault tree based on -cut concept for the gate of \and" as well as for the gate of \or" in the form of a fuzzy number is obtained using Eqs. (7) and (8), respectively [18]:
FProT(top event)=
s
i=1
(ai+ (bi ai))
;
s i=1
(di (di ci))
; (7)
FProT(top event)=
1 n
i=1
1 (ai
+(bi ai))
; 1 n
i=1
1 (di (di ci))
:
(8) 2.4. AHP-DEA
The Analytical Hierarchy Process is a multiple-criteria decision-making method by which the alternatives may be assessed and rates [28]. This method is based on three fundamental principles: decomposition of the structure, comparison of judgments, and hierarchical composition of priorities. AHP is applicable to decision situations involving subjective expert judgments and uses both qualitative and quantitative data. In this
method, a priority index for each expert decision or judgment will be created. These judgments are summarized by ensuring their consistency [29].
In AHP, a matrix is formed as a result of pairwise comparisons and criteria weights are calculated as a result. If n criteria are determined for comparison, AHP performs the following steps to calculate the weights of these criteria:
(a) Create (n n) pairwise comparison matrix A for n objectives, such as:
A = 0 B @
a11 a1n
... ... ... an1 ann
1 C
A ; (9)
where aij indicates how much more important the
ith objective is than the jth objective. For all is and js, it is necessary that aii= 1 and aij = 1=aji;
(b) Divide each value in column j by the total of the values in column j. The total of the values in each column of the new matrix must be one; thus, a normalized pairwise comparison matrix is formed:
Aw=
0 B @ a11 Pa i1 a1n Pa in ... ... ... an1 P ai1 ann P ain 1 C
A : (10)
(c) In AHP, the values of ci; are calculated by nding
the principal eigenvector of the matrix A. Calcu-late ci as the average of the values in row i of the
matrix AW to yield the column vector C where the
value shows the weight of the ith objective, and:
C = 0 B @ c1 ... cn 1 C A = 0 B @ a11 P ai1
n + +
a1n P ain n an1 P ai1
n + +
ann P ain n 1 C A : (11)
(d) Check consistency of the weight values (ci). The
procedure to be followed in order to determine consistency is as follows.
First, calculate the AC matrix (consistency vector):
A C = 0 B @
a11 a1n
... ... ... an1 ann
1 C A 0 B @ c1 ... cn 1 C A = 0 B @ x1 ... xn 1 C A : (12) Second, calculate xi by multiplying A C, which
is a second, better approximation than the eigen-vector. Now, estimate max using the following
formula:
max=n1 n
X
i=1
xi
where max is the eigenvalue of the pairwise
com-parison matrix. Then, determine an approxima-tion to the Consistency Index (CI):
CI = maxn 1n: (14) Finally, to ensure the consistency of the pair-wise comparison matrix, the consistency judgment must be controlled for the appropriate value of n by CR, that is:
CR = CIRI; (15) where RI is the random consistency index.
If CR 0.10, the degree of consistency is satisfactory. If CR > 0.10, there are serious inconsistencies; in this case, the AHP may not yield meaningful results [30].
For N decision-making options, if a paired comparison matrix is used, given a large number of dierent criteria and decision options, a large number of comparisons will need to be carried out by decision-makers. To solve this type of problem, the AHP method with Data Envelopment Anal-ysis (DEA) can be used. The DEA method is one of the non-parametric methods for evaluating performance. It also includes multi-input and multi-output variables. DEA is a proper method when establishing an evaluation mechanism with multiple indicators and when the weights cannot be objectively determined [31].
To specify the relative signicance of each risk, alternatives were given for each criterion and a set of assessment degrees was introduced for each criterion according to Eq. (16):
G = fHj1; :::; Hjkg j = 1; :::; m: (16)
In this set, Hjl to Hjk stand for assessment scores
of the criterion j from the most signicant to the least signicant and kj stands for the number of
assessment scores for each criterion [32].
If j criteria will be assessed by Nj experts,
then the results can be specied by a distribution assessment vector according to Eq. (17):
R (Cj(Ai))=
(Hj1; NEij1); :::; (Hjkj; NEijkj)
;
i = 1; :::; n; j = 1; :::; m: (17) In this case, the DEA model for determining the values of s(Hjk) can be formulated as:
Maximize :
Subject to a vij = kj
X
k=1
s(Hjk)NEijk 1;
i = 1; :::; n;
s(Hj1) 2s(Hj2) ::: kjs(Hjkj) 0; (18)
where s(Hj1); ...; s(Hjkj) are decision variables.
Then, we point out that the local weight of each decision alternative can also be dened using the belief structures in Eq. (19):
vij= kj
X
k=1
s(Hjk)NEijk; i = 1; :::; n;
j = 1; :::; m: (19) Finally, the overall weights can be generated by Eq. (20):
V (Ai)= m
X
j=1
wjvij= m
X
j=1
wj
0 @Xkj
k=1
s(HjkNEijk)
1 A ; i = 1; :::; n; (20) where wj (j = 1; :::; m) are the criteria weights
determined by the AHP methodology, vij are the
local weights determined by the DEA methodology (Eq. (19)), and V (Ai) (i = 1; :::; n) are the
overall weights of the n alternatives, based upon which the n alternatives can be prioritized or ranked [32].
3. Proposed methodology
Figure 2 depicts the proposed model for carrying out safety risk assessment in construction projects. It consists of four stages as follows.
3.1. Identication
First of all, a risk assessment group composed of safety experts, professionals, consultants, and supervising engineers of large-scale construction projects should be formed. The main tasks of the projects and their risks are identied and validated.
3.2. Analysis
Firstly, a hierarchical structure is established for risks, criteria, and original causes of undesirable events. Within fuzzy FTA, the probability of occurrence of the Top Event (TE) is calculated by assigning values to the probabilities of basic events and propagating the calculations of the probabilities. In this regard, a questionnaire is prepared for fault trees and the impact of each risk in terms of linguistic variables
Figure 2. Flowchart of the proposed approach.
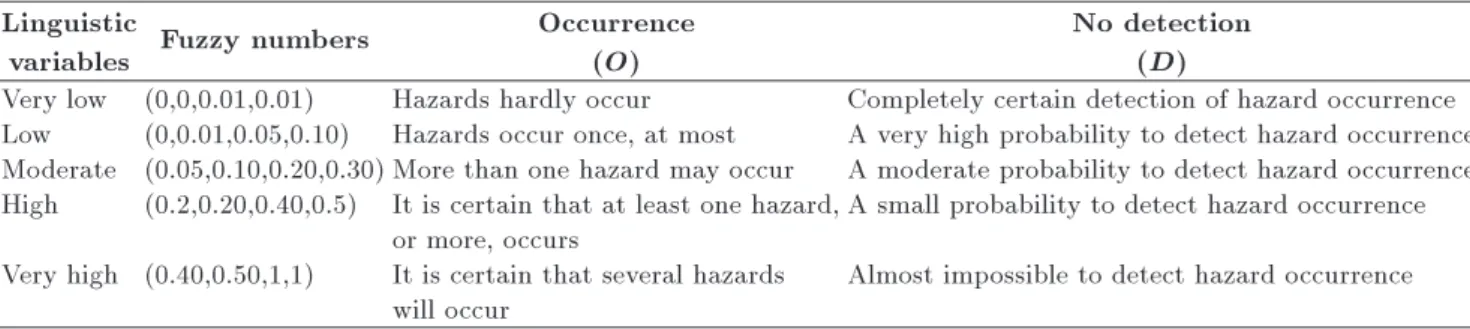
Table 1. Assessed linguistic variables for the factors of occurrence and no detection. Linguistic
variables Fuzzy numbers
Occurrence (O)
No detection (D)
Very low (0,0,0.01,0.01) Hazards hardly occur Completely certain detection of hazard occurrence Low (0,0.01,0.05,0.10) Hazards occur once, at most A very high probability to detect hazard occurrence Moderate (0.05,0.10,0.20,0.30) More than one hazard may occur A moderate probability to detect hazard occurrence High (0.2,0.20,0.40,0.5) It is certain that at least one hazard, A small probability to detect hazard occurrence
or more, occurs
Very high (0.40,0.50,1,1) It is certain that several hazards Almost impossible to detect hazard occurrence will occur
(very low, low, medium, high, and very high). It is then distributed among the safety experts, supervisors, and contractors to be completed by them. Experts are required to use linguistic terms to assess the fuzzy probability of occurrence of basic events. In Table 1 and Figure 3, the linguistic variables have been translated into fuzzy numbers. Thus, by substituting the fuzzy probabilities of basic events into Eq. (8) for dierent -cuts, the fuzzy probability of the top event can be calculated. This approach was used to calculate the two parameters of occurrence probability and risk detection/control probability.
To calculate the weight of risks impact, an
AHP-DEA method was applied. Risks impact on four criteria, i.e. harm to individuals, nancial, time, and environmental criteria, has been considered. Using
knowledge of experts (gathered in a part of the ques-tionnaire survey described in the above paragraph), a pairwise comparison was conducted and using the AHP method, harm to individuals, nancial, time, and environmental criteria were weighted.
Finally, the results of S, O, and D for each identied risk were analyzed according to the fuzzy FMEA method.
3.3. RPN (Risk Priority Number)
By multiplying the three parameters of occurrence probability, detection/control probability, and the impact of risk using -cut and Eq. (5), RPN has been obtained. The nal stage is to defuzzify these RPN numbers using Eq. (6).
3.4. Actions
At the end, the risks will be prioritized according to RPN and the required actions for those risks having a greater priority will be taken (sensitivity analysis) and the preventive course of actions will be suggested.
4. Case study: Risk assessment in large-scale construction projects
To validate the framework recommended in the area of large-scale construction projects, two major construc-tion sites located in the city of Kerman were selected. The two projects were selected as they were being run by dierent management teams and contractors.
4.1. Information of the projects
The rst is a new administrative building of Ker-man's governor-general, which is under construction in six oors with an area of 24,300 sq.m. The building is a steel-and-concrete-frame construction and the second project is a large-scale residential housing project.
4.2. Risk identication
After reviewing the accident statistics of construction sites, investigating the background of the projects, and interviewing experts and the safety managers of the projects, 10 main risks, which are common in such projects, were identied (see Table 2).
4.3. FTA (Fault Tree Analysis)
A fault tree was drawn for each risk to identify its cause. Risk occurrence probability was calculated using data from the 18 questionnaires that were returned relating to the two projects. The risk detection/control prob-ability was calculated for each project based on the 8 questionnaires of the rst project and 10 questionnaires of the second project.
4.3.1. Calculation of occurrence probability
Reviewing the literature and discussing with experts, fault trees of 10 safety-related risks were drawn. As an example, the fault tree for falling from height during welding the skeleton is depicted in Figure 4. The values of occurrence probability of basic events are
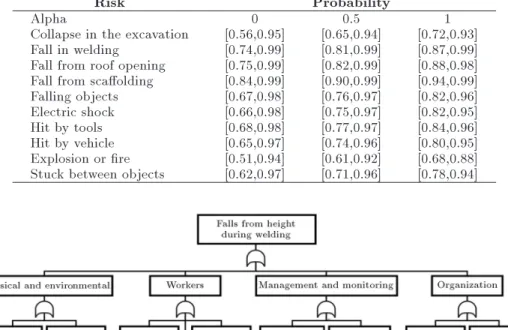
Table 2. Alpha-level sets of the fuzzy occurrence probability for the 10 failure modes.
Risk Probability
Alpha 0 0.5 1
Collapse in the excavation [0.56,0.95] [0.65,0.94] [0.72,0.93] Fall in welding [0.74,0.99] [0.81,0.99] [0.87,0.99] Fall from roof opening [0.75,0.99] [0.82,0.99] [0.88,0.98] Fall from scaolding [0.84,0.99] [0.90,0.99] [0.94,0.99] Falling objects [0.67,0.98] [0.76,0.97] [0.82,0.96] Electric shock [0.66,0.98] [0.75,0.97] [0.82,0.95] Hit by tools [0.68,0.98] [0.77,0.97] [0.84,0.96] Hit by vehicle [0.65,0.97] [0.74,0.96] [0.80,0.95] Explosion or re [0.51,0.94] [0.61,0.92] [0.68,0.88] Stuck between objects [0.62,0.97] [0.71,0.96] [0.78,0.94]
obtained using 18 questionnaires gathered from the two projects. Then, trapezoidal fuzzy numbers were attributed to linguistic variables and the probability of fuzzy occurrence of basic events was examined using linguistic corrections as indicated in Table 1. Finally, by fault tree analysis, fuzzy probability of the top event was calculated according to the -cuts concept.
By using the minimal cut equation dened in Eq. (1) and applying Eqs. (7) and (8), the fuzzy probability of the top event can be represented as shown in Eq. (21):
FPro(top event) = 1
(1 F P ro(A))
(1 F P ro(B)) (1 F P ro(C)) (1 F P ro(D)) (1 F P ro(E)) (1 F P ro(F )) (1 F P ro(G))
(1 F P ro(H)) (1 F P ro(I))
: (21) Eq. (21) is used to calculate fuzzy probability of the top event by incrementally increasing the value of alpha by 0.10 increments.
By using Eq. (5) to solve the multiplication oper-ator in Eq. (8), the fuzzy probability of occurrence of
the top event at alpha, which equals zero, is calculated based on Eq. (21).
By substituting the fuzzy probability of basic events into Eq. (21) for dierent -cuts, the fuzzy probability of the top event can be calculated as shown in Table 2.
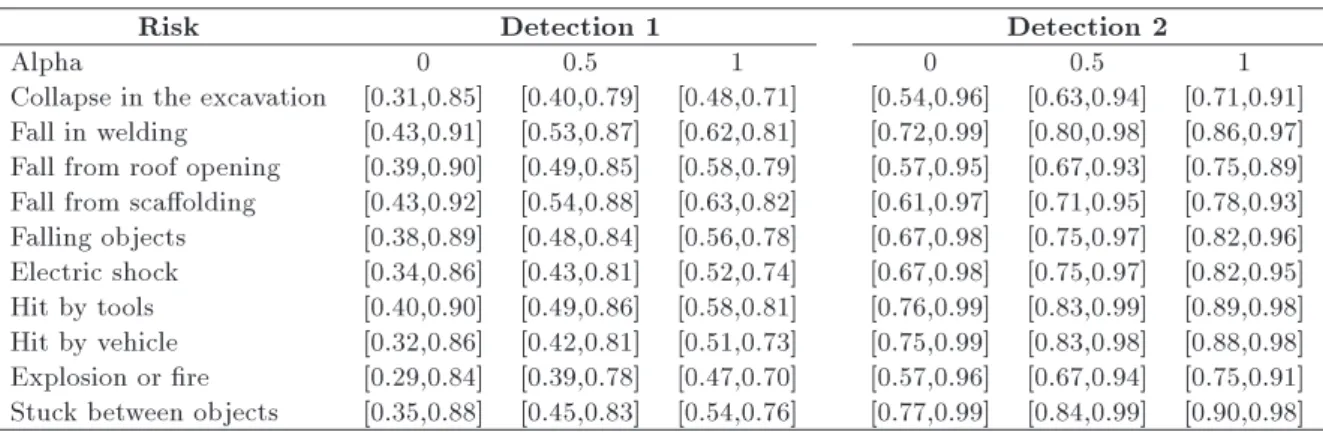
4.3.2. Calculation of detection probability
To calculate the risk detection probability, original causes of the risks were identied and a fault tree was drawn for all risks as depicted in Figure 5. Since two dierent construction projects have been studied, the risk detection probabilities for the projects were calculated individually. The results of the fault tree analysis for each project are given in Table 3.
4.4. Calculation of the impact of risk
To calculate the weight of risks impact, an AHP-DEA method was applied. Risks impact on four criteria, i.e. harm to individuals, nancial, time, and environmental criteria, has been considered. Using knowledge of experts, a pairwise comparison was conducted and using the AHP method, harm to individuals, nancial, time, and environmental criteria were weighted. The results of this process are 0.715, 0.092, 0.046, and 0.147 with a rate of adaptability of 0.07. Since the rate of adaptability, as obtained, is less than 0.1, the values of criteria are correct and the responds of participants follow a satisfactory adaptability. To calculate the
Figure 5. Fault tree of risk detection probability. Table 3. Alpha-level sets of the fuzzy detection probability.
Risk Detection 1 Detection 2
Alpha 0 0.5 1 0 0.5 1
Collapse in the excavation [0.31,0.85] [0.40,0.79] [0.48,0.71] [0.54,0.96] [0.63,0.94] [0.71,0.91] Fall in welding [0.43,0.91] [0.53,0.87] [0.62,0.81] [0.72,0.99] [0.80,0.98] [0.86,0.97] Fall from roof opening [0.39,0.90] [0.49,0.85] [0.58,0.79] [0.57,0.95] [0.67,0.93] [0.75,0.89] Fall from scaolding [0.43,0.92] [0.54,0.88] [0.63,0.82] [0.61,0.97] [0.71,0.95] [0.78,0.93] Falling objects [0.38,0.89] [0.48,0.84] [0.56,0.78] [0.67,0.98] [0.75,0.97] [0.82,0.96] Electric shock [0.34,0.86] [0.43,0.81] [0.52,0.74] [0.67,0.98] [0.75,0.97] [0.82,0.95] Hit by tools [0.40,0.90] [0.49,0.86] [0.58,0.81] [0.76,0.99] [0.83,0.99] [0.89,0.98] Hit by vehicle [0.32,0.86] [0.42,0.81] [0.51,0.73] [0.75,0.99] [0.83,0.98] [0.88,0.98] Explosion or re [0.29,0.84] [0.39,0.78] [0.47,0.70] [0.57,0.96] [0.67,0.94] [0.75,0.91] Stuck between objects [0.35,0.88] [0.45,0.83] [0.54,0.76] [0.77,0.99] [0.84,0.99] [0.90,0.98]
Table 4. Overall score for severity of risks.
Risk Local risk scores Overall impact
score Human
(0.715)
Financial (0.092)
Time (0.046)
Environmental (0.147)
Collapse in the excavation 0.76 .82 1 0.77 0.778
Fall in welding 1 0.75 0.60 0.32 0.860
Fall from roof opening 0.96 0.74 0.58 0.32 0.828
Fall from scaolding 0.97 0.71 0.57 0.32 0.828
Falling objects 0.80 0.71 0.59 0.32 0.710
Electric shock 0.78 0.56 0.59 0.31 0.684
Hit by tools 0.70 0.55 0.58 0.31 0.626
Hit by vehicle 0.81 0.71 0.65 0.32 0.719
Explosion or re 0.70 1 0.95 1 0.781
Stuck between objects 0.76 0.60 0.62 0.32 0.672
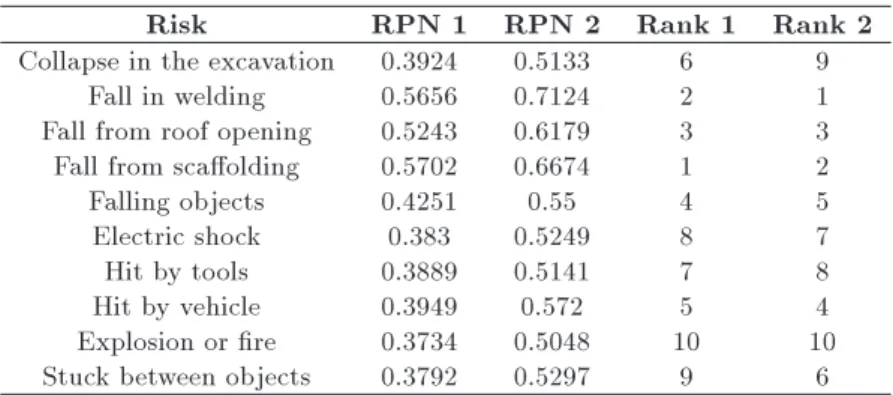
Table 5. Prioritization of failure modes.
Risk RPN 1 RPN 2 Rank 1 Rank 2
Collapse in the excavation 0.3924 0.5133 6 9
Fall in welding 0.5656 0.7124 2 1
Fall from roof opening 0.5243 0.6179 3 3 Fall from scaolding 0.5702 0.6674 1 2
Falling objects 0.4251 0.55 4 5
Electric shock 0.383 0.5249 8 7
Hit by tools 0.3889 0.5141 7 8
Hit by vehicle 0.3949 0.572 5 4
Explosion or re 0.3734 0.5048 10 10
Stuck between objects 0.3792 0.5297 9 6
weight of each sub-criterion, the DEA method was applied according to Eq. (18).
For data assessment, model (18) for each of the four criteria is solved to generate the local risk scores with respect to the four criteria. Note that local weights can be interpreted and understood as local risk scores in risk assessment applications. For human criterion, we have the following optimal solution to model (18):
S(V H) = 0:0615; S(H) = 0:0492; S(M) = 0:0369; S(L) = 0:0246; S(V L) = 0:0123:
As such, the following optimal solutions have been obtained from model (18) for nancial, time, and environmental criteria, respectively:
S(V H) = 0:0705; S(H) = 0:0564; S(M) = 0:0423; S(L) = 0:0282; S(V L) = 0:0141;
S(V H) = 0:0835; S(H) = 0:0668; S(M) = 0:0501; S(L) = 0:0334; S(V L) = 0:0167;
S(V H) = 0:087; S(H) = 0:0696; S(M) = 0:0522;
S(L) = 0:0348; S(V L) = 0:0174:
Based on the above optimal solutions, the local risk scores with respect to each of the four criteria are calculated by Eq. (19) and presented in Table 4.
Finally, the total weight of impact of each risk is obtained by Eq. (20) as indicated in Table 4. For example, the overall impact score for collapse in the excavation risk is calculated by Eq. (20), as shown below:
Overall impact score = (0:715 0:76) +(0:092 0:82) + (0:046 1) +(0:147 0:77) = 0:778:
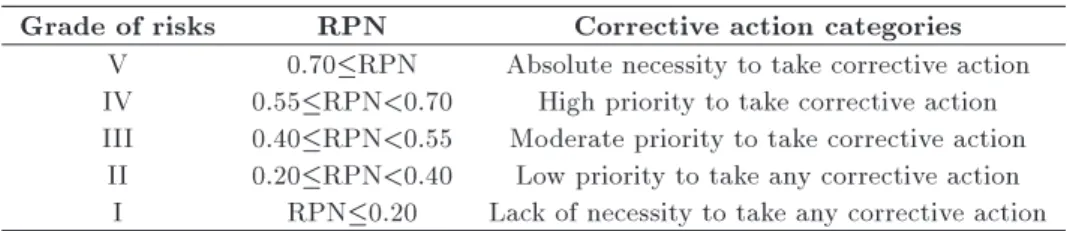
4.5. RPN (Risk Priority Number)
Based on the results of occurrence probability, the impact and detection probability of each risk, Risk Pri-ority Number (RPN), is obtained for both construction workshops and the risks are rated (Table 5). Then, the required actions for those risks with higher priorities can be taken as a priority (Table 6).
According to Tables 1 to 3, the values of O, D, and S for the risk of collapse in the excavation are:
Table 6. Grades of risks for safety in construction of mass housing. Grade of risks RPN Corrective action categories
V 0.70RPN Absolute necessity to take corrective action IV 0.55RPN<0.70 High priority to take corrective action III 0.40RPN<0.55 Moderate priority to take corrective action
II 0.20RPN<0.40 Low priority to take any corrective action I RPN0.20 Lack of necessity to take any corrective action
O0= [0:56; 0:95];
O1= [0:72; 0:93];
Detection1 = (0:31; 0:48; 0:71; 0:85); D0= [0:31; 0:85];
D1= [0:48; 0:71];
Severity = 0:778:
By using Eq. (5) to solve the multiplication operator, the RPN at , which equals 0 and 1, is calculated as follows:
RPN10=S O D = 0:778
(0:56 0:31; 0:95 0:85)
= [0:136; 0:629]; RPN11=S O D = 0:778
(0:72 0:48; 0:93 0:71)
= [0:272; 0:520]; RPN = (0:136; 0:272; 0:520; 0:629):
And, nally, the defuzzied value of collapse in the excavation is calculated as follows based on Eq. (6):
M = (a + 2(b + c) + d)6
= (0:136 + 2(0:272 + 0:520) + 0:629)6
= 0:3924:
4.6. Results and discussion
Using the RPN results and risks rating, the following results are obtained:
1. In the rst project (administrative building), risks of falling from the scaold and explosion or re are identied as the most signicant risk (RPN= 0.5702) and the least signicant risk (RPN= 0.373), respectively. In this project, since the workers do not use safety harnesses, the risk of falling from the scaold is found to be the most signicant risk. The lowest risk in both projects is related to explosion or re, because in these projects, ammable materials are not stored in the sites;
2. In the second project (residential), the risk of falling of individuals during welding is known as the most signicant risk (RPN= 0.7124). Since the issues related to safety and supervisions have not been adequately considered in this project, the risks of this project will be more than the risks referred to in the rst project.
Validation of the results was carried out, and by using the proposed model, it was found that the risk of falling from height is the most probable risk incident. This nding was in line with the past studies such as Amiri et al. [33], Liu and Tsai [34], Halvani et al. [35], Gurcanli and Mungen [36], Zeng et al. [37], Im et al. [38], Mungen and Gurcanli [39], and Larsson and Field [40]. Moreover, considering severity, the risk of falling from height was also found to be the most harmful accident in this research. This was also consistent with the past studies such as Ale et al. [41], CPWR [42], and Dong et al. [43].
From another point of view, in the statistical report of occupational accidents in the construction industry between 2007 and 2011, it is observed that falls and slips, falling objects, and becoming stuck be-tween objects are the most frequent types of accidents in Kerman province [44]. This is also consistent with the results of the current study. To investigate the applicability, comprehensiveness, and validity of the proposed model, a questionnaire was designed and risk assessment groups were invited to attend a meeting. Based on the judgment of experts, it can be concluded that the framework is applicable to all construction sites, covers all safety aspects, and has valid results.
5. Conclusion
frame-work and applied it to two large-scale construction projects. The proposed method is based on recent literature and eld studies. In this method, a combi-nation of fuzzy logic and AHP-DEA, FMEA, and FTA was used to assess safety-related risks in construction projects.
To validate the suggested framework in the eld of large-scale construction projects, some studies were conducted on two dierent construction projects. Fur-ther research can be carried out in order to provide a software package for safety risk assessment and man-agement in construction sites based on the framework described in this study.
References
1. McDonald, M.A., Lipscomb, H.J., Bondy, J. and Glazner, J. \Safety is everyone's job: The key to safety on a large university construction site", J. of Safety Research, 40, pp. 53-61 (2009).
2. Tam, C.M., Zeng, S.X. and Deng, Z.M. \Identifying elements of poor construction safety management in China", Safety Science, 42, pp. 569-586 (2004). 3. Pinto, A., Nunes, I.L. and Ribeiro, R.A. \Occupational
risk assessment in construction industry - Overview and reection", Safety Science, 49, pp. 616-624 (2011). 4. Rezakhani, P. \Fuzzy risk analysis model for con-struction projects", Int. J. of Civil and Structural Engineering, 2, pp. 35-40 (2012).
5. Zayed, T., Amer, M. and Pan, J. \Assessing risk and uncertainty inherent in Chinese highway projects using AHP", Int. J. of Project Management, 26, pp. 408-419 (2008).
6. Yeh, R.H. and Hsieh, M.H. \Fuzzy assessment of FMEA for a sewage plant", J. of the Chinese Institute of Industrial Engineers, 24, pp. 505-512 (2007). 7. Chin, K.S., Chan, A. and Yang, J.B. \Development of
a fuzzy FMEA based product design system", The Int. J. of Advanced Manufacturing Technology, 36(7-8), pp. 633-649 (2008).
8. Abdelgawad, M. and Fayek, A.R. \Risk management in the construction industry using combined fuzzy FMEA and fuzzy AHP", J. of Construction Engineer-ing & Management, 136, pp. 1028-1036 (2010). 9. Chang, K.H. and Cheng, C.H. \A risk assessment
methodology using intuitionistic fuzzy set in FMEA", Int. J. of Systems Science, 41, pp. 1457-1471 (2010). 10. Wang, Y., Xie, M., Habibullah, M.S. and Ng, K.M.
\Quantitative risk assessment through hybrid causal logic approach", Proc. Insti. Mech. Eng., 225(3), pp. 323-332 (2011).
11. Abdelgawad, M. and Fayek, A. \Fuzzy reliability analyzer: Quantitative assessment of risk events in the construction industry using fuzzy fault-tree analy-sis", J. of Construction Engineering and Management, 137(4), pp. 294-302 (2011).
12. Mentes, A. and Helvacioglu, I.H. \An application of fuzzy fault tree analysis for spread mooring systems", Ocean Eng., 38(2-3), pp. 285-294 (2011).
13. Nieto-Morotea, A. and Ruz-Vila, F. \A fuzzy approach to construction project risk assessment", Int. J. of Project Management, 29(2), pp. 220-231 (2011). 14. Zadeh, L. \Fuzzy sets", Information and Control, 8,
pp. 38-53 (1965).
15. Wang, Y.M. and Elhag, T.M. \A fuzzy group decision making approach for bridge risk assessment", Com-puters and Industrial Engineering, 53(1), pp. 137-148 (2007).
16. Nasseri, H. \Fuzzy numbers: Positive and nonnega-tive", Int. Mathematical Forum, 3(36), pp. 1777-1780 (2008).
17. Xu, Z., Khoshgoftar, T.M. and Allen, E.B. \Applica-tion of fuzzy expert system in assessing opera\Applica-tional risk of software", Information and Software Technology, 45, pp. 373-388 (2003).
18. Verma, A.K., Srividya, A. and Gaonkar, R.S.P. \Fuzzy-reliability engineering: concepts and applica-tions", pp. 88-127, Narosa Publishing House, New Delhi, India (2007).
19. Lin, H.F. and Lee, G.G. \A study of service quality evaluation model for virtual knowledge communities", E-Commerce Study, 4(2), pp. 211-234 (2006).
20. Chin, K.S., Chan, A. and Yang, J.B. \Development of a fuzzy FMEA based product design system", Int. J. of Advanced Manufacturing Technology, 36, pp. 633-649 (2008).
21. Bowles, J.B. \An assessment of PRN prioritization in a failure modes eects and criticality analysis", J. of the IEST, 47, pp. 51-56 (2004).
22. Braglia, M., Frosolini, M. and Montanari, R. \Fuzzy criticality assessment model for failure modes and eects analysis", Int. J. of Quality & Reliability Man-agement, 20(4), pp. 503-524 (2003).
23. Chang, C.L., Liu, P.H. and Wei, C.C. \Failure mode and eects analysis using grey theory", Integrated Manufacturing Systems, 12(3), pp. 211-216 (2001). 24. Pillay, A. and Wang, J. \Modied failure mode and
eects analysis using approximate reasoning", Relia-bility Engineering & System Safety, 79(1), pp. 69-85 (2003).
25. Sankar, N.R. and Prabhu, B.S. \Modied approach for prioritization of failures in a system failure mode and eects analysis", Int. J. of Quality & Reliability Management, 18(3), pp. 324-335 (2001).
26. Vario, J.K. \Fault tree analysis of phased mission sys-tem with repairable and non-repairable components", Reliability Engineering and System Safety, 74(2), pp. 169-180 (2001).
27. Lavasani, M.M., Wang, J., Yang, Z. and Finlay, J. \Application of fuzzy fault tree analysis on oil and gas oshore pipelines", Int. J. Mar. Sci. Eng., 1(1), pp. 29-42 (2011).
28. Vidal, L.A., Marle, F. and Bocquet, J.C. \Using a Del-phi process and the Analytic Hierarchy Process (AHP) to evaluate the complexity of projects", Expert Systems with Applications, 38(5), pp. 5388-5405 (2011). 29. Badri, A., Nadeau, S. and Gbodossou, A. \Proposal of
a risk-factor-based analytical approach for integrating occupational health and safety into project risk evalua-tion", Accident Analysis & Prevention, 48, pp. 223-234 (2012).
30. Aminbakhsh, S., Gunduz, M. and Sonmez, R. \Safety risk assessment using analytic hierarchy pro-cess (AHP) during planning and budgeting of construc-tion projects", J. of Safety Research, 46, pp. 99-105 (2013).
31. Wang, Y.M., Liu, J. and Elhag, T. \An integrated AHP-DEA methodology for bridge risk assessment", Computers & Industrial Engineering, 54(3), pp. 513-525 (2008).
32. Wang, C.H., Chuang, C.C. and Tsai, C.C. \A fuzzy DEA-Neural approach to measuring design service performance in PCM projects", Automation in Con-struction, 18(5), pp. 702-713 (2009).
33. Amiri, M., Ardeshir, A. and Fazel Zarandi, M.H. \Risk-based analysis of construction accidents in Iran during 2007-2011-meta analyze study", Iranian Jour-nal of Public Health, 43(4), pp. 507-522 (2014). 34. Liu, H.T., Tsai, Y.L. \Fuzzy risk assessment approach
for occupational hazards in the construction industry", Safety Sciences, 50, pp. 1067-1078 (2012).
35. Halvani, G.H., Jafarinodoushan, R., Mirmohammadi, S.J. and Mehrparvar, A.H. \A survey on occupational accidents among construction industry workers in Yazd city: Applying Time Series 2006-2011", J. of Occupa-tional Health and Epidemiology, 1(1), pp. 1-8 (2012). 36. Gurcanli, G.E. and Mungen, U. \An occupational
safety risk analysis method at construction sites using fuzzy sets", Int. J. of Industrial Ergonomics, 39(2), pp. 371-387 (2009).
37. Zeng, S.X., Tam, V.W. and Tam, C.M. \Towards occu-pational health and safety systems in the construction industry of China", Safety Science, 46(8), pp. 1155-1168 (2008).
38. Im, H.J., Kwon, Y.J., Kim, S.G., Kim, Y.K., Ju, Y.S. and Lee, H.P. \The characteristics of fatal occupa-tional injuries in Korea's construction industry, 1997-2004", Safety Science, 47(8), pp. 1159-1162 (2009). 39. Mungen, U. and Gurcanli, G.E. \Fatal trac accidents
in the Turkish construction industry", Safety Science, 43(5), pp. 299-322 (2005).
40. Larsson, T.J. and Field, B. \The distribution of occupational injury risks in the state of Victoria", Safety Science, 40(5), pp. 419-437 (2002).
41. Ale, B.J., Bellamy, L.J., Baksteen, H., Damen, M., Goossens, L.H., Hale, A.R. and Whiston, J.Y. \Acci-dents in the construction industry in the Netherlands:
An analysis of accident reports using story builder", Reliability Engineering & System Safety, 93(10), pp. 1523-1533 (2008).
42. CPWR - The Center for Construction Research and Training, The Construction Chart Book: The U.S. Construction Industry and Its Workers, 4th Ed. Silver Spring (2008).
43. Dong, X.S., Wang, X. and Daw, C. \Fatal falls among older construction workers", Human Factors: The Journal of the Human Factors and Ergonomics Society, 54(3), pp. 303-315 (2012).
44. \Statistical report of occupational accidents in the construction industry between 2007-2010", Social Se-curity Organization of the Islamic Republic of Iran, Tehran: Statistics and Social-economic Calculations Oce (2012) (In Persian).
Biographies
Abdollah Ardeshir was born in Amol, Iran, in 1953. He received a BS degree in Civil Engineering from University of Kentucky, Lexington, USA, in 1986. Also, he received an MS degree in Hydraulic Engineering and Construction Management (Civil Engineering) in 1988 and a PhD degree in Hydraulics Engineering (Civil Engineering) in 1993 from University of Kentucky, Lexington, USA. He is currently Head of Environmen-tal Research Center and Associate Professor in Civil and Environmental Engineering Faculty at Amirkabir University of Technology, Tehran, Iran. His main research interests are hydraulics, construction manage-ment, construction safety, health and environmental management, risk and crisis management.
Mehdi Mohajeri was born in Kerman, Iran, in 1985. He received a BS degree in Civil Engineering from Islamic Azad University, Kerman, Iran, in 2006 and an MS degree in HSE Engineering in 2012 from Amirkabir University of Technology. His main research interests are construction safety management and risk management.
Mehran Amiri was born in Mashhad, Iran, in 1978. He received a BS degree in Civil Engineering and MS and PhD degrees in Construction Engineering and Management (Civil Engineering), respectively, in 2000, 2003 and 2015, all from Amirkabir University of Technology. He is currently Assistant Professor in the Department of Civil Engineering at Payame Noor University, Mashhad, Iran. His main research interests are construction safety, health and environmental man-agement, risk and crisis manman-agement, project planning and control, articial intelligence, and data-mining.