ISSN 1479-4403 87 ©Academic Conferences Ltd
A Novel Approach to Define Performance Metrics for
Students’ and Teachers’ Evaluation
Pradipta Biswas and S.K. GhoshIndian Institute of Technology, Kharagpur, India [email protected]
Abstract: Evaluation is an unavoidable feature in any teaching or learning scenario. The evaluation strategy of students differs widely throughout the world. Further, most of the institutes do not use any objective technique to assess the teaching performance of a teacher. The present paper defines performance metrics both for student and teacher evaluation and also discusses the methodology for calculating relevant metrics. In a decision-making scenario, these metrics may help in providing enough insight into the assimilation capability of students and teaching capability of teachers. Once measured properly for an adequate length of time, these metrics can also be customised to provide other useful information like utility of a course modification, institutional performance etc. The system has been tested for analysing four courses in a premier engineering institute and the outcome found to be encouraging.
Keywords: education technology, evaluation system data warehouse, performance metric, ontology
1. Introduction
In any educational institution, besides regular teaching and learning activities, evaluation is a matter of utmost importance. It can be defined as “a series of procedures carried out to collect information about learning experiences on the basis of which recommendations can be made to improve the quality of the services provided” (Edwards 1991). It is not only important from the students’ point of view; rather the performance of the whole institute depends on the evaluation techniques. The objectives of an evaluation process can be summarised as follows (Harlen 1978, Deale 1975).
̇ To gather information about a wide range of student characteristics as feedback for making decisions about the learning environment, especially in the context of matching experiences to individual students.
̇ To accumulate information which will enable to define progress (or lack of it) and corrective actions to be taken, if required.
̇ To provide information to a teacher, which will help him/her in judging the effectiveness of his/her teaching with respect to individual students or groups.
̇ To inform other teachers who may have to make decisions about the students. ̇ To compare progress of students under different teachers.
̇ To compare new teaching materials with old and finally to help in developing an efficient and effective teaching policy.
̇ To allocate students to streams or sets based on their competence in different branches of their course.
̇ To inform employers or higher education institutions about attainments.
The present research on intelligent and automatic evaluation techniques mainly concentrates on automatic evaluation of computer programs (Benford et al 1993, Foxley et al 1998, Brusilovsky et al 1996) or mathematical problems (Sapir 1999, Xiao 1999). It has also been tried to evaluate free text answers based on different text processing methods like keyword based analysis (Burstein et al 2001), pattern matching techniques (Ming et al 2000) etc. In Alfonseca et al (2001) the BLEU method of machine translation system is used for evaluating free text answer, but the method does not work properly for certain kind of questions (like asking yes/no or advantage/disadvantage like questions). In VanLehn (1997), an evaluation technique is presented which is based on the student model. The evaluation technique in VanLehn is mainly concerned with the extent of assimilation of concepts. The inference mechanism of the system is based on Bayesian Network. The system has been demonstrated for physics only and it deals with 290 physics rules. But the approach does not seem to be scalable for a large number of concepts. The existing systems have the main focus on the assessment techniques of students. Unfortunately, there is hardly any universal mechanism that can
give the best assessment. In Reddy (2004), “Analytical Hierarchical Process” is used for calculating accurate weightage for theory and practical examinations and the approach is claimed to be universal across institutions. But in all cases, two major aspects of evaluation have been ignored (Biswas and Ghosh 2005) namely,
̇ Assessment of teachers and teaching policy.
̇ Defining a universal metric to measure the performance of students and teachers irrespective of a particular course, subject or institution.
Both of these factors are extremely important from an institutional point of view. It is a common observation that students prefer some teachers than others based on various reasons. So there should be an objective mechanism to measure the teacher’s teaching performance also, along with the students’ performance. Finally a universal metric of performance is needed very much for a comparative study of students, and teachers throughout a large number of institutions. The present paper discusses about some universal performance metrics for teachers and students and the methodology for measuring them. The metrics are viewed both from theoretical point of view and implementation point of view. From theoretical point of view, the significance of the metrics is given and their definitions are expressed through propositional calculus statements. From implementation point of view, scheme diagrams for an online database and a data warehouse have been described for storing enough information about a curriculum as well as efficient measurement of the performance metrics. The scope of the metrics presented in this paper is not only confined to performance evaluation, rather more sophisticated decisions regarding course modification and institution performance can easily be taken from the metrics. The organisation of the paper is as follows. In the next section the proposed methodology is discussed. Section 3 demonstrates a case study that gives an example of application of the proposed methodology. Finally conclusion is drawn at section 4.
2. The proposed methodology
The present paper discusses about an evaluation system, which can be used to evaluate the performance of both students and teachers in an educational institution. In the next section an operational overview of the proposed methodology will be presented. The evaluation will be done based on online examinations held at different time of a course. The online examination is found to make no change in scoring compared to paper pencil tests (Bodmann et al 2004). However the system can also be used (with dropping some of its features) for a traditional offline examination system. In fact, the case study in section 3 will describe a limited application of the system for a traditional system where the examinations were not online. The system is designed to be used for a long duration of time covering a number of academic sessions. It has been suggested in Aspinwall (2005) that an evaluation system should be build up step by step; perhaps using different methods for data collection until enough is available. So, the emphasis is given on designing a database schema for storing basic information about course curriculums; and later consolidating the information stored in the database into a data warehouse for efficient long-term data analysis. The data warehouse will actually be used to evaluate students and teachers’ performance on a long range and also to take strategic decisions about a course design, improvement measurement etc. In section 2.2, the designs of an online database and data warehouse are presented. The point assignment technique in an online examination is described in section 2.3. We have defined several performance metrics to aid decision-making regarding performance measurement of students, teachers and institutes based on the points scored by students. Definitions of these performance metrics are presented in section 2.4. In section 2.5 and 2.6, practical implications of the metrics and some other important utilities of the proposed evaluation methodology is pointed out respectively.
2.1 Operational overview
The proposed evaluation system will operate in three phases, namely, ̇ Initialisation Phase
̇ Running Phase ̇ Assessment Phase
These system phases conform to the regular course calendar. The initialisation phase will take place before start of a course. The running phase will run with the course. After the end of the course, the students’ and teachers’ performance will be evaluated in the assessment phase. The initialisation phase mainly concerns with database fill up with curriculum details and demographic information. A
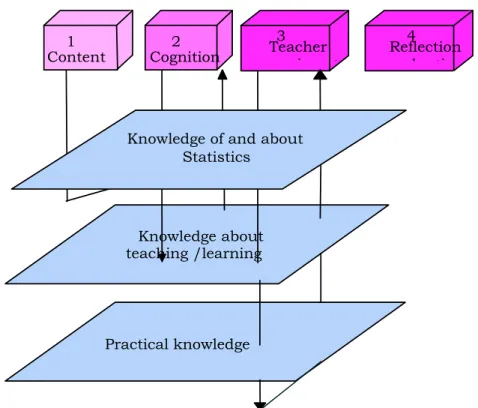
course is broken up into a number of subjects. Each subject is further classified into chapters or topics. Further, a topic is broken up into some concepts. For example, a secondary level science course can be divided into subjects like physics, chemistry, biological sciences and mathematics. Now physics can be classified into topics like optics, magnetism, mechanics etc. The topic mechanics includes concepts like free body diagram, inclined plane, momentum etc. The ontology of a course is shown in Fig.1. In order to extend this ontology for several subjects, we can define surmise relationships among different concepts and topics of different subjects and once fully developed, the ontology can also be easily used to define a knowledge space for a student (Dietrich et al 2001). In Reddy (2004) the variance of student performance is shown to be dependent on the standard on question papers and subjects. So, it can be inferred that an evaluation technique should use different weightages for different subjects and questions. To take care of this fact, each topic, concept and question is associated with a difficulty index (refer Fig.1). In Rios et al (1998), Rehak (1997) and Byrnes (1995), we get a list of other metadata associated with a question like type, topics assessed, complexity etc. to generate customised and personalised examinations or quiz sessions. Most of these metadata are inherent in our system due to considering the ontology structure (refer Fig. 1) of a course. In the proposed system, besides difficulty level, we consider only another metadata of a question, vie. an expected answer-time. This expected answer time can be used to differentiate a blind guess from an intelligent guess by comparing it to the response time of a question in an online examination scenario (more elaborately explained in section 2.3).
In the running phase, the teacher can periodically evaluate the class performance by designing online examinations or quiz sessions. These examinations or quiz can be designed using the existing question-answers within the database or by inserting new questions and answers. Even the course instructor can add new topics or concepts during this running phase. Short-term assessment can also be carried out by manually analysing the points scored by the students during an examination. The point calculation system is explained in the section. After the end of the course, the final assessment will be carried out. The final assessment will not only consider the immediate performance of a student in a single course, but also takes care of historical data available about the students, teachers and subjects. Sufficient data will be maintained to calculate the performance metrics as defined in section 2.3.
2.2 Database design
The database is designed according to the operational phases of the system. The initialisation and running phase will deal with an online normalised database. In the assessment phase, the content of the database will be analysed and consolidated into a data warehouse. This data warehouse will store information that will facilitate to calculate performance metrics at various levels of granularities and for various combinations of the dimensions. The schemas of the database and data warehouse are furnished in the next two sections.
2.2.1 Database tables
The database is designed to automate the whole evaluation process. A database always provides more flexibility in designing an examination or quiz session (Brusilovsky and Miller 2001). The teachers’ and students’ details will be stored in two tables for analysing their performance individually. The Teacher_Allotment table remembers the courses taught by a particular teacher. The course ontology will be stored in Subject, Topic and Concept tables and their relationships will be stored in two separate tables (Concept_Topic_Mapping, Subject_Concept_Mapping). The examination questions and answer-options need to be pre-stored in Question and Answer tables. The Question_Answer_Mapping table stores correct answer(s) of each question. If the methodology is deployed in a subjective examination system (which does not provide answer options), the Answer and Auestion_Answer_Mapping tables need to be dropped. To use the system in a paper-pencil based examination scenario, the expected response time field of Question table has to be dropped. The rest portion of the database remains same in all cases.
Figure 1. Ontology of the course Table 1.Database tables
Sl. No. Table Name Utility
1 Teacher Stores Teachers’ demographic information 2 Teacher_Allotment Stores the subjects taken by a teacher
3 Topic Stores Topic Details
4 Concept Stores Concept Details
5 Answer Stores the answer statements 6 Concept_Topic_Mapping Maps each Topic to a Concept 7 Examination Stores Examination information 8 Question Stores question related information 9 Student Stores Students’ demographic information 10 Question_Answer_Mapping Maps each answer to a question
11 Student_Session Stores examination details of individual student 12 Subject_Concept_Mapping Maps each Concept to a Subject
13 Subject Stores each subject information Subject
Topic [Topic Difficulty Index]
Concept [Concept Difficulty Index]
Questions
[Question Difficulty Index]
[Expected Answer Time] has
has has
Figure 2. Online database scheme 2.2.2 Data warehouse tables:
Data warehouse is a subject oriented, time variant, non-volatile, integrated repository of data (Han 2000). It will consolidate the content of the operational database for ease of decision-making. The main differences of data warehouse with the database will be in its utilisation, access pattern and size (Twelve Rules That Define a Data Warehouse 2005). It has been designed by considering aims of an evaluation process presented in section 1. The data warehouse has two fact tables and six dimensions. The fact is the points scored by student in an examination.
Table 2. Data warehouse tables
Sl. No. Table Name Utility
1 Concept Stores Concept Details 2 Examination Stores Examination information
3 Student Stores Students’ demographic information 4 Student_Fact_Table Table to asses Students’ learning Rate 5 Subject Stores each subject information
6 Teacher Stores Teachers’ demographic information 7 Teacher_Fact_Table To evaluate Teachers’ Performance 8 Topic Stores Topic Details
Figure 3. Online data warehouse scheme 2.3 Point calculation techniques
In a traditional system, students’ marks are decided by the extent of correctness of his answer. In the present system, we attempt to calculate marks not only based upon the correctness of an answer, rather considering the hardness of the question and the topic from which the question is developed. The intellect level of a student is tried to be reflected in his obtained marks by considering the response time taken to answer a question. However if the system is deployed in a paper-pencil based examination scenario, the response time cannot be measured for individual questions and need to be dropped. The point calculation will be as follows
Point obtained by answering a question= (Topic Difficulty Index * Concept Difficulty Index * Question Difficulty Index * Deviation) / (Response Time)
The difficulty index signifies the hardness of a question or topic. As for example, the difficulty indices parameters can take values as shown in Table 3.
Table 3.Value of difficulty indices
Name of Difficulty Index Value for Tough
Value for Normal
Value for Easy
Topic Difficulty Index 5 3 1
Concept Difficulty Index 5 3 1
Question Difficulty Index 5 3 1
The answers given by a student will be used to judge the level of understanding of a student. As for example let us consider the following question and answer options.
Possible Answers:
a. To know IP address by giving the hardware address b. Data structure used for efficient searching
c. To know hardware address by specifying IP address d. To know router’s IP address
Among the answer options ‘c’ is correct, option ‘a’ can be considered as a silly mistake answer while option ‘b’ is totally unrelated to ARP. So analysing the given answer the level of knowledge and understanding can be easily measured. To parameterise this level of understanding a deviation parameter will be used. To measure the deviation parameter, each answer will be classified in one of six classes and value will be assigned according to the class of the answer. The different values of deviation parameter are shown in Table 4. The response time for an answer will be used to catch blind guesses. It is the time a student takes to give the answer. It will be compared with the expected answer time of a question. For some questions (say, problem-oriented question) if the response time is very much less than the expected time then it is considered as a blind guess answer and points will be assigned according to that. The weightages given to different classes of response time are shown in Table 5. The values shown in table 3, 4 and 5 are not derived mathematically rather they only serve to differentiate among the classes of difficulty indices, deviations and response times. A practical implementation of the present system is free to choose any value that is capable to consider their physical significance.
Table 4.Value of deviation parameter Parameter
name
Value for Exact Match
Value for Near Match
Value for Average Answer
Value for Below Average
Value for No idea
Deviation 5 4 3 2 0
Table 5. Weightage of different response times
Parameter name Value for Blind Guess Value for Normal Answer/ Educated Guess
Response Time 5 1
The point obtained by a student at each evaluation session is stored at concept level, topic level and subject level in the online database and later consolidated into the data warehouse.
2.4 Definitions
In this section some parameters will be defined which will be used as performance metric. These metrics will accumulate points scored by the students in various ways to measure the performances. The following proposition will be used to define the performance metrics
Student_Score(s, i, o) : Points scored by student s on i-th examination in an ontology element (subject, topic or concept) o. From the Data warehouse scheme, it can be clearly understood that this fact is nothing but the data warehouse fact in the Student Fact Table.
Teacher_Score(t, i, o) : Points scored by students on i-th examination in an ontology element (subject, topic or concept) o taught by teacher t. From the Data warehouse scheme, it can be observed that this fact is the data warehouse fact in the Teacher Fact Table.
The two performance metrics, namely, Student Learning Rate and Teacher’s Performance are defined as follows.
Student Learning Rate: It is defined as the average increase in score in two consecutive examination sessions. It is expressed as follows
Student_Learning_Rate(s, o) : Learning rate of student s in an ontology element (subject, topic or concept) o.
Student_Learning_Rate(s, o) =
∑{(Student_ Score(s, i+1, o )-Student_Score(s, i, o)) ×
(| Student_ Score(s, i+1, o) - Student_Score(s, i, o)|)}/N-1, for all i
where, N = Total number of examinations taken by teacher t which include ontology element o.
The metric will not be deviated by an instantaneous good or bad performance, since it measures the rate of change of a student’s performance over a large number of examinations.
Teacher’s Performance (o, t) : Deviation of the average points scored by the students for a particular ontology element o taught by teacher t.
Teacher’s Performance (o, t) =
Avg(Teacher_Score(t, i, o)), for all i - Avg(Teacher_Score(t, i, o)), ,for all i, t
Since a particular ontology element is taught by a number of teachers in different contexts, a single teacher cannot control the overall average. Hence effect of a particular academic session cannot affect the metric considerably. Besides these performance metrics the difficulty level of various ontology elements can also be defined (redefined) using the propositions
Difficulty_Level(o) = Difficulty level of ontology element o. Difficulty_Level(o) =
Avg(Student_Learning_Rate(s, o)), for all s
2.5 Implications of the metrics
A traditional examination system evaluates a students’ expertise at a particular point of time. It is a well-known fact that “to a teacher or anyone else trying to help an individual, a single assessment would be of little help because one may not be equally good or bad in all aspects of learning, but a lot more information is needed which merge different kind of data.” (Harlen 1994). The metric, Student Learning Rate, presented in the previous section, aims to quantify a students’ progress throughout a time interval. Faculties also do the same thing when they compare students’ marks in mid-semester, half-yearly or annual examinations. This metric is an attempt to automate this comparison process and to find students difficulties in different topics, concepts or subjects. In a big institute, there exist several departments and many a time same subject or topics are covered in curriculums of different departments. The metric Teachers Performance is an attempt to quantify a teachers’ expertise in different subjects or topics. The metric should never be used alone to measure a teachers’ performance but can be used as a part of a rating process. The difficulty level will signify the overall hardness of a subject, topic or concept. Since each of the metrics is defined at the lowest granular level, they can be rolled up to get important information about the learning process. Some examples of the uses of these metrics are given in next section.
2.6 Other utilities
Besides the performance evaluation, the metrics can be used for many other useful purposes. Some examples are given below.
̇ Generating different types of test statistics to understand and evaluate a teaching and learning system. The system can provide enough information to fulfil the aims of an evaluation system presented at section 1.
̇ Finding out the assimilation capacity for a particular topic, concept or subject for individual as well as a special type of students. Students can be rolled up by average marks, grades, age, departments, institution, province or country. The knowledge can in turn be used to develop a student model and to personalise an e-learning system.
̇ The necessity or usefulness of a course modification can be found out by comparing the difficulty levels of an ontology element (like subject, topic or concept) taught at different years.
̇ Total improvements or rate of improvement in the performance of students, teachers and a whole institution, both in absolute term and relative to other institutes, can be measured by comparing Students’ Learning rate at various rolled up levels of granularities.
3. A case study
In order to measure the performance of the proposed metrics, a data warehouse is to be built with sufficient volume of data. However the data warehouse cannot be developed unless all examinations have to be conducted through the proposed system for sufficient long time. A case study for validating
the proposed system has been carried out using available examination details for two courses from an academic section of the authors’ academic institution. The case study only demonstrates the calculation of students’ learning rates in a traditional paper-pencil based subjective examination scenario and two of the possible usages of student learning rate via. analysing a single course and comparing two courses. Unfortunately, the students’ performance measure according to a topic or concept cannot be done since data was not available at that level of granularity. However our analysis in such a limited scope also reveals some important insights into a course. Currently four courses have been analysed, which will be termed as follows
̇ Course1 Batch2 ̇ Course2 Batch1 ̇ Course3 Batch1 ̇ Course3 Batch2
Among these Course3 was taught for two batches in two consecutive years. The same teacher also taught Course2. Another teacher of the same department taught Course1. The analysis process is carried out in two phases. First each course is analysed separately and the outcomes are shown to the concerned course instructor. After reviewing the results, the instructor wanted some additional details that led to the second phase of analysis and a comparative study among the four courses. 3.1 Phase 1-course analysis
The basis of the proposed evaluation process is calculation of Students’ Learning Rate. In the case study, Students’ learning rates are calculated for each course based on marks scored by students in different assignments, class tests, mid-semester and end-semester examinations at different stages of the course. For confidentiality purpose we have not shown scoring details of an individual student, rather we clustered student in different groups and carry out our experiments on the average score obtained by each cluster (the analysis done on each cluster can also be done on individual students). The testing procedure consists of following steps.
̇ Preparation of tabulation sheets of students considering their marks at different assignments, class tests, mid-semester and end-semester examinations.
̇ Clustering students according to their marks. Each cluster corresponds to a group of similar types of students.
̇ Calculating students learning rate for each cluster.
̇ Plotting the learning rate of each cluster with respect to different evaluation stages. ̇ Analysis of the graph.
For Course 1 Batch 2 the learning rate calculation technique has been elaborated in a little more details. For rest of the courses, the student clusters, normalised scores, learning rates and learning curves are shown. Based on the learning curves we pointed out our findings for each of the courses. 3.1.1 Test result for course 1 batch 2
The first course (Course 1) for batch 2 was taken by 52 students. The evaluation process consists of three assignments, two class tests, mid-semester examination and end-semester examination. The student clusters are shown in Table 6.
Table 6. Student clusters Cluster-id
Class Test1 (40)
Assg1 (100)
Assg2 (100)
Mid Sem (60)
Assg3 (100)
Class Test2 (50)
End Sem (100)
1 17.50 28.67 0.00 28.39 8.33 31.67 44.85 2 24.79 33.43 76.43 38.11 29.07 34.00 64.93 3 24.36 66.94 85.00 40.50 39.43 36.71 69.14 4 24.05 80.18 70.00 37.00 43.55 35.32 68.32
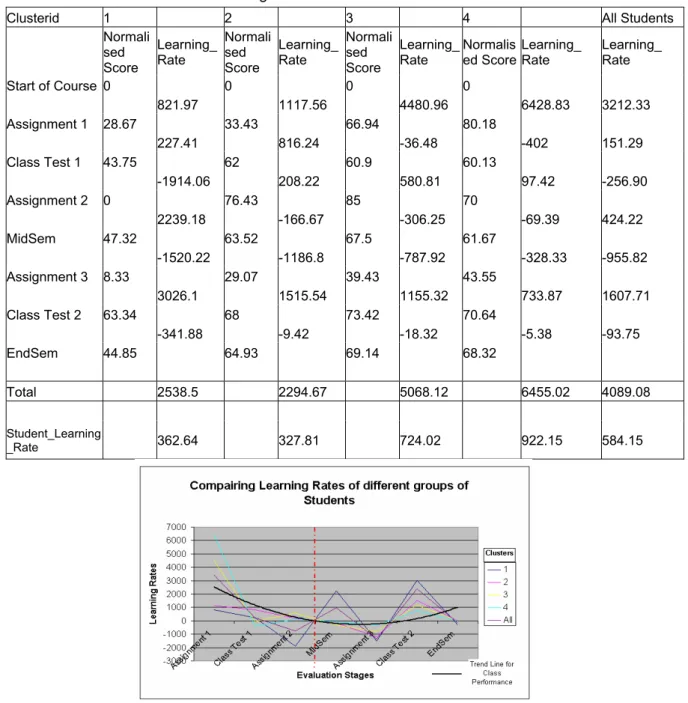
Based on Table 6 above students’ learning rates are being calculated for these four clusters as shown in Table 7. Marks at each examination or assignment are normalised to a scale of 100. Now the learning rates are plotted with respect to assignments, class tests, mid-semester and end-semester examinations i.e. different evaluation stages arranged chronologically. The plot is shown in Fig. 4. The
first observation about the curves is their zigzag nature i.e. students learning rate varies for each consecutive evaluation stages. As the evaluation stages are analysed it can be found assignments and examinations came alternatively. So students did better in assignments, did not do well in examinations and vice-versa. Hence the suggestion, based on this analysis, to the course instructor was to increase conformance between the assignments and examinations. Besides this observation, the trend line (the thick black line) shows that students learning rate decreases as the course was going on up to third assignment and then increases again. This finding is in conformance with the education structure of our institute where the course load is gradually increased up to mid-semester and then gradually decreases.
Table 7. Calculation of students’ learning rate for course 1 batch 2
Clusterid 1 2 3 4 All Students
Normali sed Score
Learning_ Rate
Normali sed Score
Learning_ Rate
Normali sed Score
Learning_ Rate
Normalis ed Score
Learning_ Rate
Learning_ Rate
Start of Course 0 0 0 0
821.97 1117.56 4480.96 6428.83 3212.33
Assignment 1 28.67 33.43 66.94 80.18
227.41 816.24 -36.48 -402 151.29
Class Test 1 43.75 62 60.9 60.13
-1914.06 208.22 580.81 97.42 -256.90
Assignment 2 0 76.43 85 70
2239.18 -166.67 -306.25 -69.39 424.22
MidSem 47.32 63.52 67.5 61.67
-1520.22 -1186.8 -787.92 -328.33 -955.82
Assignment 3 8.33 29.07 39.43 43.55
3026.1 1515.54 1155.32 733.87 1607.71
Class Test 2 63.34 68 73.42 70.64
-341.88 -9.42 -18.32 -5.38 -93.75
EndSem 44.85 64.93 69.14 68.32
Total 2538.5 2294.67 5068.12 6455.02 4089.08
Student_Learning
_Rate 362.64 327.81 724.02 922.15 584.15
Figure 4. Student leaning rate at different time of course 1 batch 2
For the rest of the courses the student clusters, normalised scores, learning rates and learning curves are shown. Learning curves are also drawn based on the learning rates of students at different time of a course.
3.1.2 Test result for course 2 batch 1
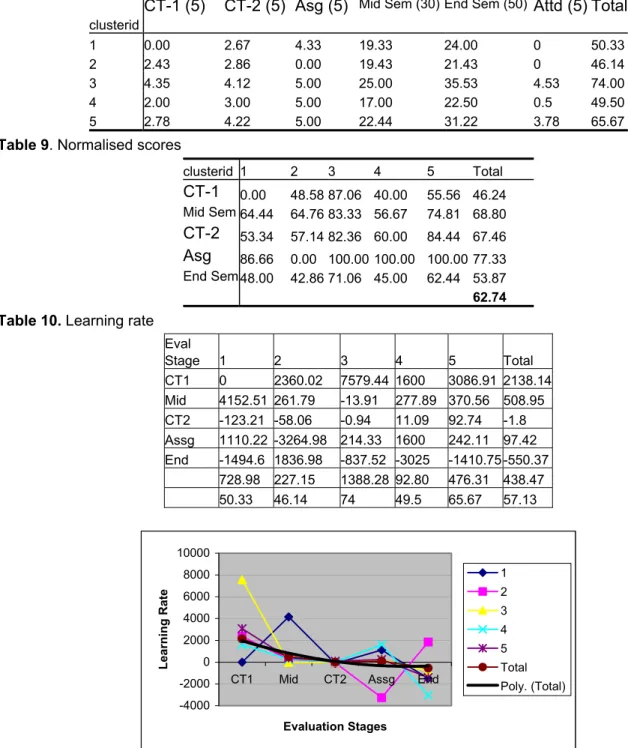
The second course (Course 2) for batch 1 was taken by 30 students. The evaluation process consists of one assignment, two class tests, mid-semester and end-semester examinations. The student clusters are shown in Table 8. Normalised scores for each cluster are shown in Table 9. The learning rate, calculated from the normalised scores, is shown in Table 10. The variation of learning rate at different time of the course is furnished in Fig. 5.
Table 8. Student clusters clusterid
CT-1 (5) CT-2 (5) Asg (5) Mid Sem (30) End Sem (50) Attd (5) Total
1 0.00 2.67 4.33 19.33 24.00 0 50.33
2 2.43 2.86 0.00 19.43 21.43 0 46.14
3 4.35 4.12 5.00 25.00 35.53 4.53 74.00
4 2.00 3.00 5.00 17.00 22.50 0.5 49.50
5 2.78 4.22 5.00 22.44 31.22 3.78 65.67
Table 9. Normalised scores
clusterid 1 2 3 4 5 Total
CT-1 0.00 48.58 87.06 40.00 55.56 46.24 Mid Sem 64.44 64.76 83.33 56.67 74.81 68.80 CT-2 53.34 57.14 82.36 60.00 84.44 67.46 Asg 86.66 0.00 100.00 100.00 100.00 77.33 End Sem 48.00 42.86 71.06 45.00 62.44 53.87
62.74 Table 10. Learning rate
Eval
Stage 1 2 3 4 5 Total
CT1 0 2360.02 7579.44 1600 3086.91 2138.14 Mid 4152.51 261.79 -13.91 277.89 370.56 508.95 CT2 -123.21 -58.06 -0.94 11.09 92.74 -1.8 Assg 1110.22 -3264.98 214.33 1600 242.11 97.42 End -1494.6 1836.98 -837.52 -3025 -1410.75 -550.37 728.98 227.15 1388.28 92.80 476.31 438.47
50.33 46.14 74 49.5 65.67 57.13
-4000 -2000 0 2000 4000 6000 8000 10000
CT1 Mid CT2 Assg End
Evaluation Stages
L
e
a
rn
in
g
R
a
te
1 2 3 4 5 Total Poly. (Total)
Figure 5. Student leaning rate at different time of course2 batch 1 Inference
̇ Except for clusters 1 and 2, the learning rate remains more or less flat for all the students (refer fig. 5). ̇ The trend line shows (refer Fig. 5) a decrease in students’ learning rate; however the average score of
the student is 57.13, which is not bad. So it may indicate the course content failed to present much new aspect to the students and so they earned marks but learned little.
3.1.3 Test result for course 3 batch 1
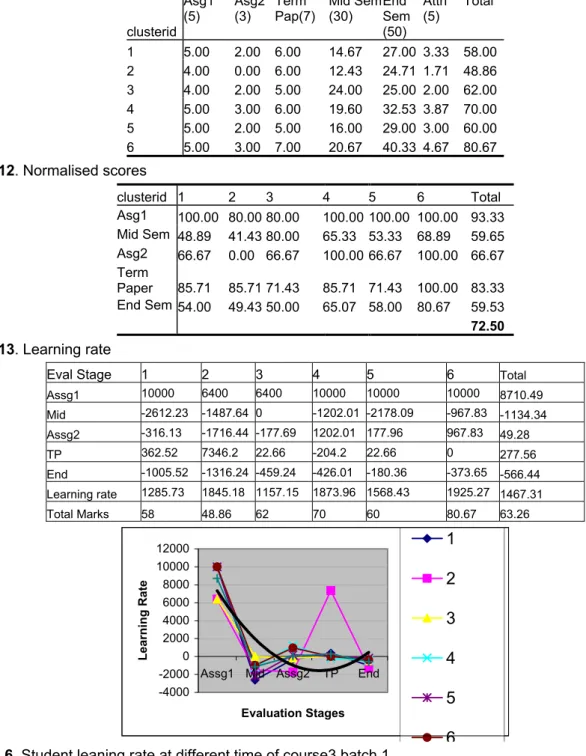
The third course (Course 3) for batch 1 was taken by 26 students. The evaluation process consists of two assignments, one term paper, mid-semester and end-semester examinations. The student clusters are shown in Table 11. Normalised scores for each cluster are shown in Table 12. The learning rate calculated from the normalised scores is shown in Table 13. The variation of learning rate at different time of the course is furnished in Fig. 6.
Table 11. Student clusters
clusterid Asg1 (5) Asg2 (3) Term Pap(7) Mid Sem (30) End Sem (50) Attn (5) Total
1 5.00 2.00 6.00 14.67 27.00 3.33 58.00 2 4.00 0.00 6.00 12.43 24.71 1.71 48.86 3 4.00 2.00 5.00 24.00 25.00 2.00 62.00 4 5.00 3.00 6.00 19.60 32.53 3.87 70.00 5 5.00 2.00 5.00 16.00 29.00 3.00 60.00 6 5.00 3.00 7.00 20.67 40.33 4.67 80.67 Table 12. Normalised scores
clusterid 1 2 3 4 5 6 Total
Asg1 100.00 80.00 80.00 100.00 100.00 100.00 93.33 Mid Sem 48.89 41.43 80.00 65.33 53.33 68.89 59.65 Asg2 66.67 0.00 66.67 100.00 66.67 100.00 66.67 Term
Paper 85.71 85.71 71.43 85.71 71.43 100.00 83.33 End Sem 54.00 49.43 50.00 65.07 58.00 80.67 59.53
72.50 Table 13. Learning rate
Eval Stage 1 2 3 4 5 6 Total
Assg1 10000 6400 6400 10000 10000 10000 8710.49 Mid -2612.23 -1487.64 0 -1202.01 -2178.09 -967.83 -1134.34 Assg2 -316.13 -1716.44 -177.69 1202.01 177.96 967.83 49.28
TP 362.52 7346.2 22.66 -204.2 22.66 0 277.56
End -1005.52 -1316.24 -459.24 -426.01 -180.36 -373.65 -566.44 Learning rate 1285.73 1845.18 1157.15 1873.96 1568.43 1925.27 1467.31
Total Marks 58 48.86 62 70 60 80.67 63.26
-4000 -2000 0 2000 4000 6000 8000 10000 12000
Assg1 Mid Assg2 TP End
Evaluation Stages L e a rn in g R a te 1 2 3 4 5 6 Figure 6. Student leaning rate at different time of course3 batch 1
Inference
̇ The steep fall after first assignment (refer Fig. 6) of all the curves show that the first assignment was too easy in comparison to other assignments and examinations.
̇ The learning rate of the student cluster, who got lowest marks (cluster 2), has a wavy nature (refer Fig. 6). The nature of the curve indicates that weaker students cannot cope well with the course.
̇ The trend line (refer Fig. 6) indicates the general nature of the course which is same as the previous example. The load of the course has increased up to the mid-session and then decreased again that results the U-shaped curve.
3.1.4 Test result for course 3 batch 2
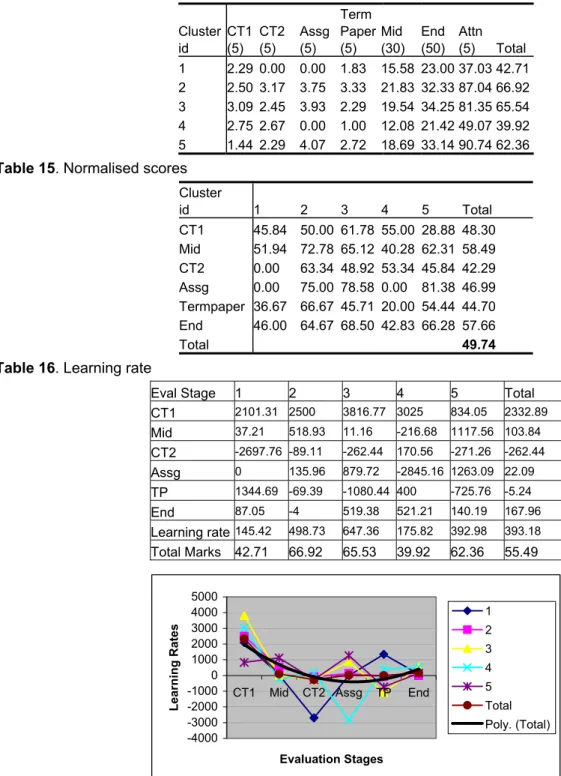
The third course (Course 3) for batch 2 was taken by 35 students. The evaluation process consists of one assignment, two class tests, one term paper, mid-semester and end-semester examinations. The student clusters are shown in Table 14. Normalised scores for each cluster are shown in Table 15. The learning rate calculated from the normalised scores is shown in Table 16. The variation of learning rate at different time of the course is furnished in Fig. 7.
Table 14. Student clusters Cluster id CT1 (5) CT2 (5) Assg (5) Term Paper (5) Mid (30) End (50) Attn (5) Total 1 2.29 0.00 0.00 1.83 15.58 23.00 37.03 42.71 2 2.50 3.17 3.75 3.33 21.83 32.33 87.04 66.92 3 3.09 2.45 3.93 2.29 19.54 34.25 81.35 65.54 4 2.75 2.67 0.00 1.00 12.08 21.42 49.07 39.92 5 1.44 2.29 4.07 2.72 18.69 33.14 90.74 62.36 Table 15. Normalised scores
Cluster
id 1 2 3 4 5 Total
CT1 45.84 50.00 61.78 55.00 28.88 48.30 Mid 51.94 72.78 65.12 40.28 62.31 58.49 CT2 0.00 63.34 48.92 53.34 45.84 42.29 Assg 0.00 75.00 78.58 0.00 81.38 46.99 Termpaper 36.67 66.67 45.71 20.00 54.44 44.70 End 46.00 64.67 68.50 42.83 66.28 57.66
Total 49.74
Table 16. Learning rate
Eval Stage 1 2 3 4 5 Total
CT1 2101.31 2500 3816.77 3025 834.05 2332.89 Mid 37.21 518.93 11.16 -216.68 1117.56 103.84 CT2 -2697.76 -89.11 -262.44 170.56 -271.26 -262.44 Assg 0 135.96 879.72 -2845.16 1263.09 22.09 TP 1344.69 -69.39 -1080.44 400 -725.76 -5.24 End 87.05 -4 519.38 521.21 140.19 167.96 Learning rate 145.42 498.73 647.36 175.82 392.98 393.18 Total Marks 42.71 66.92 65.53 39.92 62.36 55.49
-4000 -3000 -2000 -1000 0 1000 2000 3000 4000 5000
CT1 Mid CT2 Assg TP End
Evaluation Stages L e a rn in g R a te s 1 2 3 4 5 Total Poly. (Total)
Figure 7. Student leaning rate at different time of course3 batch 2 Inference
̇ As like batch 1, in case of batch 2 also we find wavy nature (refer Fig. 7) of learning rates for lagging students (cluster 1 and 4). The same result for both batches also proves the correctness of our method. ̇ The trend line (refer Fig. 7) shows the general nature of the course remains same as other courses. ̇ The average learning rate shows that batch 1 was better than batch 2 in terms of learning. The average
score scored by students of batch 1 (63.26) and batch 2 (55.49) also confirms the result. 3.2 Phase 2 - course comparison
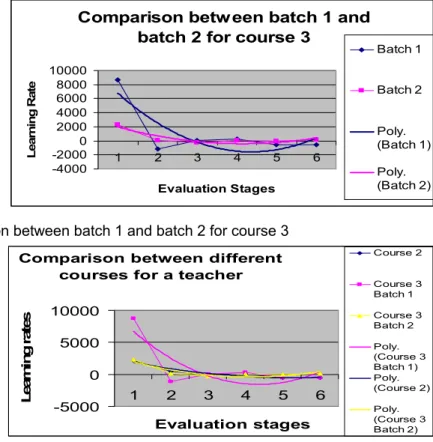
As per the request of the instructor of course 2 and course 3 we go for a comparative analysis of batch 1 and batch 2 for course 3 and also for a comparison of all the courses (i.e. course 2 and course 3 for two batches) taught by the teacher. The learning curves are shown in Fig. 8 and Fig. 9 respectively.
Comparison betw een batch 1 and batch 2 for course 3
-4000 -2000 0 2000 4000 6000 8000 10000
1 2 3 4 5 6
Evaluation Stages L e a rn in g R a te Batch 1 Batch 2 Poly. (Batch 1) Poly. (Batch 2) Figure 8. Comparison between batch 1 and batch 2 for course 3
Comparison between different courses for a teacher
-5000 0 5000 10000
1 2 3 4 5 6
Evaluation stages L e a rn in g r a te s Course 2 Course 3 Batch 1 Course 3 Batch 2 Poly. (Course 3 Batch 1) Poly. (Course 2) Poly. (Course 3 Batch 2) Figure 9. Comparison between different courses for a teacher
As shown in Fig. 8 the learning rate of batch 1 has decreased initially and then increased again. On the other hand for batch 2 the trend line remains near zero line throughout the course. It can be concluded that the subject matter for batch 1 presents something new to them. So their learning curve first decreases but after getting accustomed with the course it is increased again. However batch 2 does not get anything new to be added to their knowledge base from the course. Since the average marks of batch 2 (55.49) is less than that of batch 1(63.26) so it is obvious that the course material was not known to batch 2 before. So they cannot learn as like batch 1 due to either their lack of effort or due to the teaching technique. Now, when we compare all the three courses taught by the teacher we get some more insights into the teaching-learning situation. As shown in Fig. 9, the trend line for course 3 batch 1 is of U-shape, but the trend lines of course 2 and course 3 batch 2 both run near zero line. Since the trend line for two different batches and courses are almost same so according to our system, it is the teaching technique that should be changed for increasing the learning rate.
4. Conclusions
The present paper defines some performance metrics for student and teacher evaluation and also discusses the methodology for calculating those metrics. The information stored in the system will be expressive enough to efficiently measure the performance. The metrics are intended to provide a fully objective assessment strategy; not aimed to criticise individuals. Once measured properly for adequate length of time, the metrics and the stored information can also be used to find utility of a course modification, to compare performances of different institutions and for research on education techniques. The paper demonstrate a
case study for analysing four courses at a premier engineering institute, which, in spite of lack of data, has yielded encouraging results about the learning and teaching of the courses.
References
Alfonseca, D and P. Rodriguez 2004. Application of the BLEU method for evaluating free-text answers in an e-learning environment ,Paper presented at the Language Resources and Evaluation Conference (LREC-2004), Lisbon, Portugal, 26th – 28th May, 2004
Aspinwall K., Simkins T., Wilkinson J. F., McAuley M. J., 1992. Managing Evaluation in Education, London, UK: Routledge,
Benford S, Burke E and Foxley E 1993. Learning to construct quality software with the Ceilidh system. Software Quality Journal 2, pp.177-197
Biswas P., Ghosh S.K. 2005, An Universal Assessment Methodology for Evaluating Students' and Teachers' Performance in an Academic Institute, Proceedings of International Conference on Cognitive Systems (ICCS)’05,New Delhi, 14th-15th December’ 2005
Bodmann S. M. et. Al 2004. Speed and Performance differences among Computer-Based and Paper-Pencil Tests, Journal on Educational Computing Research, Vol 1(1), 2004 pp 51-60
Brusilovsky P, Schwarz E and Weber G 1996. ELM-ART: An intelligent tutoring system on World Wide Web. In: Frasson C, Gauthier G and Lesgold A (eds.) Intelligent Tutoring Systems. Lecture Notes in Computer Science, Vol. 1086 Springer Verlag, Berlin, pp. 261-269
Brusilovsky P. and Miller P. 2001. Course Delivery Systems for the Virtual University In: F. T. Tschang and T. Della Senta (eds.): Access to Knowledge: New Information Technologies and the Emergence of the Virtual University . Amsterdam: Elsevier Science and International Association of Universities, 2001, pp. 167-206
Burstein, J., C. Leacock,and R. Swartz, 2001. Automated evaluation of essay and short answers. In M. Danson (Ed.), Proceedings of the 6th Intl. Conf. Of Computer Assisted Assessment Conference.
Byrnes R, Debreceny R and Gilmour P 1995. The Development of a Multiple-Choice and True-False Testing
Environment on the Web. Ausweb95: The First Australian World-Wide Web Conference , Ballina, Australia, April 30 - May 2, 1995, [Accessed 13th February, 2006]. Available from World Wide Web: <
http://elmo.scu.edu.au/sponsored/ausweb/ausweb95/papers/education3/byrnes/>
Deale R. N. 1975. Assessment and Testing in the Secondary School, Schools Council Examinations Bulletin 32. Evans/Methuen Educational
Dietrich A , Cord H. , Wesiak G. 2001. Current Trends in eLearning based on Knowledge Space Theory and Cognitive Psychology [Accessed 12th March, 2006]. Available from World Wide Web: <www.research-it.at/
~ac18008a182527705af0348c10147878d887feb>
Edwards J.,1991. Evaluation in Adult and Further Education: A Practical Handbook for Teachers and Organisers , Liverpool. UK.: The Workers Educational Association
Foxley E, Benford S, Burke E and CEILLIDH Development Team 1998. WebCeilidh, University of Nottingham, [Accessed 8th February, 2006]. Available from World Wide Web: <http://www.cs.nott.ac.uk/~ceilidh >
Han J., Kamber R.2000. Data Mining: Concepts and Techniques, Morgan Kaufmann; 1st edition (August 2000) Harlen W., 1978. Evaluation and the Teacher’s Role, London UK: Macmillan Education
Ming, Y, A. Mikhailov, T. Lay Kuan, 2000. Intelligent Essay Marking System, In C. Cheers (Ed.), Learners Together Reddy K. et al, 2004.. On the Role of Electives on the Performance Evaluation in an Examination-A True Perspective,
The Indian Journal of Technical Education, Vol. 27 No. 4 October – December, 2004
Reddy K. et al.2004. On the Determination of Consistency in Ranking – A True Perspective through Analytic Hierarchy Process Approach, The Indian Journal of Technical Education, Vol. 27 No. 3July - September, 2004
Rehak D 1997. A database architecture for Web-based distance education. WebNet'97, World Conference of the WWW, Internet and Intranet , Toronto, Canada, November 1-5, 1997, pp. 418-425
Rios A, Pérez de la Cruz J L and Conejo R 1998. SIETTE: Intelligent evaluation system using tests for TeleEducation. Workshop WWW-Based Tutoring at 4th International Conference on Intelligent Tutoring Systems (ITS'98), San Antonio, TX, August 16-19, 1998, [Accessed 23rd February, 2006]. Available from World Wide Web: < http://www-aml.cs.umass.edu/~stern/webits/itsworkshop/rios.html>
Sapir M 1999. The WebTester and the Linear Algebra WebNotes. ALN Magazine 3 (1)
Twelve Rules That Define a Data Warehouse, [Accessed 8th September, 2005]. Available from World Wide Web: <www.stfx.ca/people/rmackinn/Cd%20W%20Dr%20June%202%2001/316/DWRULES.HTM>
VanLehn K. et. al.1997. Evaluation of an assessment system based on Bayesian Student Modeling International Journal of Artificial Intelligence in Education, Vol. 8, 1997, pp 179-221
Xiao G 1999. WIMS, Université de Nice, Sophia Antipolis, [Accessed 8th February, 2006]. Available from World Wide Web: <http://wims.unice.fr/~wims/wims.cgi?lang=en>
Initial Evaluation and Analysis of Post Graduate Trainees’
Use of a Virtual Learning Environment in Initial Teacher
Training
Alison Hramiak
Sheffield Hallam University [email protected]
Abstract: This paper describes the initial findings of a longitudinal case study that investigates the use of a virtual learning environment to enhance the placement experience for full time postgraduate certificate in education (PGCE) students. Geographically separated trainees can feel very isolated on placement. The purpose of the VLE was to try to alleviate this by offering a way for trainees to maintain contact and offer mutual support while on placement. A preliminary analysis of the results is used to offer some insight into how this type of support might be improved for future students, by the construction of minimum pedagogical framework for initial teacher training.
Keywords: Teacher training, Virtual learning environment, pedagogical framework
1. Introduction
This paper describes the initial findings and analysis of a longitudinal case study investigating the use of e-learning technology, specifically a virtual learning environment, (VLE) to enhance the training experience of trainees on the professional year post graduate certificate in education (PGCE). The purpose of the research is to try to determine if the trainee placement experience can be enhanced by using the communication and collaboration opportunities provided by the VLE to negate the geographical isolation of students. This paper reports the initial findings of the first year of the study, and recommends a minimum pedagogical framework for the implementation of VLEs in this type of teaching and learning.
2. Context and background for the research
The research is grounded in theories of networked collaborative learning, (de Laat and Lally, 2003; Jones, 2000) linked with socio constructivism (Dillenbourg, 1999; Kyriakicou, 1999; Vygotsky, 1978) and communities of practice (Wenger, 1998). It also builds on previous work done at Sheffield Hallam University which reported that whilst there was great potential in using the VLE as a mode of delivery, it also required a great deal of time and input from academic and technical staff (Angier, 2004). Previous research recommends that trainees have equal access to the shared electronic resources, and that a sense of community is created between the learners in the group, giving them opportunity to structure the online experience for themselves. Research that has explored the ‘connectedness’ of the trainees who engaged with the VLE for the purposes of study, reports that there is a heightened sense of feeling connected as part of a wider learning community (Thurston, 2005). The forming of the sense of community is deemed to be a necessary initial step in online collaborative learning (Wegerif, 1998). Other research has identified key issues of access to the technology and support for teachers, amongst others, as being important to the success of the use of communications technology for teaching and learning (Abbott et al., 2005). In other studies, research confirms that electronic conferencing can be used as a tool by which to enhance the learning and teaching of trainee teachers, but that its success depends on the nature interaction and level of collaboration among the participants (Kyriakicou, 1999).
Research done in Northern Ireland has some parallels with the work done here. This research reports that online discussion not only reduced the sense of loneliness often felt by trainee teachers when they are dispersed on teaching practice, but also helped to build a community of practice among them (Clarke, 2002). Evidence from Open University (OU) PGCE trainees suggests that extensive use of electronic networking systems can encourage collaboration and support and enhance practice (Selinger, 1997). Galanouli and Collins found that trainees used computer conferencing successfully without moderation by tutors (Galanouli and Collins, 2000). In the study described here, the tutor only participated in the discussion boards when required, for example, when asked to do so by other participants, or in order to encourage greater use of the system. In the Galanouli and Collins study, no
tutor had access to the system at all. The main aim of this study is to determine and implement, as an iterative process, a pedagogical framework for the use of information and communications technology, specifically, a VLE, on initial teacher training. The purpose of the study was to establish, over the course of a number of years, and through practitioner led research, a pedagogical framework that utilised e-learning technology, and which would enhance the placement experience for trainees.
3. Methodology and methods
The approach taken for the study is that of an evaluative, longitudinal case study, (Bassey, 1999; Yin, 1984) looking at how the VLE might be used iteratively, over a period of two to five years, to enhance the placement experience for trainee teachers. The methodology is that of practitioner led action research, with the tutor as participant and researcher. It engages with both context rich qualitative and quantitative data collection and analysis, searching for themes within and across a distinct number of data sets. This provides methodological triangulation to the study and thus adds rigour to any conclusions drawn (Cohen and Manion, 1994). Trainees start the one year Applied ICT PGCE in September of each academic year. During that time, the trainee spends approximately one third of their time at university, and two thirds of their time on two separate school placements. All the trainees in this study have a degree in information technology, (IT) and some also have either higher degrees and or work experience in this area also. All had access to a computer with internet facilities for the duration of the course. The VLE used for this research was Blackboard©, (BB) and a site was set up specifically for use by the Applied ICT PGCE trainees early on in the course (October). In addition to this, the trainees had received familiarisation sessions on the use of the VLE, and had also been given much group work in class, in order to get them working together as a learning community (Kyriakicou, 1999; Rovaii, 2001). The Blackboard© site was set up to provide trainees with the means of staying in touch with their peers while on placement in school. The wide area covered by the course meant that trainees were geographically isolated from each other while on placement. The site was set up to provide a place, (or space) albeit virtual, where they could swap ideas, raise questions, discuss issues and experiences, and so on, despite their physical separation from each other.
Consent was obtained from all participants prior to the start of the study. Over the course of the academic year, a total of six discussion boards were set up for use by the students. Some were set up for use as soon as the BB site was ready and accessible by the students, others were set up later in the course to reflect the needs of the trainees as they progressed on the course. While the trainees were on placement, a number of synchronous chat sessions were also set up. A record of the use of, and access to, the BB site was also obtained for the purposes of the study. An online survey, (accessible only from the BB site) was also completed by the students towards the end of their second placement (and academic year). The survey covered both their access to and usage of the BB site, and also their preferred learning styles. The survey included both open and closed questions, allowing for factual and narrative style responses. A group interview was also conducted with the trainees at the end of the course. This data was used to augment the data from the survey and the discussion boards. The interview was conducted for triangulation purposes, to clarify issues emerging from the other data sets. All the data sets were collated and analysed for themes within, and across them, and this is described in the following section.
4. Results and findings
This section describes the results for each of the different data sets obtained from the study, and also gives a comparative analysis of the data from all the data sets.
4.1 Discussion board data analysis
The following table, (Table 1) gives the usage and access results from the discussion board data from the BB site from October to June, with brief comments on the relation between the statistics and the activities on the course.
Table 1: Discussion board statistics for Applied ICT PGCE trainees 2004-2005 Totals for
Discussion
Boards Urgent TP1 TP2 Assignments Interviews Ebay
No Threads 14 20 12 7 4 3
No participants
(minus tutor) 4 9 3 4 4 0
Total No
messages 24 46 38 19 14 3
No tutor
messages 13 10 9 6 6 3
No tutor messages as
% 54 22 24 32 43 100
Access Up to
12 pm 10 7 7 5 6 0
Access 12-6
pm 7 14 15 7 5 3
Access 6 pm
to 12am 7 25 16 7 3 0
Start date db 07/10/2004 07/10/2004 07/01/2005 07/10/2004 10/03/2005 07/10/2004 First trainee
posting 19/10/2004 15/10/2004 03/02/2005 18/10/2004 10/03/2005 Last trainee
posting 16/11/2004 16/12/2004 08/03/2005 16/03/2005 24/03/2005
End date db 25/11/2004 07/01/2005 10/03/2005 22/03/2005 31/05/2005 08/03/2005
Nodays 29 62 33 149 14 n/a
Notes and comparison with course activities Not very useful. Superseded by email by tutor and students.
End of messages coincides with end of term on TP1.
Used from transition time in school to end of 10h timetable on TP1
Used from end of transition time in school to beginning of 3rd week of full time in school (on 15h timetable by this time) in TP2
Used from the 3rd week of transition time in school in TP1 to 4th week of full timetable (15h) in TP2.
Used in blocks in Oct/Jan/(2)mid March, which coincides with hand in dates for assignments, work on them in university, and hand in dates in April, respectively. Assignments were due in Very short usage – coincides with a flurry of activity in terms of job hunting and interviews and includes the Easter holidays. By end March, most had either got jobs or were getting interviews regularly.
Not used
As can be seen from the data in Table 1, there was low usage of the discussion boards throughout the duration of the course. The most used board was that for the first teaching placement (TP1). This had the most threads and messages but with a very small number of participants who were actually posting them. The data also shows that the tutor engaged significantly with most of the boards, (placing at least 20% of the messages on all boards) in order to respond to any questions set and to encourage further usage of them. The longest lasting board was that for the assignments, however, as the table shows , the trainee messaging finished six days before the end date of the board – this board was mainly used around assignment deadlines. Access times for placement boards show an increase in message posting throughout the day, other boards, however, show no real significant pattern between posting and time of day. The actual usage of the boards is so low that it is not reasonable to draw any firm conclusions from the data given in Table 1, other than to conclude that participation on the site was low, and that usage was restricted to a small number of participants. In Table 2, the access statistics over time, for the second block placement, for each of the discussion boards, (detailing the number of hits per board per month) is given. All figures include the tutor’s hits, as the tutor was deemed to be part of the on line group. Figures are rounded up to the nearest number with percentages in parenthesis.
Table 2: Access statistics for applied ICT PGCE BB site march to June 2005
No Stude nts
Total
Hits DBoard Announce Content Email Staff
Info Comms Collab March
(to
10.3.05) 13 1274 870 (68) 203 (16) 150 (12) 22 (2) 8 (1) 17 (1) 4 (0.3) April 12 403 268 (67) 83 (21) 45 (11) 3 (1) 3 (1) 1 (0.2) May 11 487 224 (46) 128 (26) 76 (16) 15 (3)
10
(2) 8 (2) 6 (1) June 11 79 24 (30) 27 (34) 14 (18) 6 (8) 3 (4) 3 (4) 2 (3) As can be seen from the data in Table 2, the total number of hits tails off as trainees enter the final phase of the course and move to full timetables in placement two around the end of March, beginning of April. The visits and hits for the month of June coincide with the days when trainees attended university. The number of trainees on the course remains fairly constant, only dropping by two from March to June, BB site usage drops off significantly over those months, particularly at the very end of the course when trainees have completed their second placement at the end of May.
4.2 4.2 Synchronous chat sessions
The synchronous chat sessions were conducted in November and December as previously stated. The 16th November session (approximately half way through the first placement) was set up for 6pm and ran for an hour. A total of four trainees participated, three male and one female. The second chat session was set up for 16th December at 6.30 pm, to 7.30 pm (a later time than for the previous session at the request of the students. This session was terminated early because of technical difficulties wit the BB site that prevented access to the ‘chat room’ for some participants. The archive from the November session is summarised below:
Table 3: Summary of the synchronous chat session 16th November 2004 1. Overall feel of the session 2. Discussion topics covered Very informal. Language was friendly, often
humorous, and questions were open, how, what, tell us more, can I check…? and so on. Trainees always asked about each other’s well being when they joined. Closed questions were used only when clarification of a point was required.
The discussion remained very friendly and informal throughout the session independent of who joined later in the session.
Placement visits and arrangements.
Teaching observations and teaching practice. Assignments, and help with them.
Use of BB.
Contact with other students. Lessons and lesson plans. The use of Plan B in lessons. ICT and other problems in lessons.
The levels of work and pupils being taught on teaching practice.
GCSE and Key Skills questions preparation. The difference in ability between pupils in the various schools.
How to engage pupils, ideas for the practicalities of this, using PowerPoint, electronic
whiteboards, and online options. Length of teaching sessions. Some personal questions.
Different ideas of how to get pupils to present work, the problems, solutions, ideas, shared experiences, starter activities, different ideas for lessons, and the activities in them, use of internet resources, group work.
There were problems with the messaging due to the time delay between answers to any given question. This made the messaging appear disjointed and unsynchronised, particularly when an answer to one question would appear after other questions had been asked. The time delay affected the flow of text to such an extent at times that it was difficult to facilitate the discussion between the trainees and between the trainees and the tutor. When asked if they had found the session useful, there were a number of positive responses from the students:
“[…] better than nothing but I do prefer face to face” “ but at least it is a form of real time communication” “ yeah some good ideas”
“ yes [tutor’s name] definitely useful” 4.3 Group interview
A group interview was conducted with the trainees at the end of the course. The whole PGCE cohort, (a total of 11 trainees) participated, 10 male and one female. A summary of what was said is given in Table 4.
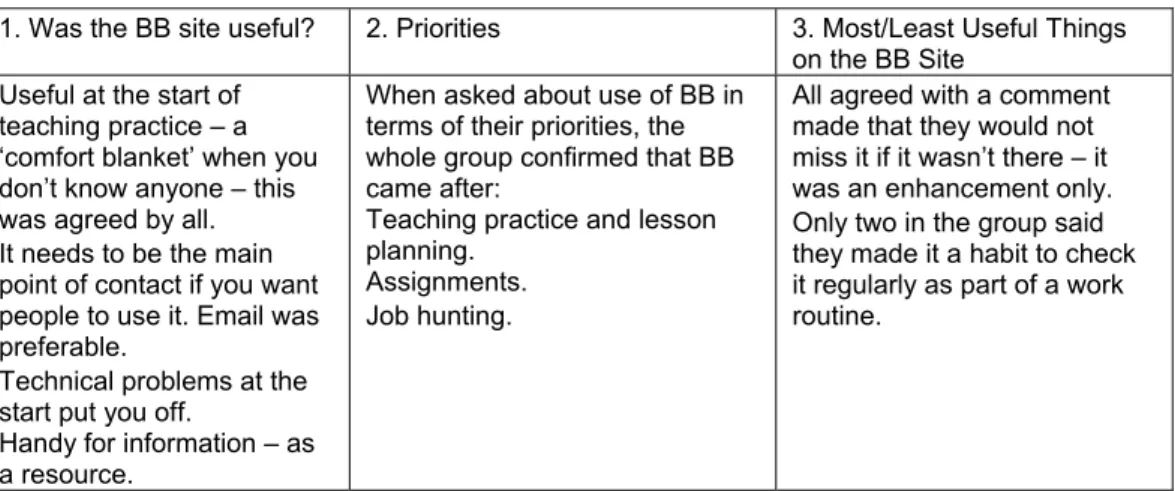
Table 4: Summary of responses from the group interview
1. Was the BB site useful? 2. Priorities 3. Most/Least Useful Things on the BB Site
Useful at the start of teaching practice – a ‘comfort blanket’ when you don’t know anyone – this was agreed by all. It needs to be the main point of contact if you want people to use it. Email was preferable.
Technical problems at the start put you off.
Handy for information – as a resource.
When asked about use of BB in terms of their priorities, the whole group confirmed that BB came after:
Teaching practice and lesson planning.
Assignments. Job hunting.
All agreed with a comment made that they would not miss it if it wasn’t there – it was an enhancement only. Only two in the group said they made it a habit to check it regularly as part of a work routine.
Some trainees found the documents on the site useful, and some found the discussions useful, but, ‘only if they got going’. Trainees also mentioned problems with technical issues and familiarisation as being issues for non participation.
5. Preliminary comparative analysis of data
It is beyond the scope of this paper to fully document the data from the online survey (questionnaire) used in this study. A summary of this data, however, is given in Table 5 for comparison with the other data sets.
Table 5: Summary of all data set findings
Data Set Summary of findings
Discussion boards TP1 discussion board was the most used, followed by TP2, Assignments, Urgent and Interviews. TP1 had the most participants the other discussion boards had similar lower numbers of participants.
Synchronous chat session
Low participation rate. Very friendly and informal. Lots of topics covered. Very practical help offered. All participants found it useful.
Access to BB site statistics
Decrease in overall activity from March to June. Discussion boards were the most used feature on the site. Db and email usage decreased from March to June. Announcements and contents remained mixed (up and down). Access data for site shows no discernable pattern.
Questionnaire Low time spent by trainees per week on BB. Mostly accessed for reading.
60% of the group made regular contributions. No real difference in use on/off placement or between TP1 and TP2. 80% of the group happy/satisfied about amount read and contributions of tutor. Trainees were less than happy with the level of their own contributions.
60% of the group said it enhanced their ITT but that the discussion boards were dominated by a few.
Ideas for improvement and use of site were given. Trainees said that the use of email as communication far outweighs BB.
Learning styles indicated are those of a preference for learning with and from others, interactions with others were given as important (except family). They like to participate, discuss, reflect and learn with and from others.
Group Interview All agreed that BB was a low priority and a comfort blanket at the start of TP1 only.
BB needs to be available from the start of the course, and to be the main point of contact to increase usage and thus to make the discussion boards useful.
A comparison of all the data sets, given in Table 5 shows that the low participation rates observed for the BB site and the synchronous chat session, are supported by the responses to the questionnaire and the group interview. Low participation rates are also reflected in the interview comments and questionnaire returns, which show that the discussion boards are dominated by a few participants, and that the trainees preferred to use email rather than the discussion boards to maintain contact with each other. The trainees indicate, in their responses to the learning styles part of the questionnaire, a preference for socio-constructivist type learning. That is, learning through interaction with others. The responses showed a preference for participation, discussion, and reflection with each other. The comments made at the group interview support this data, and also give some indications for improvement of the use of the VLE for future groups. These are discussed in detail in the following section. This preference for interaction with others as a way to learn on the course is something, however, that is not reflected in the use of the BB site. This preference for socio-constructivist type learning may be something that may not be transferable from face to face to online situations, as indicated by the low participation rates.
6. Discussion and Analysis
In this section of the paper it is intended to present ideas on what the findings of the study might mean, and also what they offer in terms of recommendations for future work in this area. Data from the study indicates that the VLE was, at best:
̇ An enhancement only.
̇ Useful for information but not really used significantly as an interactive and collaborative tool. ̇ A comfort blanket at the start of placement only.
̇ A low priority.
As with other studies, (Galanouli and Collins, 2000) this study found that the frequency of communication falls off during school placement, though not due to network access, more because of the reasons stated above. Earlier research has recognised that tutors also need time to prepare the resources and structure the VLE, and to maintain the site throughout the academic year (Angier, 2004). In this study, there was a lot of work done by the tutor, for not very much in return in terms of benefits to students - according to the data collected from them. A balance is required of time spent by tutor against benefits to students, and it may be more appropriate to look at alternatives to running and interactive VLE for ITT, even if this means going against the tide of pressure to use interactive, collaborative, electronic resources across all education sectors (DfES, 2005). Trainees on such an intensive course as ITT need to make rational workable decisions about what to spend their time on, and how to prioritise tasks. In doing so, they tend to look to where they will get the most benefit for the least effort, because their time is both very precious and very limited. There may have been consequences of these particular groups of trainees having already got an IT degree. for example, one reason for their lack of participation may be that they already have well established means of working with technology for communications and were not prepared to change in the light of other pressures on this course. There is still much to be learnt about the way trainee teachers perceive the benefits of using e-learning tools while on placement. It is also a recognised that we need to focus on how best to use the technology available to us, how to use it sensibly and why, (Williams, 2003). For some the cost of time is a prohibitive factor when so many other pressures challenge their daily routines. Given the intense pressures of the course, trainees may have chosen to use email over BB as their preferred method for communications with their peers, particularly when time constraints were so restricted. Other research has also shown that students do not always use the online learning environment in all the ways that might have been intended, or indeed in the most effective ways, and has also indicated what steps can be taken to ensure that student use is as effective as possible (Beasley and Smith, 2004). Other software, such as HICOM, enables trainees to participate in discussion boards via email, and this may have affected the results found in this research. This
facility, however, is not yet available with BB. As such, it is difficult to tell, at this stage, whether the low participation of the group as a whole, is an effect of the nature of this specific group, or linked to more general phenomena, such as the tendency of small numbers of participants to dominate the discussion boards. Analysis of data from subsequent cohorts will enable this particular theme to be investigated further. From the results of this study a minimum pedagogical framework is proposed as a way forward to improving the use of online learning environments on courses such as this.
6.1 A minimum pedagogical framework for the implementation of VLEs in teacher training
From the analysis of the initial findings of this study, a pedagogical framework for the implementation of VLEs for ITT is as proposed as follows:
Figure 1: A pedagogical framework for the use of VLEs in initial teacher training ̇ Ensure that trainees have access to the site and are familiar with it.
̇ Engender/encourage the trainees to become a face to face learning community prior to the geographical separation of placement, including the use of peer to peer assessment, and also using collaborative exercises to build their confidence in, and respect for each other. Embed the use of the site in the face-to-face sessions to model good practice, for example, using the site to access course information and link to other useful sites.
̇ Make the site the focus of communications on the course – give them a need for it. ̇ Provide online peer to peer collaboration exercises that can only be done via the VLE.
̇ A critical mass of active participants – pivotal to the success of this type of online learning and participation.