Lucrări ştiinţifice Zootehnie şi Biotehnologii, vol. 40(2), (2007), Timişoara
RESEARCH CONCERNING ECONOMIC EFFICIENCY IN
MILK PROCESSING
CERCETĂRI PRIVIND EFICIENŢA ECONOMICĂ IN
PROCESAREA LAPTELUI
POPESCU AGATHA*
*University of Agricultural Sciences and Veterinary Medicine, Bucharest, Romania
The paper presents a study case concerning economic efficiency of dairy products at Agro Industrial Milk Processing Company Baneasa , Bucharest . The most effective dairy products are pressed cheese, green cheese, superior cow cheese, sheep cottage cheese, fresh cow cheese and whip cream. Production cost varies according to processing technology, specific consumption, price of raw materials, auxiliary materials, labor, energy, water. The company registered the highest profit Euro 18,421 and the highest profit rate 15.32 % in the year 2004. The continuous increase of inputs and manufacturing costs has a deep impact on efficiency.
Key words: economic efficiency, milk processing, Agroindustriala Milk Processing Company Baneasa, Bucharest
Introduction
Economic efficiency in milk processing depends on various factors such as: quality of milk as raw material, technical endowment, the applied technologies, production structure and specific consumption, resource management, dairy product marketing (1,2). Profitability at dairy company level is deeply influenced by economic efficiency at product level, which, in its turn, depends on sale price and production cost difference. The higher the price and lower the cost, the higher profit and profit rate (1, 2, 3).
This study presents the situation of economic efficiency both at product but also at company level using as example the performance in milk processing achieved by Agroindustrial Company Baneasa, one of the most important milk and dairy products suppliers for the market of the capital (4).
Material and methods
Results and Discussions
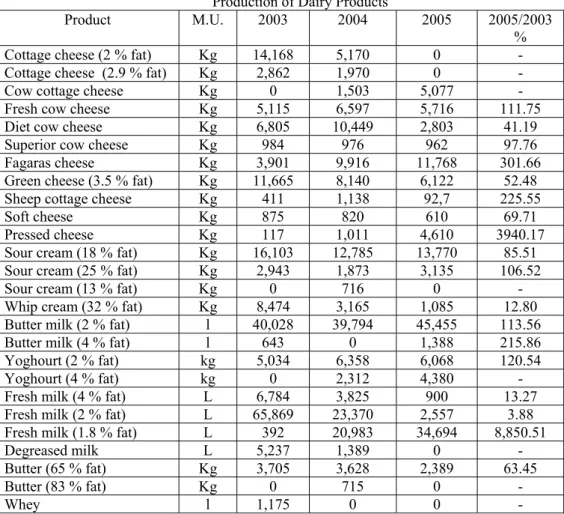
The firm production is represented by a large variety of dairy products,
whose evolution from a year to another in the period 2003-2005 is shown in Table 1.
Table 1 Production of Dairy Products
Product M.U. 2003 2004 2005 2005/2003
% Cottage cheese (2 % fat) Kg 14,168 5,170 0 - Cottage cheese (2.9 % fat) Kg 2,862 1,970 0 -
Cow cottage cheese Kg 0 1,503 5,077 -
Fresh cow cheese Kg 5,115 6,597 5,716 111.75
Diet cow cheese Kg 6,805 10,449 2,803 41.19
Superior cow cheese Kg 984 976 962 97.76
Fagaras cheese Kg 3,901 9,916 11,768 301.66
Green cheese (3.5 % fat) Kg 11,665 8,140 6,122 52.48 Sheep cottage cheese Kg 411 1,138 92,7 225.55
Soft cheese Kg 875 820 610 69.71
Pressed cheese Kg 117 1,011 4,610 3940.17
Sour cream (18 % fat) Kg 16,103 12,785 13,770 85.51 Sour cream (25 % fat) Kg 2,943 1,873 3,135 106.52
Sour cream (13 % fat) Kg 0 716 0 -
Whip cream (32 % fat) Kg 8,474 3,165 1,085 12.80 Butter milk (2 % fat) l 40,028 39,794 45,455 113.56
Butter milk (4 % fat) l 643 0 1,388 215.86
Yoghourt (2 % fat) kg 5,034 6,358 6,068 120.54
Yoghourt (4 % fat) kg 0 2,312 4,380 -
Fresh milk (4 % fat) L 6,784 3,825 900 13.27 Fresh milk (2 % fat) L 65,869 23,370 2,557 3.88 Fresh milk (1.8 % fat) L 392 20,983 34,694 8,850.51
Degreased milk L 5,237 1,389 0 -
Butter (65 % fat) Kg 3,705 3,628 2,389 63.45
Butter (83 % fat) Kg 0 715 0 -
Whey l 1,175 0 0 -
with 3.5 % fat (by 47.52 %), soft cheese (by 30.29 %), butter with 65 % fat (by 26.55 %), sour cream with 25 % fat (by 14.49 %). This is due to two factors: consumer preference for lower fat content dairy products and the increased production costs mainly related to raw materials and auxiliary materials, energy and water tariffs.
The average Cost, price and profit for the most important dairy products are
presented in Table 2.
Table 2 Annual Average Cost, Price and Profit for some Dairy Products
Euro/MU Product C P2003 Pr C 2004P Pr C 2005 P Pr
Cottage cheese (24
% fat) 1.13 1.30 0.07 1.38 1.59 0.21 - - -
Cottage cheese (2.9
% fat) 1.26 1.46 0.20 1.53 1.77 0.24 - - -
Fresh cow cheese 1.02 1.13 0.11 1.18 1.30 0.12 1.40 4.56 0.16
Diet cow cheese 0.87 0.97 0.10 0.94 1.05 0.11 1.19 1.32 0.13
Superior cow
cheese 1.16 1.28 0.12 1.46 1.62 0.16 1.76 1.96 0.20 Fagaras cheese 1.10 1.21 0.11 1.23 1.35 0.12 1.43 1.57 0.14 Green cheese
(3.5 % fat) 1.67 1.84 0.17 1.99 2.19 0.20 2.35 2.58 0.23 Sheep cottage
cheese 1.41 1.55 0.14 1.62 1.78 0.16 1.83 2.02 0.19 Pressed cheese 2.58 2.89 0.31 2.54 2.84 0.30 2.78 3.11 0.33 Sour cream
(18 % fat) 0.88 0.98 0.10 1.13 1.23 0.10 1.23 1.35 0.12 Sour cream
(25 % fat) 1.16 1.29 0.13 1.51 1.68 0.17 1.58 1.75 0.17 Whip cream
(32 % fat) 1.11 1.22 0.11 1.28 1.41 0.13 1.57 1.73 0.16 Butter milk 2 % 0.37 0.41 0.04 0.46 0.51 0.05 0.49 0.54 0.05 Butter milk 4 % 0.32 0.35 0.03 0.39 0.43 0.04 0.49 0.54 0.05 Yoghourt (2 % fat) 0.53 0.59 0.06 0.66 0.72 0.06 0.72 0.80 0.08 Fresh milk (4 % fat) 0.30 0.33 0.03 0.40 0.44 0.004 0.43 0.48 0.05
C= average production cost; P – average sale price; Pr-profit
In the year 2005, the highest dairy products are: pressed cheese (Euro 2.78/kg), green cheese with 3.5 % fat (Euro 2.35/kg), sheep cottage cheese (Euro 1.83/kg), superior cow cheese (Euro 1.76/kg) and the lowest costing products are: fresh milk with 4 % fat (Euro 0.43/l) and butter milk (Euro 0.48-0.49/l).
The cost level is deeply influenced by specific consumption and raw material price. Milk quality, sometimes does not fit to the EU requirements, a reason as the milk processing company to refuse milk collection or to reduce price to around Euro 0.23-0.25/l. The specific consumption for producing the most important dairy products is the following one: pasteurised milk and butter milk with 4 % fat (1.005 l milk with 4 % fat), sour cream 25 % fat (1.004 kg sour cream with 25 % fat), sour cream 18 % fat (1.004 kg sour cream 18 % fat), fresh cow cheese (6.500 l milk, 1.6 % fat), diet cow cheese (7.650 l milk 0.1 % fat), cow cottage cheese (7.200 l milk, 2.9 % fat), green cheese 3.5 % fat (7.400 l milk, 3.5 % fat), yoghourt 4 % fat (1.100 l milk 4 % fat), butter milk 2 % fat (1.005 l milk 2 % fat), sheep cottage cheese (4.250 l milk , 6.6 % fat).The price varies from a product to another ranking between Euro 0.48/M.U. incase of fresh milk with 4 % fat and Euro 3.11 in case of pressed cheese.
Taking into account profit/M.U., the most effective dairy products are: pressed cheese (Euro 0.33), green cheese (Euro 0.23), superior cow cheese (Euro 0.20), sheep cottage cheese (Euro 0.19), fresh cow cheese (Euro 0.16), whip cream with 32 % fat (Euro 0.16).
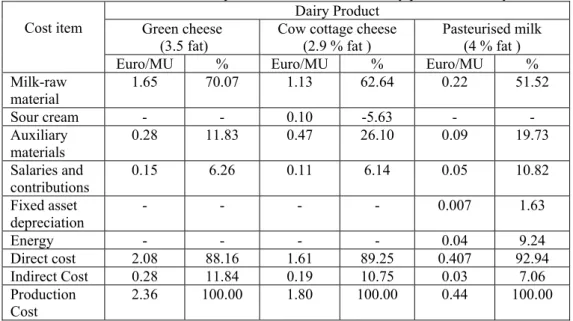
The calculation and structure of production cost for three dairy products
is presented in Table 3. In case of green cheese (3.5 % fat), the cost consists of 70.07 % raw materials, 11.83 % auxiliary materials, 6.26 % salaries, totalizing 88.16 % direct costs. In case of cottage cheese, direct cost represents 89.25 % of total cost, of which: 62.64 % raw materials, 26.10 % auxiliary materials, 6.14 % salaries. In case of pasteurized milk, direct cost is 92.94 % of total cost, but raw materials represents 51.52 %, auxiliary materials 19.73 %, salaries 10.82 %, energy consumption 9.24 % and 1.63 depreciation.
The Costs, Incomes and Profit at company level are shown in Table 4.The
Table 3 Calculation and structure of production cost for three dairy products in the year 2005
Cost item Green cheese Dairy Product
(3.5 fat) Cow cottage cheese (2.9 % fat ) Pasteurised milk (4 % fat ) Euro/MU % Euro/MU % Euro/MU % Milk-raw
material 1.65 70.07 1.13 62.64 0.22 51.52
Sour cream - - 0.10 -5.63 - -
Auxiliary
materials 0.28 11.83 0.47 26.10 0.09 19.73
Salaries and contributions
0.15 6.26 0.11 6.14 0.05 10.82
Fixed asset
depreciation - - - - 0.007 1.63
Energy - - - - 0.04 9.24
Direct cost 2.08 88.16 1.61 89.25 0.407 92.94
Indirect Cost 0.28 11.84 0.19 10.75 0.03 7.06
Production
Cost 2.36 100.00 1.80 100.00 0.44 100.00
Table 4 Costs, Incomes and Profit at dairy company level
Specification 2003 2004 2005 2005/2003 %
Incomes 125,374 138,599 144,775 115.48
Costs 112,111 120,178 134,599 120.05
Profit 13,263 18,421 10.176 76.92
Profit rate (%) 11.83 15.32 7.56 63.90
Conclusions
1. This study shows that in case of Agroindustrial Milk Processing Company Băneasa, the most effective dairy products are , in range, the following ones : pressed cheese ( Euro 0.33 profit /kg), green cheese (Euro 0.23 profit/kg) , superior cow cheese ( Euro 0.20 profit/kg), sheep cottage cheese ( Euro 0.19 profit/kg) , fresh cow cheese ( Euro 0.16 profit/kg) and whip cream ( Euro 0.16 profit/kg) .
2. The company registered the highest profit Euro 18,421 and the highest profit rate 15.32 % in the year 2004.
materials, 26.10 % auxiliary materials, 6.14 % salaries. In case of pasteurized milk, direct cost is 92.94 % of total cost, but raw materials represents 51.52 %, auxiliary materials 19.73 %, salaries 10.82 %, energy consumption 9.24 % and 1.63 depreciation.
4. For increasing profit and profit rate, the company has to pay attention to the following aspects: keeping cost under control in close relationship with resource management, production diversification and orientation mainly to those dairy products creating more value added, increasing dairy products quality and looking for clients which are able to offer a better price.
Bibliography
1. Apostu, D. (1994) – Calculation of economic efficiency in Food
Industry, Galatzi University.
2. Czoesz, I. (1997) – Economy of AgroFood Enterprises, Agroprint
Publishing House, Timişoara.
3. Popescu Agatha (2001) –Accounting and Financial Analysis in Food
Industry, Dominor Publishing House, Bucharest.
4. * * * - Agroindustrial Milk Processing Company Baneasa. Production
Records and Financial Statement, 2003-2005.
CERCETĂRI PRIVIND EFICIENŢA ECONOMICĂ IN
PROCESAREA LAPTELUI
POPESCU AGATHA*
*University of Agricultural Sciences and Veterinary Medicine, Bucharest, Romania
Lucrarea prezintă un studiu de caz privind eficienţa economică a produselor lactate la Societatea Agroindustrială de Procesare a laptelui Băneas, Bucuresti.. Cele mai rentabile produse sunt caşcavalul, caşul, brânza superioară de vaci, telemeaua de oaie, brânza proaspătă de vacă şi frişca. Costul de producţie variază în funcţie de tehnologia de procesare, consumul specific, preţul materiilor prime, materialelor auxiliare, cheltuielile cu forţa de muncă, energia şi apa. Firma a înregistrat cel mai ridicat profit, 18.421 Euro, şi cea mai înaltă rată a profitului (15,32 %) în anul 2004. Creşterea continuă a cheltuielilor aferente inputurilor şi de fabricaţie are un impact puternic asupra eficienţei economice.