Lucrări ştiinŃifice Zootehnie şi Biotehnologii, vol. 41(2) (2008), Timişoara
STUDIES ON SOME MORPHOLOGICAL CHARACTERS IN
BIGHEAD CARP FRY
STUDII PRIVIND UNELE CARACTERE MORFOLOGICE
LA PUIETUL DE NOVAC
CIORNEA ELENA *, VASILE GABRIELA *, MISĂILĂ C. *, MISĂILĂ ELENA RADA **
*Faculty of Biology, „Alexandru Ioan Cuza” University, Iaşi, România **S.C.D.A.E.A., Iaşi, România
The present paper investigates some morphological characters (total length, standard bodily length, head length, maxim height and bodily circumference) in representatives of bighead carp (Aristichthys nobilis) occurring in their first growing summer. Biometric analyses were performed on 100 individuals, in the end the morphological characters under investigations being statistically processed. Explanation of the experimental results evidences low values of the standard error of the mean, which is indicative of a grouping of all external bodily variables under investigation close to the average value.
Key words: morphological characters, biometry, bighead carp
Introduction
The controlled growing of fish is an old work, yet still highly actual, if considering that the problem of food for the perpetually increasing population of the globe is still not solved, while 3/4
th
of the surface of the Terra is covered by water (Grozea and Bura, 2002).
Bighead carp (species which prevailingly consume zooplankton) makes part from the category of Asian cyprinids of culture what was acclimatized in our country by reason of fact that these turn to good account the reserve of food from the piscine basins that the indigene fishes do not consume them (Manea, 1985).
Materials and Methods
All obtained result due the biometric study were statistically analyzed, being calculated the media, the standard error, the standard deviation, median, mode, range, the mean and precision coefficient variation, as well as lower and upper limits of the confidence intervals in which oscillates each corporal character in part (Dragomirescu, 1998; Gomoiu and Skolka, 2001; Varvara et al., 2001).
Results and Discussions
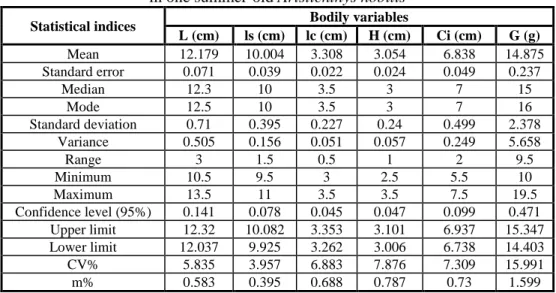
In one summer-old Aristichthys nobilis individuals higher values of the main statistical indices (variance, the standard deviation, the mean standard error) were registered in the case of total length, standard bodily length, weight and bodily circumference. The eldest coefficient of variation (15.991%) remarked in the case of bodily weight average, while standard bodily length average has the lowest coefficient of variation (3.957%). The maximum threshold of weight gained in this developmental stage is of 19.5 g (table 1).
Table 1 Values of the main statistical indices of bodily variables
in one summer-old Aristichthys nobilis
Statistical indices Bodily variables
L (cm) ls (cm) lc (cm) H (cm) Ci (cm) G (g)
Mean 12.179 10.004 3.308 3.054 6.838 14.875 Standard error 0.071 0.039 0.022 0.024 0.049 0.237
Median 12.3 10 3.5 3 7 15
Mode 12.5 10 3.5 3 7 16
Standard deviation 0.71 0.395 0.227 0.24 0.499 2.378 Variance 0.505 0.156 0.051 0.057 0.249 5.658
Range 3 1.5 0.5 1 2 9.5
Minimum 10.5 9.5 3 2.5 5.5 10
Maximum 13.5 11 3.5 3.5 7.5 19.5
Confidence level (95%) 0.141 0.078 0.045 0.047 0.099 0.471 Upper limit 12.32 10.082 3.353 3.101 6.937 15.347 Lower limit 12.037 9.925 3.262 3.006 6.738 14.403
CV% 5.835 3.957 6.883 7.876 7.309 15.991
m% 0.583 0.395 0.688 0.787 0.73 1.599
L = total length, ls = standard length, lc = head length, H = maximum bodily height, Ci = circumference, G = weight, CV% = mean variation coefficient,
m% = mean precision coefficient
cm, the height average between 3.006 - 3.101 cm, the average of circumference between 6.738 - 6.937 cm, and the average of weight between 14.403 - 15.347 g (fig. 1).
0 2 4 6 8 10 12 14
L ls lc H Ci
Analyzed bodily variable
c
m
Fig.1. Confidence intervals of the external bodily variables in one summer-old
Aristichthys nobilis
Another objective of the morphological characters analysis in the analyzed individuals was to establish the correlation and regression relations between a series of bodily characters. Thus, for each coupled of variables the Pearson index of parametric correlation was first calculated, after which its significance was tested. The calculated t values were compared with those of the critical t (α = 0.05, n-2) = 2.048. The null (no correlation present) and the alternative (correlation present) hypotheses have been established and, on the basis of the t critical t calculated comparison, one of the two hypotheses was accepted. There followed plotting of the regression straight line and of the regression equation of the straight line, after which the regression coefficient was determined - i.e., the extent to which some variable may determine the increase of the other one, as well as the coefficient (factor) of determination (R2), which expresses the percent ratio to which the values of a dependent variable are determined by the other independent variable, and the reciprocal situation (Simionescu, 1983).
In one summer-old Aristichthys nobilis individuals was registered positive correlations between all couples of characters taken into study, of each date the value of t calculated being elder than one of t critic.
The strongest correlation was evidenced between standard length and the bodily weight (r = 0.763), on last places being the correlations among standard length and the bodily height, standard length and head length and, finally, the one among standard length and the bodily circumference (r = 0.363).
According with the regression coefficients calculated for standard length and head length is noticed that:
The coefficient of determination (R2) express the fact that just in 17.06% from cases the values taken of dependent variable (in our case head length) are determinate of the free variable values (standard bodily length) (fig. 2).
y = 0.2376x + 9.3129 R2 = 0.1706
0 0.5 1 1.5 2 2.5 3 3.5 4
0 2 4 6 8 10 12
Standard length (cm)
H
e
a
d
l
e
n
g
th
(
c
m
)
Fig.2. Graphical representation of the regression between standard bodily length and head length in one summer-old Aristichthys nobilis
As to the regression among standard length and bodily weight, the factor of determination notices that the values taken of two variables are reciprocally determinate in just 58.23% from cases (fig. 3).
y = 4.5849x - 30.992 R2 = 0.5823 0
5 10 15 20 25
0 2 4 6 8 10 12
Standard length (cm)
W
e
ig
h
t
(g
)
Fig.3. Graphical representation of the regression between standard length and bodily weight in one summer-old Aristichthys nobilis
The coefficients values of regression calculated express the fact that: to scale up by 1 cm of standard length, bodily weight scales up by 4.5 g; to scale up by 1 g of bodily weight, standard length scales up by 0.1 cm.
Between standard length and bodily height were established a value of the Pearson index of correlation of 0.418 and the coefficients of regression calculate established that:
to scale up by 1 cm of height, standard bodily length scales up by 0.689 cm. The factor of determination estimated that the values taken of two variables are determinate each other in just 17.54% from cases (fig. 4).
y = 0.2544x + 0.5086 R2 = 0.1754
0 0.5 1 1.5 2 2.5 3 3.5 4
0 2 4 6 8 10 12
Standard length (cm)
H
e
ig
h
t
(c
m
)
Fig.4. Graphical representation of the regression between standard length and bodily height in one summer-old Aristichthys nobilis
In one summer-old Aristichthys nobilis individuals the lowest coefficient of correlation was registered between standard length and the bodily circumference (r = 0.363), the values taken of two characters being explicate in just 13.19% from cases (fig. 5).
y = 0.4585x + 2.2514 R2 = 0.1319
0 1 2 3 4 5 6 7 8
0 2 4 6 8 10 12
Standard length (cm)
C
irc
u
m
fe
re
n
c
e
(
c
m
)
Fig.5. Graphical representation of the regression between standard length and bodily circumference in one summer-old Aristichthys nobilis
According with the factors values of determination, we can assert that: to scale up by 1 cm of standard length, bodily circumference scales up by 0.458 cm;
In the case of this correlation the coefficients of regression calculated notice that:
to scale up by 1 cm of height, bodily circumference scales up by 1.121 cm; to scale up by 1 cm of circumference, bodily height scales up by 0.259 cm.
y = 1.1216x + 3.4127 R2 = 0.2913
0 1 2 3 4 5 6 7 8
0 0.5 1 1.5 2 2.5 3 3.5 4
Height (cm)
C
ir
c
u
m
fe
re
n
c
e
(
c
m
)
Fig.6. Graphical representation of the regression between height and bodily circumference in one summer-old Aristichthys nobilis
The coefficient of correlation value between the circumference and the bodily weight is 0.615, this bindery type being available in just 37.91% from cases (fig. 7).
y = 2.93x - 5.1603 R2 = 0.3791
0 5 10 15 20 25
0 1 2 3 4 5 6 7 8
Circumference (cm)
W
e
ig
h
t
(g
)
Fig.7. Graphical representation of the regression between circumference and bodily weight in one summer-old Aristichthys nobilis
According with the coefficients of regression calculated for two variables we can mention that:
Conclusions
The statistical explanation of obtained results from the biometric determination reveals a uniformity of the individuals from the population taken into consideration, the values of the main statistical indices being close to the average value.
Comparisons analyze between diverse couples of morphological characters (standard length in report with head length, the bodily weight, total length, height and bodily circumference, as well as height in report with bodily circumference, respectively, circumference in report with the bodily weight) in the fry bighead carp evidences existence of a positive correlations between all bodily variables investigated.
Bibliography
1. Dragomirescu, L. (1998) - Biostatistică pentru începători, Ed. ConstelaŃii, Bucureşti, 216 p.
2. Gomoiu, T. M., Skolka, M. (2001) - Ecologie. Metodologii pentru studii ecologice, Ed. Univ. „Ovidius” ConstanŃa, 170 p.
3. Grozea, A., Bura, M. (2002) - Crapul - Biologie, sisteme de creştere, patologie, Ed. de Vest, Timişoara, 207 p.
4. Manea, I. GH. (1985) - Aclimatizarea de noi peşti şi alte orgasnisme acvatice, Ed. Ceres, Bucureşti, 160 p.
5. Pojoga, I., Negriu, R. (1988) - Piscicultura practică, Ed. Ceres, Bucureşti, 213 p.
6. Simionescu, Viorica (1983) - Lucrări practice de ecologie, Ed. Univ. „Alexandru Ioan Cuza” Iaşi, 192 p.
7. Varvara, M., Zamfirescu, Şt., Neacşu, P. (2001) - Lucrări practice de ecologie, Ed. Univ. „Alexandru Ioan Cuza” Iaşi, 152 p.
8. Voican, V., Rădulescu, I., Lustun, L. (1974) - Călăuza piscicultorului, Ed. Ceres, Bucureşti, 366 p.
9. Voican, V., Lustun, L., Rădulescu, I. (1975) - Practica selecŃiei şi reproducerii la peşti, Ed. Ceres, Bucureşti, 192 p.