Application of Ant-based Template Matching for Web Documents
Categorization
Siok Lan Ong , Weng Kin Lai, Tracy S. Y. Tai and Kok Meng Hoe MIMOS, Technology Park Malaysia,
57000 Kuala Lumpur, Malaysia. Choo Hau Ooi
University of Malaya,
50603 Kuala Lumpur, Malaysia
Keywords: swarm intelligence, ant colony optimization, data clustering, document clustering. Received: February 18, 2005
The self-organization behavior exhibited by ants may be modeled to solve real world clustering problems. The general idea of artificial ants walking around in search space to pick up, or drop an item based upon some probability measure has been examined to cluster a large number of World Wide Web (WWW) documents. However, this idea is extended with the direct application of template matching with a Gaussian Probability Surface (GPS) to constrain the formation of the clusters in pre-defined areas of workspace with these multi-agents in this paper. Some comparisons between the clustering performance of supervised ants using GPS against the typical ants clustering algorithm are shown. Their performance are evaluated on the same dataset consisting of a collection of multi-class web documents. Finally, the paper concludes with some recommendations for further investigation.
Povzetek: Tehnike kolonij mravelj so bile uporabljene za kategorizacijo internetnih dokumentov.
1
Introduction
Social insects make up 2% of all species of living organisms that live in this world [2], with ants forming by far the largest group - 50% of these social insects are ants. Within the ant colonies, there is specialization in the tasks that need to be performed. Many of these simple but yet important tasks are very similar to some of the real world problems for humans. For example, the foraging behavior of ants has shown to be a useful computing paradigm for solving discrete optimization problems [3]. Similarly, the self-organizing behavior of ants may be used to model intelligent applications such as clustering. This paper will focus on the task performed by the specialized worker ants that include nest and cemetery maintenance through clustering, and model it to cluster the fast growing sources of online text documents in particular.
Similar to any typical document clustering task, web documents clustering may generally be seen as dividing the set of documents into homogeneous groups with the main purpose that documents within each cluster should be similar to one another while those which are from different clusters should be dissimilar [4]. Even though this sounds simple enough, unfortunately, the sheer size of the World Wide Web makes it difficult to manually categorize the documents. In order to automate the process, different well-established clustering approaches have been widely applied to effectively organize the documents based on the above principle in terms of
processing time, quality of clustering and spatial distribution. The straightforward model which ants move randomly in space to pick up and deposit items on the basis of local information has also been explored to cluster such web documents [1]. However, it has also been observed that some species of ants combine these self-organisation activities with template mechanisms [5]. A template is a kind of tool used by the insects to guide them perform their activities better. For example, in the context of nest building, the shape of the nest may be predefined by templates. The insects will then just build their nest along the markers on such a blueprint.
This paper examines the direct implementation of a template based on a Gaussian Probability Surface (GPS) to supervise these homogeneous multi-agents to form clusters within a specified dropping zone. In addition, the results will also be compared with those obtained through unsupervised multi-agents clustering. Basically, the main idea is building on the concept of “self-organisation along a template”, whereby a template mechanism is combined with the self-organisation mechanism. More specifically, it involves mapping each pixel in the workspace layer to a similar pixel in another surface within the same relative spatial location. Combining the underlying self-organizing mechanisms of the algorithm with templates allows all the items be deposited in some particular regions of space [6].
section 3. The supervised form of this computing paradigm, involving GPS is explained in greater details in section 4. The experimental set-up and the results obtained are shown in sections 5 and 6 respectively. Finally, some conclusions as well as areas for further investigation are discussed in section 7.
2
Web Document Representation
The clustering process of documents, in this case, web pages, involves implementing suitable clustering techniques to group together documents that have similar characteristics. However, before the similar documents can be grouped together, an important process is to identify and extract all the relevant features of each document, so that each document is now represented in a form that the clustering algorithm can process. The feature extraction of a document basically involves finding the representation of the word vector or set of descriptors that best describe it. Concise representations are usually derived from the contents of more complex object. In the case of textual objects i.e. documents (more specifically, web pages), words taken directly from the document but augmented with weights to form a bag-of-words representation while disregarding the linguistic context variation at the morphological, syntactical, and semantically levels of natural language[87].
2.1
Automated Text Processing
Automated text processing is the process of producing document representations or “bags of words” (also known as index terms) automatically. Conventionally, text processing which follows a standard procedure, may be divided into 4 major text operations [78]. This will be described further in the next few sections.
2.1.1 Lexical
Analysis
This is generally defined as the process of converting a stream of characters (the text of the documents) into a stream of words (the candidate words to be adopted as index terms and it involves more than "linear analysis" or "scanning" of spaces between the words as word separators. The stream of characters making up the text is read one at a time and grouped into lexemes (lexemes are minimal lexical unit of a text). However, there are four particular cases that need to be considered with care, viz.
• Digits
• Hypens
• Punctuation marks
• Letters
Many of these characters, especially hypens, digits, and punctuation marks are removed from any further consideration, as shown in figure 1(a) and (b). Once the text have been processed, these lexemes will be fed into another stage for further processing, in this case, to eliminate the stopwords.
The Requests for Comments (RFC) document series is a set of
technical and organizational notes about the Internet (originally the ARPANET), beginning in 1969. Memos in the RFC series discuss many aspects of computer networking, including protocols, procedures, programs, and concepts, as well as meeting notes, opinions, and sometimes humor. For more information on the history of the RFC series, see "30 years of RFCs".
(a) The original text
The Requests for Comments RFC document series is a set of technical and organizational notes about the Internet originally the ARPANET beginning in Memos in the RFC series discuss many aspects of computer networking including protocols procedures programs and concepts as well as meeting notes opinions and sometimes humor For more information on the history of the RFC series see years of RFCs
(b) Lexemes
Figure 1: Lexical Analysis
2.1.2 Stopwords
Elimination
Stopwords are very commonly used words, and in the English language these would be articles, pronouns, adjectives, adverbs and prepositions which have been known to make poor index terms. They are usually removed from further consideration as index terms when identified in a document. The process of stopwords elimination is illustrated in figure 2 with a part of Dr. Martin Luther King Jr.’s well-known “I Have a Dream” speech that he delivered in Washington D.C. on August 28, 1963.
I have a dream that one day this nation will rise up and live out the true meaning of its creed: We hold these truths to be self-evident: that all men are created equal. I have a dream that one day on the red hills of Georgia the sons of former slaves and the sons of former slave owners will be able to sit down together at a table of brotherhood. I have a dream that one day even the state of Mississippi, a desert state, sweltering with the heat of injustice and oppression, will be transformed into an oasis of freedom and justice. I have a dream that my four children will one day live in a nation where they will not be judged by the color of their skin but by the content of their character. I have a dream today.
Total Word Count : 143
(a) The original text
dream day nation rise live true meaning creed: hold truths self-evident: created equal. dream day red hills Georgia sons former slaves sons former slave owners able sit table brotherhood. dream day Mississippi, desert state, sweltering heat injustice oppression, transformed oasis freedom justice. dream children day live nation judged color skin content character. dream today
Total Word Count : 54
(b) With stopwords removed
Figure 2: Process of Stopwords Elimination
Closer examination at the first sentence of the address shown here will clearly reveal that common words like I, have, a, that, one, this, will, up, and, out, the, of, and its, have been eliminated as stopwords.
2.1.3 Stemming
The objective of stemming [8] is to remove affixes (i.e. prefixes and suffixes) so as to reduce the total size of the index terms. This is normally done with ways of finding morphological variants of terms in documents. Examples of the stemmed index terms are shown in Table 1 below.
Table 1: Example of the stemming process on several
terms
Original Term After stemming
possibilities possibl
Possible possibl
possibility possibl Possibly possibli
Software Softwar
Software softwar
2.1.4 Indexing
This is the final process of text processing where the index terms are extracted to identify the important features for each document. Feature extraction of a document involves finding the optimal representation of the word vector or set of descriptors that best describe the salient features of the documents.
There are several ways to shortlist the index terms from a document. In this paper, the index terms were selected by using one of the most commonly used weighting approach known as tf.
idf (term frequency inverse document frequency):
⎟
⎠
⎞
⎜
⎝
⎛
×
=
i ij ijn
N
f
w
log
(1)where
w
ij is the weight of word i in document j,f
ijbethe frequency of word i in the document j, N the number of documents in the collection, and ni the total number of times word i occurs in the whole collection.
3
Ant Colony Models
The ability of insects such as ants living in a colony has fascinated many in the scientific community and this has led to more detailed studies on the collective behavior of these creatures. Even though these insects may be small in size and live by simple rules, but yet they are able to survive well within their colony. Scientists have recently found that this behavior could be borrowed to solve complex tasks such as text mining, networking etc. Deneubourg et al. had developed this concept further by modeling the ant’s action in organizing their nests for data classification. Assuming each of these multi-agents carries one item at a time and there is only one item type,
the probabilistic functions, Pp and Pd that model such behaviour are shown below, i.e.:
Picking up probability,
2 1 1 ⎟⎟ ⎠ ⎞ ⎜⎜ ⎝ ⎛ + = f k k
Pp (2)
Dropping probability,
2
2 ⎟⎟⎠ ⎞ ⎜⎜ ⎝ ⎛ + = f k f
Pd (3)
where f denotes the fraction of similar items in the neighbourhood of the agent, while k1 and k2 are threshold constants. When f →1, it means that there are many similar items in the neighbourhood, indicating that there is a high possibility that the multi-agent will put down the item it is carrying, as Pd will be high too. Similarly, the agent is not likely to pick up the item when Pp is low. This will happen when most of the items in the neighbourhood are dissimilar, as indicated by f →0. Essentially, there is a high possibility of picking up items which are isolated and transporting them to another region where there are now more of its kind in the neighbourhood. The possibility of dropping the item will be low when Pd. → 0.
Lumer & Faieta (LF) [9] had reformulated Deneubourg et al.’s [10] model to include a distance function, d between data objects for the purpose of exploratory data analysis. The binary distance between objects i and j, d(oi, oj), is assigned 1 for dissimilar objects and 0 for similar objects. Essentially this binary distance measure is the Hamming distance [11] between two objects. The fraction of items in the neighbourhood,
f
in equation (2) and (3) is replaced with the local density function, f(oi) which measures the average similarity of object i with all the other objects j in its neighbourhood, N. Given a constant, α, and the cells in a neighbourhood N(c), f(oi) may be defined as:∑
∈⎥
⎦
⎤
⎢
⎣
⎡
−
=
2 ( )1
(
,
)
)
(
1
)
(
o N c i ji j
o
o
d
c
N
o
f
α
if f > 0Otherwise,
f
(
o
i)
=
0
(4)α is a factor that defines the scale of dissimilarity that will influence when two items should or should not be placed together in the same neighbourhood. For exxample, if α is large, it will only marginalise the differences between the items, leading to the formation of clusters composed enitrely of items which should not be grouped together in the same cluster.
4
Supervised Ant Colony Models
with Gaussian Probability Surface
(GPS)
there are other species, like the Acantholepsis custodiens ants that are known to perform self-organization which are constrained by templates [5]. A template is a pattern that is used to construct another pattern. In the case of some species of the ants which are found in Nature, they utilize the information related to the temperature and humidity gradients in their surroundings to build their nests to spatially distribute their brood [5]. This concept of self-organizing with templates has been used by Dorigo & Theraulaz for data analysis and graph partitioning [6].
With such mechanisms, the result is that the final structures would closely follow the configuration defined by the templates. However, this is only useful in applications where the numbers of clusters are known beforehand. The template we have used here, in the form of a Gaussian Probability Surface (GPS) guides the multi-agents to form clusters within a toroidal working space.
(a) Example of a toroidal surface
(b) A 30×30 toroidal workspace expanded into two-dimensions
Figure 3: Toroidal Workspace
Hence, all the cells that are lying at the perimeter of this workspace will be adjacent to each other. For example, the cells in column 1 of a 30 × 30 workspace will have neighbours in columns 2 and 30, as shown in figure 3 above. Similarly, the cells in the top row a, will have row b and row ad as their neighbours.
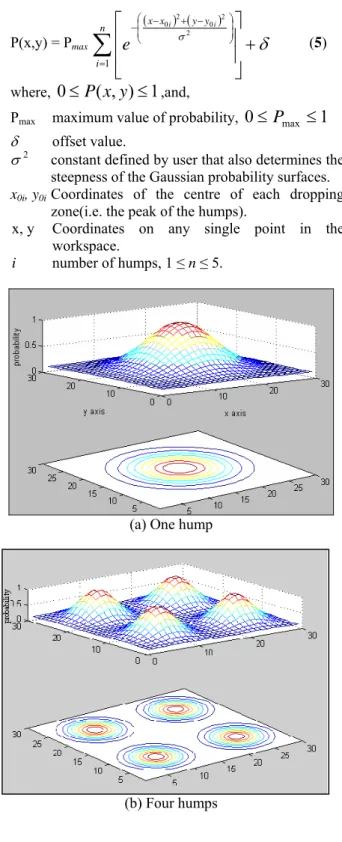
The GPS equation, P(x,y) is shown in equation 5 below.
P(x,y) = Pmax
( ) ( )
δ
σ
+
⎥
⎥
⎦
⎤
⎢
⎢
⎣
⎡
∑
=
⎟ ⎟ ⎠ ⎞ ⎜
⎜ ⎝
⎛ − + −
− n
i
y y x
x i i
e
12 2 0 2 0
(5) where,
0
≤
P
(
x
,
y
)
≤
1
,and,Pmax maximum value of probability,
0
≤
P
max≤
1
δ offset value.
σ2 constant defined by user that also determines the steepness of the Gaussian probability surfaces. x0i, y0i Coordinates of the centre of each dropping
zone(i.e. the peak of the humps).
x, y Coordinates on any single point in the workspace.
i number of humps, 1 ≤ n ≤ 5.
(a) One hump
(b) Four humps
Key :
Figure 4: The Gaussian Probability Surface (GPS) superimposed onto the toroidal working space. The colour bar indicates the probability of the surface for various colours.
The probability surface is two dimensional and isotropic (circular symmetry). Figure 4 shows an example of the
1 2 3 4 5 6 7 8 9 10 11 12 13 14 15 16 17 18 19 20 21 22 23 24 25 26 27 28 29 30
GPS model with one and four humps superimposed onto the toroidal workspace. Both the x- and y- axes represent the location within this toroidal workspace. As the height of the probability surface increases, the probability of dropping the document by the multi-agents is higher. Hence, more similar documents are expected to
be clustered in the area underneath the probability “shadow” as defined by each hump. Essentially, this will enhance the quality of clustering by having clusters with similar document types in the specified dropping zone instead of forming in non-deterministic region of the workspace.
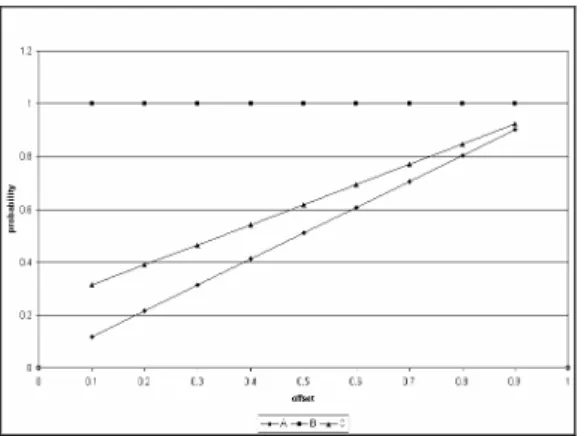
(a) The plot of the probability values for each of the 3 points monitored.
(b) The location of the 3 locations monitored.
Figure 5: The probability values of 3 locations for
various offsets.
Figure 5(a) shows the probability values with different values of the offset δ. It may be seen that the probability for depositing an item increases linearly with an increase in the offset (δ) values. The probability is close to 1 at the peak of the humps and there was only a slight increase for any increments of the offset δ. However, there is a significant change in the probability for points at the lower portion of the surface for different values of the offset. In addition, the dropping probability distribution in the regions between the contour lines does not vary much for higher offsets. This implies that there
are actually more space for the multi-agents to unload the documents for higher offsets.
The multi-agents can only move one step in any direction at each time unit from its existing location to an unoccupied adjacent cell. Only a single agent and/or a single item is allowed to occupy any one cell at a time. An agent occupying any cell, c on the clustering space immediately perceives a neighbourhood of 8 adjacent cells i.e. N(c) = 8. This is illustrated in figure 6 below.
Figure 6: The neighbourhood of any one location in the
workspace.
The decision of an unladen agent to either pick up or ignore an item oiat cell c is dictated by a probability Pp that is based on a local density function, g(oi). This local density function determines the similarity between oi and other items oj, where j ∈ N(c). If an agent laden with item oi lands on an empty cell c, it will calculate a probability Pd based on the same function g(oi) and decides whether to drop oi or keep on carrying it. Unlike f (see Eq. 4) which uses a distance measure and an additional parameter α, the function g(oi) uses a similarity measure which may be defined as follows:
∑
=
j
o i j
i S o o
c N o
g ( , )
) ( 1 )
( (6)
where S (oi,oj) is a measure of the similarity between objects oi and oj.
To model the inherent similarity within documents, one measure that is often employed in information retrieval is the cosine measure, where,
∑
∑
∑
= =
=
× × =
m k jk n
k ik r
k ik jk j
i
f f
f f doc
doc S
1 2 , 1
2 ,
1 , ,
cos
) ( )
(
) (
) ,
( (7)
r is the number of common terms in doci and docj, n and m represent the total number of terms in doci and docj respectively. fa,b is the frequency of term b in doca. A useful property of the cosine measure Scos is that it is invariant to large skews in the weights of document vectors, but sensitive to common concepts within documents.
space was used. This model requires large samples and repeated measurements with random errors distributed according to the Gaussian probability [1213].
5
Experimental Set-Up
The 80 web pages used in the experiment came from four different categories—Business, Computer, Health and Science that were randomly retrieved from the Google web directory. These were then pre-processed to extract a representative set of features. The main purpose of this feature extraction process is to identify a set of most descriptive words of a document. This resulted in a collection of 17,776 distinct words. To reduce memory requirements during clustering, the collection was represented by a sparse matrix with three elements per row: (i) a unique web page identifier, (ii) a unique word identifier, and (iii) the frequency value of each word within the web page. This is illustrated in Figure 7 below. Hence, only the most descriptive words will be represented here, with each word assigned a unique ID and its associated frequency within the page.
<page ID>, <wordID>, <wordFreq>
<page ID>, <wordID>, <wordFreq>
<page ID>, <wordID>, <wordFreq>
<page ID>, <wordID>, <wordFreq>
…
(a) : Input representation
357,1,1 463,5,5 179,2379,1 355,2379,3 …
(b): An example
Figure 7 : Input representation of the web documents
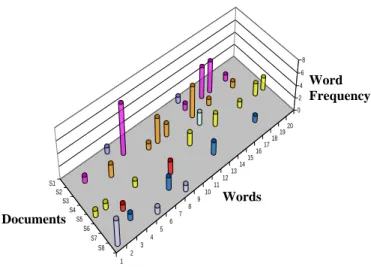
One of the inherent challenges of representing these documents with a set of keywords involves the optimal selection of these words for the set of features. Using all the 17,776 words will no doubt leave all the documents represented, but the sheer size of the set of words will incur a very heavy computation overhead. Even then, many of these words do not occur across many of the documents. It is rare to have all the words in the list to occur throughout the whole set of documents. This is illustrated in figure 8 with a sub-set of 2 documents from each of the 4 categories for 20 words. The Y-axis represents the frequencies of the words for each web document. Even though this figure shows only 2 documents from each category it clearly illustrates the occurrences of the words and their frequencies for each document.
Figure 8: 3D representation of the feature coverage for 8
documents.
Intuitively, it would be good to remove all those features (words) that have very low occurrences across the documents in the set. Good candidates for such a removal would be those that occur in all the documents in any one class of similar documents. In addition, the words which have been extracted for these text documents, were augmented with the appropriate weights, while disregarding the linguistic context variation at the morphological, syntactical, and semantic levels of natural language. The extracted word-weight vectors are usually of high dimensions. A total of 6,976 distinctive words were found in this collection of web documents investigated here
Next, the classification of the dataset described in the previous paragraph above using supervised and unsupervised multi-agents within a 30x30 toroidal grid and 15 homogeneous agents with threshold constants, k1 = 0.01 and k2 = 0.15 was investigated.
Both the supervised and unsupervised approaches were set to run at a maximum of iterations, tmax of 140,000. As there are four document categories in this experiment, a similar number of humps were pre-defined at the start of the supervised approach.
6
Results and Discussion
This section depicts the experimental results of supervised and unsupervised multi-agents clustering with the parameters setting as described in the previous section.
1 2
3 4 5
6 7 8
9 1011
1213 1415
1617 1819
20
S1 S2
S3 S4
S5 S6
S7 S8
0 2 4 6 8
Word Frequency
Words
Figure 9(a): The random distribution of the web
documents
Key :
o – Business ∇ - Computer + - Health * - Science
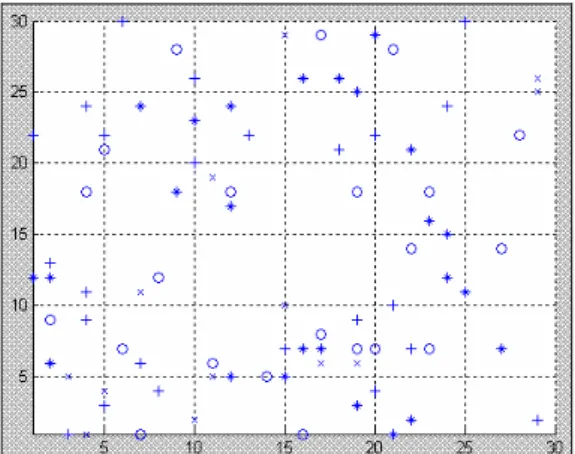
Figure 9(b): Clusters of documents formed at t =
140,000.
Key :
o – Business ∇ - Computer + - Health * - Science
Figure 9(a) shows how the web documents were initially scattered on the two dimensional workspace at time t=0. After 140,000 iterations, four clusters of mixed classes of documents were formed. The quality of the results were evaluated through the measures of purity and entropy. Table 2 below shows the purity (measures the similarity) and entropy (which measures the distribution of various (actual) categories of documents within a cluster) values of the clusters [1314]. A high value of purity suggests that the cluster is a pure subset of the dominant class. Similarly, an entropy value of 0 means the cluster is comprised entirely of one class. On the other hand, an entropy with a value of 1 would strongly indicate that the cluster itself is a mixture of items without any distinctive or dominant class. The overall entropy value is the weighted sum of the individual values for each cluster which takes into account the size of each cluster formed. The same applies for the overall purity value.
Table 2: The purity and entropy values for different
clusters of documents and the overall result.
Cluster Entropy Purity Majority Class
A 0.9297 0.4000 Health
B 0.4732 0.7857 Business
C 0.5337 0.6923 Computer
D 0.0000 1.0000 Science
Overall 0.5181 0.5375 -
Figure 10 : Graphical representation of the differences in
the size of the clusters formed.
(a): The random distribution of the web documents on the workspace at t =0.
(b): Four clusters with each containing a majority of different classes were formed at t = 80,000. Figure 11: Key : o – Business ∇ - Computer
+ - Health * - Science
Figure 11(a) shows the initial placement of the documents which were scattered on the workspace with the contour plots of the GPS superimposed upon it. After 80,000 iteration it was obvious that the multi-agents had sorted the documents into four different clusters. Most of the documents in the contour regions were closely placed near to the centre of each cluster. In addition, there were only nine documents found scattered at the base of the probability surfaces (indicated by the areas outside the contours). The purity and entropy values obtained from this approach are depicted in Table 3 below:
Table 3: The purity and entropy values for different
clusters of documents and the overall result
Cluster Entropy Purity Majority Class
A 0.8229 0.4706 Health
B 0.7960 0.5625 Business
C 0.8390 0.5263 Computer
D 0.7050 0.5715 Science
Overall 0.3954 0.5000 -
Figure 12 : Graphical representation of the differences in
the size of the 4 major clusters formed.
In comparison, although both approaches produce clusters which have nearly similar purity values, however the entropy for the supervised approach using the GPS was approximately 20% better better when compared to the unsupervised approach. Moreover, it was also found that it was difficult to identify the clusters if GPS had not been used. In other words, the spatial distribution between clusters was uneven without GPS. Conversely, if GPS was adopted, the clusters in the contour areas could be easily identified as the spaces between the clusters were more distinctive. In addition, the clusters formed by the GPS were neat and more tightly coupled whereas those without GPS were loose as shown in figure 11(b) and 9(b) respectively. A graphical representation of the difference in the size of the cluster formed is shown in figures 10 & 12. These depict the differences in the size of the clusters formed. Both graphical representations were drawn on the same scale. Clearly, there is also a greater uniformity in the size of the clusters generated when the clusters were formed with GPS.
In terms of the stability of the clusters, with GPS, the multi-agents were able to move most documents into the cluster itself and seldom went beyond the specified regions. Any document could be easily moved around the workspace when the agents were fully unsupervised. Hence, it is suggested that the GPS was actually guiding the multi-agents to cluster the documents while constraining the size of clusters in certain regions. More importantly, there was also an improvement in processing time required. With the supervised approach, the clusters were formed at 80,000 iterations, as compared with 140,000 for the unsupervised approach. This would be very useful for the retrieval and access of high dimension web documents.
7 Concluding Remarks and Future
Directions
In this paper, the findings of an extended study on using a multi-agent system based on the collective behavior of social insects i.e. ants, to cluster web documents retrieved from a popular search engine were presented. Unlike earlier work, the concept of a direct application of the concept of a Gaussian Probability Surface (GPS) to
constraint the formation of the clusters in pre-defined areas in the workspace was introduced. The experimental results showed that the proposed multi-agent system was able to induce clusters with better characteristics than those obtained without this probability surface, even though these results may only be marginally better Visually it may also be obvious that the clusters are better formed than those obtained when there is no GPS. In figure 9(b) one can clearly identify two smaller clusters. This is illustrated in figure 13 below.
Figure 13: 6 clusters of documents formed with the
unsupervised approach
Essentially, unlike the GPS-driven clustering approach, without specifying the exact number of clusters to be formed, the unsupervised approach has formed a total of 4 large clusters and two smaller ones. The results obtained, although not on par with the classification ability of human experts, do demonstrate the potential and effectiveness of ant-like multi-agent systems in handling complex and high-dimension data clusters.
In conclusion, the new approach to organize web documents with the Gaussian probability surface have shown some interesting and improved results. It has also been noticed that the offsets do have a profound effect on the quality of the clusters formed as well as the speed of convergence of the multi-agent system. Obviously, if the offset of the GPS is high, the multi-agents would have a higher freedom to drop the web documents that they may be carrying, over a wider area. A low offset has the opposite effect. Hence, it would be interesting to explore how a non-stationary offset can produce better clusters in the future. Future investigations should also focus on a larger perceivable time-dependent neighbourhood for agents and a better formulation of a stopping criterion based on homogeneity and spatial distribution of clusters. Lastly, future research efforts should also look at developing a deterministic initial distribution of data points on the workspace which may improve the clustering results.
Acknowledgements
The authors would like to thank C.C. Loy for his help in generating the contour graphs. W.K. Lai, Tracy S.Y. Tai and K.M. Hoe gratefully acknowledges the research grant
A B
provided by the Malaysian Ministry of Science, Technology & Innovation under grant 04-01-04-005 EA 001 that have in part resulted in this article.
References
[1] Hoe K. M., Lai W.K., & Tracy Tai, “Homogeneous Ants for Web Document Similarity Modeling and Categorization”, Proceedings of the Third International Workshop on Ant Algorithms, pp 256 – 261, September 12th – 14th, 2002, Brussels, Belgium. [2] M.Dorigo, Artificial Life: “The Swarm Intelligence
Approach”, Tutorial TDI, Congress on Evolutionary Computing, Washington, DC. (1999).
[3] Engelbrecht, A.P., “Computational Intelligence: An Introduction”, John Wiley & Sons Ltd (2002), ISBN: 0-470-84870-7.
[4] J.Handl, J.Knowles and M.Dorigo, “Ant Based Clustering: a comparative study of it’s relative performance with respect to k-means, average link and ld-som”, http://wwwcip.informatik.uni-erlangen.de/~sijuhand/TR-IRIDIA-2003-24.pdf,
March 24th 2004.
[5] Bonabeau, E., Dorigo, M., and Theraulaz, G., “Swarm Intelligence: From Natural to Artificial Systems”, University Press, Oxford (1999), pp 184. [6] Bonabeau, E., Dorigo, M., and Theraulaz, G.,
“Swarm Intelligence: From Natural to Artificial Systems”, University Press, Oxford (1999), pp 199. [7] Baeza-Yates, R.. and Ribeiro-Yates, B., “Modern
Information Retrieval”, ACM, NY (1999).
[8] M. F. Porter, “An Algorithm for Suffix Stripping", in Program, Vol. 14 (3) (1980), pp. 130-137.
[9] Lumer, E.D. and Faieta, B., “Diversity and Adaptation in Populations of Clustering Ants”, Int. Conf. Simulation of Adaptive Behavior: Fr. Animals to Animats. MIT, MA (1994).
[10] Deneubourg, J. L., Goss, S., Franks, N.R., Sendova-Franks, A., Detrain, C., and Chretien, L., “The Dynamics of Collective Sorting: Robot-like Ants and Ant-like Robots”, Int. Conf. Simulation of Adaptive Behaviour: Fr. Animals to Animats. MIT, MA (1990).
[11] Definition of Hamming Distance, National Institute of Standards & Technology, Available at http://www.nist.gov/dads/HTML/hammingdist.html, 25/1/2005.
[12] Bonabeau, E., Dorigo, M., and Theraulaz, G., “Swarm Intelligence: From Natural to Artificial Systems”, University Press, Oxford (1999), pp 149. [13] Department of Physic and Astronomy, “Physics
and Astronomy: The Gaussian Distribution”,
http://physics.valpo.edu/courses/p310/ch2.3_gaussia n/, March 24th 2004.