THE RACE TO THE TOP – EARLY LEARNING CHALLENGE
YEAR TWO PROGRESS REPORT
THE RACE TO THE TOP – EARLY LEARNING CHALLENGE
YEAR TWO PROGRESS REPORT
AN OVERVIEW OF IMPLEMENTATION FROM THE FOURTEEN
RTT–ELC STATES’ ANNUAL PERFORMANCE REPORTS FOR 2013
Suggested citation: U.S. Department of Education and U.S. Department of Health and Human Services. (2014). The Race to the Top – Early Learning Challenge Year Two Progress Report. Washington, DC.
TABLE OF CONTENTS
Executive Summary ... iii
RTT-ELC Overview ... 1
RTT-ELC Grantee States ... 1
Children with High Needs ... 2
RTT-ELC Framework for Reform ... 3
Building a Successful Comprehensive, Coordinated Early Learning State System ... 4
High-Quality, Accountable Programs ... 5
Focused Investment Areas in RTT-ELC ... 5
Improving Quality and Access In Early Learning and Development Systems ... 7
Building Systems of Program Improvement ... 7
TQRIS in RTT-ELC States ... 9
Improving Quality and Increasing Access for Children with High Needs ... 11
Increasing the Number of Early Learning and Development Programs in the TQRIS ... 11
Increasing the Number of Programs in the Top Two Tiers of the TQRIS ... 12
Increasing Access to High-Quality Programs for Children with High Needs ... 13
Spotlight on States ... 16
Supporting the Early Childhood Education Workforce ... 20
Spotlight on States ... 23
Understanding Children’s Status at Kindergarten Entry ... 26
KEA Defined ... 26
Spotlight on States ... 29
Improving Data Systems ... 30
Spotlight on States ... 32
Engaging and Supporting Families ... 34
Spotlight on States ... 35
Promoting Children’s Healthy Development ... 37
Spotlight on States ... 38
Final Thoughts ... 41
Appendix A: State-Level APR Data Tables: Increasing the number of early learning and development programs in the top tiers of the TQRIS. ... 43
Appendix B: State-Level APR Data Tables: Increasing the number of children with high needs in programs that are in the top tiers of the TQRIS. ... 45
In States that make it a priority to educate our youngest children . . . studies show students grow up more likely to read and do math at grade level, graduate high school, hold a job, form more stable families of their own. We know this works. So let’s do what works and make sure none of our children start the race of life already behind.
—President Barack Obama, State of the Union, February 12, 2013
EXECUTIVE SUMMARY
The human brain develops rapidly in the first five years of life. High-quality early learning experiences can have a profound and lasting positive effect on young children during these years, setting the stage for success in kindergarten and beyond.1 This is especially true for young children with high needs who are
from low-income families;2 who have disabilities or developmental delays; who are English learners; who
reside on “Indian lands”; who are migrant, homeless, or in foster care; and other children as identified by the State.
The Race to the Top – Early Learning Challenge (RTT-ELC) program, authorized by Congress in 2011,3is
designed to improve the quality of early learning and development programs for young children. The RTT-ELC grants support States' efforts to design and implement an integrated system of high-quality early learning programs and services.
Twenty States were awarded four-year grants in three phases. Nine Phase 1 States (California, Delaware, Maryland, Massachusetts, Minnesota, North Carolina, Ohio, Rhode Island, and Washington) received funding in 2012. Five Phase 2 States (Colorado, Illinois, New Mexico, Oregon, and Wisconsin) received funding in 2013 and supplementary funding in 2014. In Phase 3, an additional six States (Georgia, Kentucky, Michigan, New Jersey, Pennsylvania, and Vermont) received funding in 2014. The Federal investment in these 20 RTT-ELC grants is just over $1 billion.4 This discretionary grant program is
administered jointly by the U.S. Departments of Education (ED) and Health and Human Services (HHS). As they work to implement their RTT-ELC projects, each State brings an individual early learning history, climate, and structure to the work, as well as unique challenges that must be addressed. While the RTT-ELC framework provides a general structure for key reform levers to improve quality and access for children with high needs, States were given flexibility to choose which components they were ready to address and how they would reach the goals within their plans.
The RTT-ELC Framework for Reform
The RTT-ELC framework consists of five key areas that represent the foundation of an effective early learning and development reform agenda. All RTT-ELC grantees were required to address two Core Areas of the RTT-ELC framework: A) A Successful State System and B) High-Quality, Accountable Programs. States then identified specific components in the remaining three areas (called Focused Investment Areas) and developed plans for how they would use their RTT-ELC funds in these areas. The Focused Investment Areas are: C) Promoting Early Learning and Development Outcomes for Children, D) A Great Early Childhood Education Workforce, and E) Measuring Outcomes and Progress.5
State-Reported Progress
RTT-ELC States submit Annual Performance Report (APR) data to ED and HHS each year as a requirement of the grant. In the spring of 2014, Phase 1 States and Phase 2 States submitted their APRs for 2013, their second and first APRs, respectively. This summary report provides information about the progress the 14
This report provides information from the 14 States about the impressive progress they are making in reforming their early learning and development systems. Here are a few of the highlights:
A Tiered Quality Rating and Improvement System (TQRIS) is a systemic approach to assessing, improving and communicating the levels of quality in early learning and development programs.6
RTT-ELC States have increased the number of early learning and development programs participating in their TQRIS and are implementing strategies to improve the quality of those programs. The total number of programs in the 14 States’ TQRIS increased from 31,321 programs to 54,157 programs enrolled in their TQRIS, a 73 percent increase from the time of their
applications to the end of 2013.
More children with high needs gained access to high-quality early learning and development experiences in RTT-ELC States. There was a 175 percent increase in the numbers of children with high needs enrolled in State-funded preschool programs in the top tiers of their TQRIS, a 43 percent increase in the numbers of children with high needs enrolled in Child Care and Development Fund (CCDF) funded programs in the top tiers of their TQRIS, and an 83 percent increase in the numbers of children with high needs enrolled in Head Start/Early Head Start programs in the top tiers of their TQRIS.
Ten States are targeting specific high-need communities or “zones” where they are implementing a set of initiatives aimed at building local capacity to support the workforce, engage families, and serve more children with high needs.
RTT-ELC States are working to identify what the early childhood education workforce should know and be able to teach young children. States are tying these core competencies to professional development opportunities and higher education course offerings so that early childhood educators can continue to progress in the field.
States are gathering essential data about how ready children are when they begin kindergarten by developing or implementing Kindergarten Entry Assessments (KEAs). Some States are currently piloting their KEAs; others are focused on training their early childhood educators to conduct the assessments; and still others are in the development phase and identifying assessment tools or establishing implementation strategies.
States are increasingly working across agencies to develop governance structures, put Memoranda of Understanding in place, and build or enhance program teams to implement their RTT-ELC plan activities.
The document describes some of the initiatives that 14 RTT-ELC States undertook in the first or second year of their grants, as reported in their Annual Performance Reports (APRs). It is not intended to be a comprehensive look at all the activities and progress States have made to date. Yet even in this short period of time and in this brief report, it is clear that the RTT-ELC grantees are making progress toward improving the quality of early learning and development programs in their States and providing access to these high-quality programs for more children with high needs. These efforts are moving States toward the RTT-ELC goal of providing more children from birth through age 5 with a strong foundation that is needed to succeed in school and beyond. The infusion of funding, coordinated technical assistance from RTT-ELC, and firm timelines are giving States the needed impetus to develop a systems-based approach to
_______________________________
1 For research about the lasting effects of high-quality early learning experiences, see Camilli, Gregori, Sadako Vargas, Sharon Ryan, and W. Steven Barnett. “Meta-Analysis of the Effects of Early Education Interventions on Cognitive and Social Development,” Teachers College Record, 112 (2010): 579–620. http://rci.rutgers.edu/~camilli/Papers/38_15440.pdf. Reynolds, Arthur J., Judy A. Temple, Suh-Ruu Ou, Irma A. Arteaga, and Barry A. B. White. “School-Based Early Childhood Education and Age-28 Well-Being: Effects by Timing, Dosage, and Subgroups,” Science, 33 (2011): 360-364. http://www.sciencemag.org/content/333/6040/360. Princiotta, Dan, and Kristin Denton Flanagan. Fifth Grade: Findings From the Fifth-Grade Follow-up of the Early Childhood Longitudinal Study, Kindergarten Class of 1998–99 (ECLS–K). (NCES 2006–038). U.S. Department of Education, 2006.
http://nces.ed.gov/pubs2006/2006038.pdf. Halle, Tamara, Nicole Forry, Elizabeth Hair, Kate Perper, Laura Wandner, Julia Wessel, and Jessica Vick. Disparities in Early Learning and Development: Lessons from the Early Childhood Longitudinal Study—Birth Cohort (ECLS–B). Child Trends, 2009.
http://www.childtrends.org/wp-content/uploads/2013/05/2009-52DisparitiesELExecSumm.pdf
2 For information about the benefits of high-quality early learning opportunities for children from low-income families, see Duncan, Greg J. and Robert J. Murnane. Restoring Opportunity: The Crisis of Inequality and the Challenge for American Education. Boston: Harvard Education Press, 2014. Additional information including Video about Boston Public Schools PreK program and related infographics is at http://restoringopportunity.com/. Also see Forry, Nicole, Elizabeth E. Davis, and Kate Welti. “Ready or not: Associations Between Participation in Subsidized Child Care Arrangements, Pre-Kindergarten, and Head Start and Children's School Readiness.” Early Childhood Research Quarterly 28 (2013): 634-644.
3 See §1832(b)(1), title VIII, Division B of P.L. 112-10, the Department of Defense and Full-Year Continuing Appropriations Act, 2011. http://www.acf.hhs.gov/sites/default/files/ecd/rtt_elc_legislation.pdf.
4 For more information about the three phases of RTT-ELC please see the RTT-ELC website at
http://www2.ed.gov/programs/racetothetop-earlylearningchallenge/applicant.html, which contains links to materials related to the three phases.
5 The RTT-ELC framework was first established in the 2011 Notice Inviting Applications for RTT-ELC, 76 FR 53564 (Aug. 26, 2011). 6 National Center on Child Care Quality Improvement. QRIS Quality Standards Web Sites. Office of Child Care, U.S. Department of Health and Human Services, 2013. https://occqrisguide.icfwebservices.com/files/QRIS_Standards_Websites.pdf. Also see the definition of “Tiered Quality Rating and Improvement System” from the RTT-ELC Notices Inviting Applications, which is identical across the three ELC Phases. NOTE: Information in the endnotes of the Executive Summary are also contained in the main section of the report, The Race to the Top Early Learning Challenge: Year Two Progress Report at https://elc.grads360.org/#program
RTT-ELC OVERVIEW
“High-quality early education can be a game-changer for the children and
families who need the most support. Investing in our children during their
critical early years of life is ultimately an investment in our collective future.”
— U.S. Secretary of Education Arne Duncan
High-quality early learning and development opportunities provided by supportive, well-trained early childhood educators are vital for our nation’s children, especially those with high needs.i The first five years of life are a critical period of rapid brain development. Research shows that high-quality early learning experiences can have a profound and lasting effect on children, setting the stage for success in
kindergarten and beyond.ii This is especially true for children with high needs, which the RTT-ELC Notice
Inviting Applications defines as children from birth through kindergarten entry who are from low-income families or otherwise in need of special assistance and support. This definition includes children who have disabilities or developmental delays; who are English learners; who reside on “Indian lands”; who are migrant, homeless, or in foster care; and other children as identified by the State.iii
The purpose of the Race to the Top – Early Learning Challenge (RTT-ELC) program, authorized by Congress in 2011,iv is to help States reach the goal of having all the nation’s children enter kindergarten ready to succeed. RTT-ELC is a competitive grant program that is administered jointly by the U.S. Department of Education (ED) and the U.S. Department of Health and Human Services (HHS). This signature program
supports States in developing comprehensive, coordinated early learning systems. These systems provide a mechanism for improving the quality of early
learning and development programs and ensuring better outcomes for children and families.
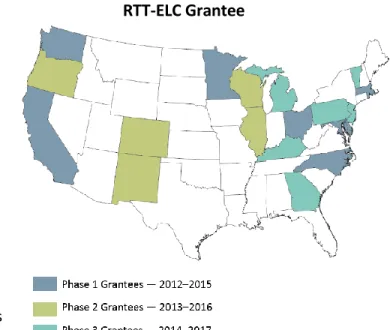
RTT-ELC Grantee States
During the first year of the program, 2012, nine
States received RTT-ELC grants (Phase 1). Five
additional States received grants in 2013 (Phase 2). Six additional States received funding
in 2014 (Phase 3). The 20 RTT-ELC grantee
States and their phases are represented in figure 1. Figure 2 indicates the funding amounts that were awarded to each RTT-ELC State. The Federal investment in these 20 RTT-ELC grants is just over $1 billion.v
States
RTT-ELC Grantee
Figure 2. RTT-ELC Federal Grant Amounts
*Data for children ages 0-5 from the Population Division, U.S. Census Bureau for data year 2012
http://www.census.gov/popest/data/historical/2010s/vintage_2012/index.html **Data for children below 200 percent FPL from the American Community Survey
(ACS) for data year 2012.
http://www.census.gov/acs/www/data_documentation/2012_release/ Table 1. Population estimates for children from birth through age 5, including those in families living below 200 percent of Federal poverty level
Children from Birth through Age 5 in Low-Income Families in RTT-ELC States Grantee
Total Number of Children Birth through
Age in the State*
Total Number of Children Birth through Age in the
State in Families Below 200% FPL**
Percent of Children in State
in Families Below 200% of
FPL
California 3,039,100 1,471,173 48.4%
Colorado 408,529 170,366 41.7%
Delaware 67,540 28,567 42.3%
Illinois 979,832 427,741 43.7%
Massachusetts 440,708 140,266 31.8%
Maryland 442,273 147,894 33.4%
Minnesota 422,642 149,346 35.3%
North Carolina 749,294 399,148 53.3%
New Mexico 170,799 102,783 60.2%
Ohio 844,935 407,228 48.2%
Oregon 280,737 140,433 50.0%
Rhode Island 66,881 25,997 38.9%
Washington 534,599 221,087 41.4%
Wisconsin 422,044 174,079 41.2%
All 14 Grantees 8,869,913 4,006,108 45.2%
All Other States 15,501,746 7,616,509 49.1%
United States 24,371,659 11,622,617 47.7%
Children with High Needs
A distinct and unique focus of RTT-ELC is on ensuring that children with the highest needs have increased access to high-quality early learning experiences. A key indicator that is often used as a marker of children with high needs is the number of children who are from low-income families (that is, families having an income of up to 200 percent of the Federal Poverty Level). Table 1 shows the number and percentage of all children from birth to age 5 who live in low-income families in each of the 14 RTT-ELC States that are included in this report. Almost half (45.2 percent) of the children from birth through age 5 in these States are in families living at or below 200 percent of the Federal poverty level. In 2012, that was defined as $46,100 for a family of four.vi
In total, the first 14 RTT-ELC Grantee States include more than 4 million children from birth to age 5.vii This
represents 34.5 percent of the more than 11 million children from birth through age 5 in families living below 200 percent of the Federal Poverty Level in the United States.
In their APRs, RTT-ELC States reported the number and percentage of children with high needs in each of several special population categories; however, the same child could be reported in more than one category, and most State systems do not allow the data to be disaggregated by category in order to provide unduplicated counts of the number of children with high needs.
In addition to challenges with reporting unduplicated counts of children, the APRs reveal other data quality issues related to performance measures and other data elements reported in the APRs. Common data collection and reporting challenges include data that are not yet available due to revisions to data systems or to TQRIS rating levels, as well as variations in definitions used to describe data elements such as levels of educator credentials. When RTT-ELC and its related performance measures were established, ED and HHS expected that the data collection would be new and challenging for States, many of which are only now designing their early learning data systems and determining how to link them to their K-12 systems. Where data systems do exist, they are still in their infancy, so data sharing and comparability are still significant challenges. Given the newness of the data collection for the APR reporting, there are significant limitations in the information that can be drawn from the current data. ED and HHS are committed to helping RTT-ELC States improve the quality of their data. As States continue to develop their data collection and reporting practices over the four years of their RTT-ELC grants, they will be better able to provide reliable data on numbers of children and types of programs that are being reached through their RTT-ELC efforts.
RTT-ELC States submit Annual Performance Report (APR) data to ED and HHS each year as a requirement of the grant. In the spring of 2013, Phase 1 States reported their first APR data for calendar year 2012. In the spring of 2014, Phase 1 States and Phase 2 States submitted their APRs for calendar year 2013, their second and first APRs, respectively. This report provides information about the progress the 14 Phase 1 and Phase 2 States reported in their APRs for 2013.
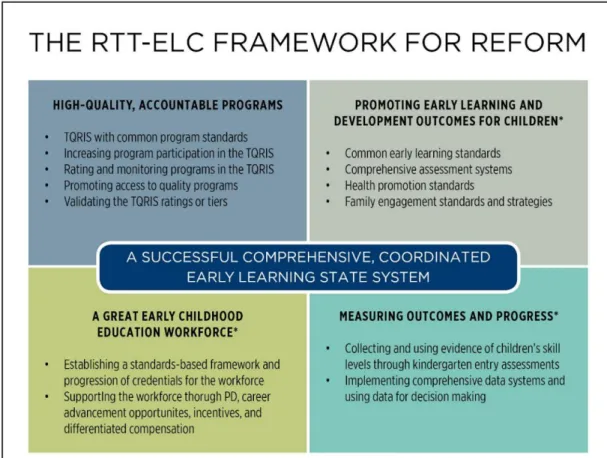
RTT-ELC Framework for Reform
The RTT-ELC program allows States to develop comprehensive, State-level early learning systems and build a more unified approach to supporting young children and their families. These efforts require processes that include establishing effective governance structures and building broad-based participation by key State agencies and other partners. They also require a structure for the various initiatives and efforts undertaken by the State to work together to propel the entire State early learning system forward. For RTT-ELC grantees, this structure is the RTT-ELC framework (see figure 3 on the next page), which consists of five key reform levers: A) A Successful State System; B) High-Quality, Accountable Programs;
C) Promoting Early Learning and Development Outcomes for Children; D) A Great Early Childhood
Education Workforce; and E) Measuring Outcomes and Progress.viii The first two core areas of reform,
A) A Successful Comprehensive, Coordinated Early Learning State System and B) High-Quality, Accountable Programs are required for all RTT-ELC grantees. The remaining three areas, called Focused Investment Areas, permit States to target their RTT-ELC resources to those reforms that will have the greatest impact given the needs, context, and readiness for reform in their individual States. Together all of these
Figure 3. RTT-ELC Framework for Reform
Building a Successful Comprehensive, Coordinated Early Learning State System
Many young children have early learning experiences in more than one setting. They could be in a Head Start program or a State-funded preschool in the morning and in a program funded by the Child Care and Development Fund (CCDF) for the rest of the day. They may spend part of the day in a program funded by the Individuals with Disabilities Education Act (IDEA). Each of these settings have separate systems of accountability, funding streams, standards for teachers, program standards, and data collection and reporting systems. This patchwork of services and systems may lead to inefficiencies, duplication or
disruption of services, and ultimately lost opportunities for young children and confusion for their families. The core of the RTT-ELC reform framework is helping States build comprehensive, coordinated early learning systems. All other reforms proposed by RTT-ELC States are dependent on a viable State system. In order to see results from various initiatives and efforts, RTT-ELC States agreed to implement those
initiatives within a coordinated system that includes stakeholders from all sectors that provide programs and services for young children and their families. States agreed to develop governance structures that promote and oversee the implementation of multiple plans and approaches. They must ensure that the
systems-level solutions that will stand the test of time and survive beyond the current leadership. The RTT-ELC framework requires States to work across programs and sectors and to integrate the perspectives of a variety of stakeholders in order to streamline and coordinate the often disparate early learning and development programs and services that families must navigate. States do not report separately on their systems-building work in their APRs; rather, this work supports all of their efforts and initiatives.
High-Quality, Accountable Programs
As part of their efforts to build and enhance coordinated State systems, RTT-ELC States are focused on developing high-quality, accountable programs for young children through their Tiered Quality Rating and Improvement Systems (TQRIS). Enhancing and strengthening their TQRIS is a required component of the State Plans for all RTT-ELC grantees.ix Within the TQRIS, programs are held accountable through the use of
strategies and standards for rating and monitoring, improving, and communicating the quality of those early learning and development programs. States can use this program information to make policy decisions about programs and provide supports for continuing to improve quality. Families can use this information to make important decisions about the programs that their children attend.
Focused Investment Areas in RTT-ELC
In addition to the two core areas that are required for all RTT-ELC grantees (Successful State Systems and High-Quality, Accountable Programs), the RTT-ELC framework includes three Focused Investment Areas that allow States flexibility to choose reforms that are likely to have the greatest impact in their State and to invest their RTT-ELC grant funds in those areas. Each of these three areas consists of several
components that States could select to address. Focused Investment Area C: Promoting Early Learning and Development Outcomes for Children includes promoting the use of common State developed early learning and development standards, developing comprehensive assessment systems, promoting healthy child development, and engaging families in their child’s learning and development. Focused Investment Area D: A Great Early Childhood Education Workforce includes supporting and strengthening the early childhood education workforce through a standards-based framework and progression of credentials, professional development and career advancement opportunities and other strategies. Focused Investment Area E: Measuring Outcomes and Progress includes collecting and using data to make decisions, and measuring children’s progress through kindergarten entry assessments.
The first phase of RTT-ELC grantees (awarded in 2011) were required, at a minimum, to select two components within Focused Investment Area C, one component from Focused Investment Area D, and one component from Focused Investment Area E. Given reduced levels of available funding, Phase 2 grantees (awarded in 2012 and supplemented in 2013) were required to select components from two of the three Focused Investment Areas. The Core Areas and Focused Investment Areas addressed by each of the RTT-ELC grantees as part of their State Plans are indicated in table 2 on the next page.
IMPROVING QUALITY AND ACCESS IN EARLY
LEARNING AND DEVELOPMENT SYSTEMS
Corresponds to RTT-ELC Core Area B
Building Systems of Program
Improvement
The Race to the Top – Early Learning Challenge (RTT-ELC) program presents an unprecedented opportunity for States to focus on their early learning and development systems for children from birth through age 5. In their APRs, the 14 States that began their RTT- ELC projects in 2012 and 2013 described the improvements to their systems through 2013 – improvements that are leading to higher quality early learning and development programs and increased access to high-quality programs for significantly more children with high needs.
In the 1990s, some States began a cross-agency, systems-level approach to program
improvement with what became Quality Rating and Improvement Systems (QRIS). QRIS brought together efforts to develop program standards, improve professional development
opportunities for early childhood educators, and give families the information they needed to find the right program for their children. These QRIS also included supports to help programs meet progressively higher standards. Initially, QRIS focused mainly on center-based child care programs and built higher levels of quality upon State child care licensing
regulations (which set minimum requirements for health, safety, and child development). An early source of funding for QRIS authorized by Congress was the Child Care and
Development Fund (CCDF), which is
administered by the Office of Child Care in HHS.
The CCDF statute requires that a minimum of 4 percent of each State’s CCDF expenditures be spent on quality activities. These “quality dollars” have supported States as they implemented their QRIS. x
Figure 4. Components of an Effective QRIS.
Source: Government Performance and Results Act Measures, U.S. Department of Health and Human Services, Administration for Children and Families, Office of Child Care, last modified January 2, 2013,
http://www.acf.hhs.gov/programs/occ/resource/government-performance-and-results-act-gpra-measures.
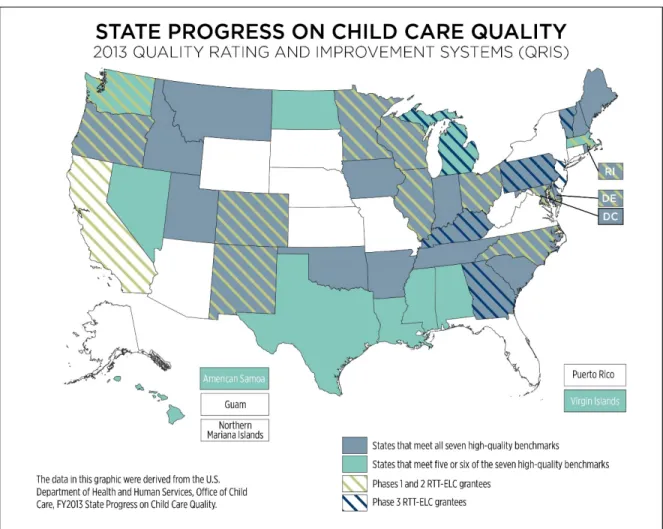
Today, the majority of States and Territories have some form of a QRIS. These systems continue to evolve and be refined as the field learns more about how to improve quality experiences for young children. Evidence of this evolution can be seen in the Office of Child Care’s seven components of an effective QRIS listed in figure 4 on the previous page and in the Office of Child Care data about the progress States and Territories are making in incorporating these seven components into their systems (see figure 5). Based on 2013 data from the Office of Child Care, of the RTT-‐ELC Phase 1 and Phase 2 States, eleven (Colorado, Delaware, Illinois, Maryland, Minnesota, New Mexico, North Carolina, Ohio, Oregon, Rhode Island, and
Wisconsin) have incorporated all seven components that mark an effective QRIS into their State systems. RTT-‐ELC funding is allowing these States to expand their QRIS to more programs and to enhance their ability for providing high-‐quality early learning and education. Two RTT-‐ELC States (Massachusetts and Washington) have incorporated five or six of the seven components, and California has incorporated fewer than five of the seven components of an effective QRIS. In figure 5, the 14 RTT-‐ELC Phase 1 and Phase 2 States are marked with green diagonal lines. The six Phase 3 States are marked with dark blue diagonal lines.
Figure 5. State Progress on Child Care Quality
FY2013 State Progress on Child Care Quality (U.S. Department of Health and Human Services, Office of Child Care)
The RTT-ELC program uses the term Tiered Quality Rating and Information Systems (TQRIS)xi to refer to
QRIS supported through RTT-ELC funds in the grantee States. States with RTT-ELC funding have been able to emphasize bringing the system statewide and encouraging all types of early learning and development programs to participate. The evolution to a TQRIS within the RTT-ELC program is described in the next section of this report. States have different ways of organizing their TQRIS. Eleven of the 14 States (California, Colorado, Delaware, Illinois, Maryland, North Carolina, Ohio, Oregon, Rhode Island,
Washington, and Wisconsin) have or are moving to five tiers or levels in their TQRIS. The remaining three States (Massachusetts, Minnesota, and New Mexico) have four tiers or levels (see figure 6).
Figure 6. Number of Tiers, or Levels, in RTT-ELC States’ TQRIS
TQRIS in RTT-ELC States
States that applied for an RTT-ELC grant were evaluated on the extent to which they either had a QRIS in place or were committed to establishing such a system. Grants were awarded in part based on how much States planned to improve, or in some cases reinvent, their QRIS. In RTT-ELC, these systems are referred to as TQRIS to emphasize the tiered aspect of a Quality Rating and Improvement System. Specifically, the ELC TQRIS is intended to highlight the importance of common tiers, or levels, across programs.
RTT-ELC requires States to examine whether the tiers in their TQRIS reflect meaningful differences in the levels of program quality so that families and other stakeholders know that a level 4 or 5 program is really of higher quality than a level 2 program.
In addition, RTT-ELC encourages States to improve the quality of early learning and development programs by designing and implementing a common, statewide TQRIS in which all licensed or State-regulated early learning and development programs are encouraged to participate, including State-funded preschool programs, Early Head Start and Head Start programs, programs funded under section 619 of Part B of the Individuals with Disabilities Education Act (IDEA) and Part C of IDEA, programs funded under Title I of the Elementary and Secondary Education Act, as well as programs receiving funds from the State's CCDF program. States are using a variety of strategies to improve their TQRIS and to increase access to high-quality programs for children with high needs. Examples of some of these strategies are presented in the Spotlight on States section below.
When RTT-ELC and its related performance measures were established, ED and HHS understood that many States did not yet have comprehensive and coordinated early learning data systems and that the data collection needed to document the progress under RTT-ELC would be new and challenging for many States. Currently, where data systems do exist, they are still in their infancy and may not be coordinated across sectors. This limits data sharing and data comparability, and results in significant limitations in the information that can be drawn from the current data. For example, many States do not have data systems that are able to provide disaggregated data for individual children by the type of program in which they are enrolled. Without unique child identifiers, States are often unable to determine if the same child is receiving services through multiple programs; therefore, the child would be counted in each program and enrollment numbers would be elevated. Despite these data challenges, States are making substantial progress in bringing more programs into their TQRIS and increasing the number of children who are enrolled in those high-quality programs. As State data collection efforts evolve, ED and HHS are committed to helping RTT-ELC States improve the quality of the data collection and reporting.
Improving Quality and Increasing Access for Children with High
Needs
RTT-ELC requires States to expand TQRIS beyond child care programs to ensure that all children in every type of early learning and development program can have access to high-quality early education. States are using a variety of strategies to bring more and varied types of early learning and development programs in to their TQRIS so that they will have strategies and incentives to continually improve their quality.
Increasing the Number of Early Learning and Development Programs in the TQRIS
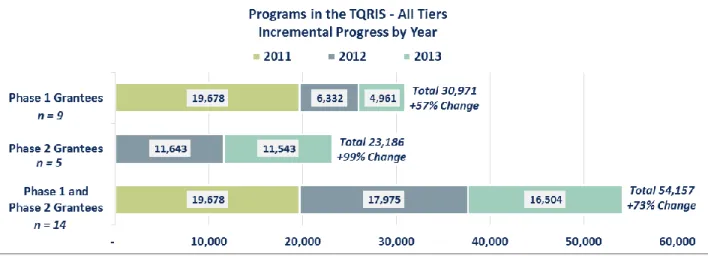
Increasing the number of early learning and development programs in a State's TQRIS requires thoughtful planning and a multipronged approach. Initially, QRIS focused on enrolling child care programs into the system. With RTT-ELC, QRIS has evolved into the TQRIS, which emphasizes bringing more programs, such as State-funded preschools and Early Head Start and Head Start, into the TQRIS in order to ensure that all families of children birth through age 5 have access to quality early learning opportunities regardless of where they receive services. RTT-ELC States are also exploring ways to include home-based programs that have not traditionally been included in the TQRIS, such as IDEA Part C early intervention services and home visiting programs. Figure 7 shows the progress RTT-ELC States are making in including more programs in the TQRIS.
Source: 2013 APR Performance Measure B(4)(c)(1)
Figure 7.Number of Early Learning and Development Programs Participating in the States’ TQRIS
Overall, Phase 1 and Phase 2 RTT-ELC grantees combined showed a 73 percent increase in the number of programs enrolled in their TQRIS. There were 31,321 programs enrolled in their TQRIS at the time of their applications (baseline) and 54,157 programs enrolled by the end of 2013.
In Phase 1 States, the total number of programs in the States’ TQRIS increased from 19,678 programs to 30,971 programs. This was a 57 percent increase from baseline to the end of 2013. Seven of the nine Phase 1 grantees reported an increase in the number of programs enrolled in the State’s TQRIS. The number of programs decreased in one State (North Carolina) and remained constant in another State (Washington).
o North Carolina and Washington require licensed programs to participate in their TQRIS, which results in higher participation levels in TQRIS. For this reason the number of programs participating is not expected to increase significantly in these States.
o In 2013, the total number of regulated programs decreased in North Carolina so the number of programs eligible to be in the States’ TQRIS decreased.
o Washington reported the total number of sites that are eligible to participate in the TQRIS, so its numbers remain constant.
During their first reporting year, only one of the Phase 2 States (Illinois) showed an increase in early learning and development programs in the TQRIS, increasing from 778 to 12,734 programs. One State (New Mexico) reported no change in the number of programs in the TQRIS. Overall, the number of programs in Phase 2 States increased from 11,643 programs from baseline to 23,186 programs at the end of 2013.
Three Phase 2 grantees reported slight declines in programs in the States’ TQRIS. Reasons for decreases in the numbers of participating programs are complex and varied:
o Colorado and Oregon noted slight decreases as they transition from their current QRIS to their new TQRIS.
o
Wisconsin saw a decrease in the overall number of child care providers throughout 2013, due in part to rigorous YoungStar requirements, changing demographics, and reduction in workforce participation rates.See Appendix A, Table 1 for State-specific data.
Increasing the Number of Programs in the Top Two Tiers of the TQRIS
While States are making progress in getting more programs in their TQRIS, the process of rating these programs and supporting them in moving up through the state-defined tiers of quality takes considerable time and effort. During these initial years of their grants, many States are focused on enrolling more
programs first and then on enhancing their rating and monitoring systems in the coming months and years. As shown in figure 6, eight RTT-ELC States have five tiers or levels in their TQRIS. For these States the data presented in Figure 8 reflect the number of programs in tiers 4 and 5. Three States have 4 tiers, so their data reflect the number of programs in tiers 3 and 4. Two States (Colorado and Illinois) are transitioning from 4 to 5 tiers, so their data reflect the number of programs in tiers 3 and 4. Ohio is transitioning from 3 to 5 tiers, but in 2013 it had no programs in tier 5, so Ohio’s data are the number of programs in tiers 3 and 4. States set their own quality standards for the various levels in their TQRIS so, for example, a level 3 rating in one State is not necessarily equivalent to a level 3 rating in another State.
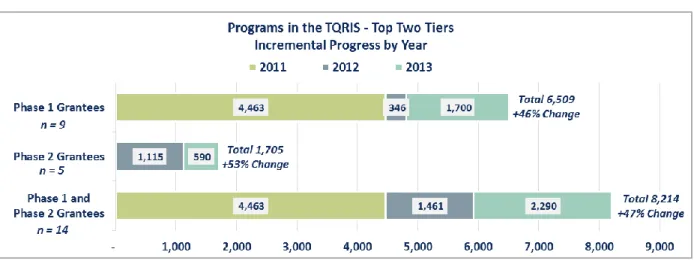
All 14 grantees combined showed a 47 percent increase from 5,578 programs in the top two tiers of their TQRIS from the baseline to 8,214 programs by the end of 2013.
Phase 1 grantees showed a 46 percent increase from 4,463 programs in the top two tiers of the States’ TQRIS from baseline to 6,509 programs by the end of 2013. Seven of the nine Phase 1 grantees reported increases in the number of programs in the top two tiers of their TQRIS. One grantee (Washington) reported a decline, due to program closures, and one grantee (Ohio) did not report baseline data with which to compare data at the end of 2013.
was due to one grantee (Wisconsin) that reported an increase in the number of programs in the top two tiers of their TQRIS. Two other grantees (Colorado and New Mexico) reported slight decreases and one grantee (Oregon) did not have baseline data with which to compare.
Source: 2013 APR Performance Measure B(4)(c)(1)
Figure 8.Number of Early Learning and Development Programs in the Top Two Tiers of the States’ TQRIS See Appendix A, Table 2 for State-specific data and additional data notes from the grantees’ APRs.
Increasing Access to High-Quality Programs for Children with High Needs
Families often struggle to find early learning and development programs that are affordable, are of high quality, and meet their needs. RTT-ELC States are using innovative strategies to inform parents of the availability of high-quality early learning and development programs in their communities. One of the key goals of the RTT-ELC program is to increase the number of children with high needs who are enrolled in high-quality programs. States are measuring their progress by collecting data on the
number of children who are enrolled in programs that are in the top tiers of the State’s TQRIS. Figures 9 through 11 present data on the number of children with high needs who are in State-funded preschools, CCDF-funded programs, and Head Start and Early Head Start programs that are in the top two tiers of States’ TQRIS. The numbers of children are reported by type of program. Children may be enrolled in more than one of these programs and States do not have unduplicated counts of children in their TQRIS. States are struggling to define how many discrete children are served by the programs in their TQRIS.
Children with high needs enrolled in State-funded preschool programsin the top tiers of the TQRIS • Overall, the Phase 1 and Phase 2 grantees showed a 175 percent increase in the number of children
with high needs in State-funded preschool programs in the top tiers of the States’ TQRIS between the time of their applications (baseline) and the end of 2013. The number of children increased from 36,732 to 101,095. Many States are still working through the issues related to the implementation of their statewide TQRIS for State-funded preschool programs; therefore, the numbers of such programs in State TQRIS is expected to increase in future years.
• Six of the nine Phase 1 grantees reported increases in the number of children with high needs enrolled in State-funded preschool programs in the top tiers. These States reported an increase from 28,646 children to 77,912 children by the end of 2013, a 172 percent increase from baseline (the application year) to the end of 2013. One State (Maryland) reported a decrease, and another State (Ohio) did not report data as their publicly-funded preschool programs began the rating process during the 2013-2014 school year.
• Phase 2 grantees were just beginning to focus on enrolling their State-funded preschool programs in the States’ TQRIS. Only one State
(Colorado) reported baseline and 2013 data on the number of children with high needs in the top tiers of their State-funded preschool programs, and it reported a slight decrease. Three States (New Mexico, Oregon and Wisconsin) did not report data in 2013 due to a variety of factors, including data collection issues and transitions to new TQRIS. By the end of 2013, there were 23,183 children with high needs in the top tiers of their State-funded preschool programs in Phase 2 States.
Source: 2013 APR Performance Measure B(4)(c)(2)
Figure 9. Number of Children with High Needs Enrolled in State-Funded Preschool Programs That Are in the Top Tiers of the States’ TQRIS.
State-specific data on the number of children with high needs enrolled in high-quality State-funded preschool programs are included in Appendix B. Grantees also included specific information related to their data in the “data notes” sections of their APRs; relevant data notes are also included as footnotes to the data tables in Appendix B, Table 3.
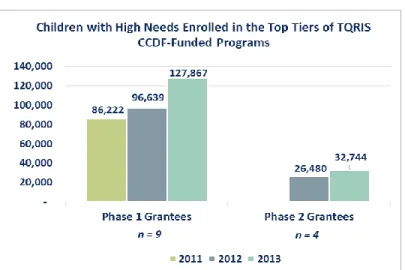
Children with high needs enrolled in CCDF-funded programs in the top tiers of the TQRIS • Overall, the RTT-ELC grantees
showed a 43 percent increase in the number of children with high needs enrolled in CCDF-funded programs in the top tiers of the TQRIS from baseline to the end of 2013. The numbers increased from 112,702 to 160,611 children.
• Phase 1 Grantees showed a 48 percent increase in the number of children with high needs enrolled in CCDF-funded programs in the top tiers from baseline to the end of 2013, with an increase from 86,222 to 127,867 children. Eight of the nine Phase 1 grantees reported an
increase in the number of children in CCDF-funded programs in the top tiers of the State’s TQRIS. One State (North Carolina)reported a decrease due to a decline in the total number of CCDF-funded programs.
• Three of the five Phase 2 grantees showed a total increase from 26,480 to 32,744 children with high needs in CCDF-funded programs in the top tiers from baseline to the end of 2013 – a 24 percent increase. One State (Oregon) did not report baseline data, and another State (Colorado) did not report data for this category because its current data collection methods do not allow for reporting specific data for children with high needs enrolled in CCDF-funded programs.
Source: 2013 APR Performance Measure B(4)(c)(2)
Figure 10. Number of Children with High Needs Enrolled in CCDF-Funded Programs That Are in the Top Tiers of the States’ TQRIS.
State-specific data and additional information from APR data notes about the number of children with high needs enrolled in high-quality CCDF-funded programs are included in Appendix B, Table 4.
Source: 2013 APR Performance Measure B(4)(c)(2)
Figure 11. Number of Children with High Needs Enrolled in Early Head Start and Head Start Programs That Are in the Top Tiers of the States’
Children with high needs enrolled in Early Head Start and Head Start programs in the top tiers of the TQRIS
• Overall, the RTT-ELC grantees showed an 83 percent increase in the number of children with high needs enrolled in Early Head Start and Head Start Programs in the top tiers of the TQRIS. The numbers increased from 56,262 children at baseline to 102,728 at the end of 2013. All nine of the Phase 1 grantees showed
an increase in the number of children with high needs in Early Head Start and Head Start programs in the top tiers of
the TQRIS. Overall the Phase 1 grantees reported an increase from 44,469 to 91,691 children at the end of 2013 – an increase of 106 percent.
Overall, Phase 2 grantees showed a decrease of 6 percent in the number of children with high needs in Early Head Start and Head Start programs that are in the top tiers of the TQRIS. The numbers decreased from 11,793 children at baseline to 11,037 children at the end of 2013. Much of this decrease was attributed to one State (Colorado) resolving duplicated counts of programs in their baseline number. One State (New Mexico) reported a slight decrease, which the State attributed in part to the impact of sequestration. One Phase 2 State (Wisconsin) reported an increase of 551 children for this performance measure. One State (Illinois) did not report baseline data with which to compare, and one State
(Oregon) did not report data as it is revising its TQRIS.
o Illinois encountered delays in developing a process for including Head Start and Early Head Start programs in the State’s TQRIS, so they did not report baseline data.
o Oregon is launching a revised TQRIS. Many Head Start programs are exempt from State licensing but are interested in becoming licensed and applying for a star rating.
State-specific data and information from APR data notes about the number of children with high needs enrolled in high-quality Early Head Start and Head Start programs are included in Appendix B, Table 5.
Spotlight on States
The following are examples from the 2013 State Annual Performance Reports.
RTT-ELC States are increasing the number of early learning and development programs participating in their TQRIS.
Increasing the number of early learning and development programs in a State's TQRIS requires thoughtful planning and a multipronged approach. States that link the TQRIS system to their licensing system or States that have had a TQRIS system for a number of years have a significantly larger number of programs participating in their TQRIS.
Maryland began field testing their EXCELS TQRIS Program Standards in November 2012. The 330 programs in the field test represented center-based child care, family child care homes, public Pre-Kindergarten, and school-age child care programs that volunteered to participate and test the online system. These programs provided valuable feedback by participating in surveys and focus groups. On July 1, 2013, Maryland EXCELS TQRIS opened for statewide participation. The number of programs participating grew from 330 to 1,579 from July 1, 2013 to December 31, 2013. Also, as of December 31, 2013, 221 programs had published their ratings on the EXCELS website. As the evaluation of information gained from the field test was reviewed, the decision was made to enter into a revision phase of the Program Standards. The revised Program Standards have been
released for comment, reviewed by early childhood and child care stakeholder groups, national experts and technical assistance providers. Programs currently participating or published in
States that is using financial incentives, training, and technical assistance to promote quality improvements, like meeting Maryland’s revised program standards, in the programs in their TQRIS.
Once programs are enrolled in a State’s TQRIS, the State helps them improve their quality and their ranking. States are providing technical assistance, professional development opportunities, and program improvement grants that allow programs to make the necessary quality improvements.
Rhode Island is providing significant support to early learning and development programs that are committed to continuous quality improvement. The State makes Program Quality Improvement grants available to eligible programs that have a rating in BrightStars, the State’s TQRIS. In 2013, Rhode Island also provided a grant opportunity to family child care programs, which qualified for up to $5,000, and to child care centers, which qualified for up to $30,000. Funds could be used for quality improvements designed to increase ratings, such as helping staff meet competency requirements or advancing teaching practices that support learning and development outcomes for children. A total of
$554,850 was awarded to 93 programs, including 12 public schools, 56 family child care programs, and 25 child care centers.
Washington has developed a strong coaching model for early childhood programs that are rated at levels three to five in the TQRIS. In addition, more intense coaching is offered to programs receiving a rating of one or two in the TQRIS to ensure that these programs receive the
appropriate amount of coaching necessary to increase quality. Additionally, Washington is building a virtual coaching model that will complement on-site coaching work. As part of this virtual model, participants will be able to view and upload videos that demonstrate progress toward quality improvement goals.
All RTT-ELC States are working to increase access for all families to programs that are in the highest tiers of their TQRIS.
Families often struggle to find early learning programs that are affordable, are of high quality, and meet their needs. RTT-ELC States are using creative strategies to inform parents of the availability of high-quality early learning and development programs in their communities.
Minnesota is taking two approaches to helping families with low incomes find high-quality early learning programs for their children. First, it is making scholarships of up to $5,000 per child available to families who are income eligible who choose a program that is participating in Parent Aware, the State’s TQRIS. These scholarships have spurred stronger interest among programs in the State’s TQRIS. Second, Minnesota has established a new Child Care Assistance Program policy that makes 3- and 4-star-rated child care programs eligible for higher reimbursement rates from the State.
North Carolina has made a long-term commitment to ensuring that publicly funded programs are providing high-quality settings for young children. The TQRIS is tied to licensing, which means all licensed programs are automatically enrolled at the one star level. All Head Start and Early Head Start programs in the State are licensed and participate in the TQRIS. While school districts are not required to be licensed, all except two districts voluntarily participate in the TQRIS. A law is now in effect that requires all preschool programs become licensed.
All RTT-ELC States are working to streamline the rating and monitoring of early learning and development programs in their TQRIS.
States face many challenges in developing a rating and monitoring process for their TQRIS. Providers must be informed about the process, so as to make them more likely to participate. The observation and rating tool must be a true measure of different levels of quality; it must give the same rating results in many different settings, and it has to be easy to use.
California established a Rating and Monitoring workgroup, which used guidelines established by the developers of the rating tools that California uses to help ensure that all raters were getting similar results. User-friendly assessment report formats and support materials have been developed for TQRIS participants to further ensure their understanding of the overall rating process. An Implementation Guide clarifies site selection and rating criteria to ensure successful and consistent rating of programs.
Ohio understands the key role that valid and reliable program quality assessment tools play in the rating and monitoring process of a TQRIS. The State created the Ohio Classroom Observation Tool (OCOT) to assess the quality of the classroom environment and staff-child interactions for
programs that received a 3- to 5-star rating as part of their TQRIS verification process. Staff who complete the OCOT have undergone extensive training and have established reliability in the use of the tool. Ohio will continue to analyze OCOT data, along with data from similar tools completed concurrently with the OCOT, to further document its validity as a measure of classroom quality. All RTT-ELC States are making progress in validating their TQRIS.
Validating the effectiveness of a TQRIS ensures that it is measuring and assessing program quality in ways that make sense to State policy makers, early learning programs, and families with young children.
To prepare for its validation study, Delaware sought extensive input from all key stakeholders for the TQRIS, including elected and appointed officials, policy makers, community foundations, business leaders, advocates, technical assistance and professional development leaders, and early childhood program providers on the State's evaluation questions. Delaware used this information to clarify and prioritize its TQRIS evaluation questions, award a contract for the evaluation study beginning in January 2014, and to establish an Evaluation Committee. Some States are enhancing their TQRIS data systems and collection methods.
RTT-ELC States are developing data system linkages between their tiered quality rating and improvement systems and other systems with data on young children and the early childhood workforce.
Colorado has begun the process of enhancing its TQRIS to link to other State data systems, including its early childhood professional development registry and quality incentives grants system to ensure interoperability among the three systems. The enhanced system will streamline the process for early childhood programs as they work to advance to higher levels of quality and individuals in the workforce as they track their educational advancement. Also, Colorado is undergoing a data mapping process to ensure that the data elements included in the enhanced TQRIS align with the National Registry Alliance and the Common Education Data Standardsxii –
both of which represent examples of standardized early childhood data elements, definitions, and recommended relationship data models.
Some States are prioritizing investments in a better functioning TQRIS data system.
Wisconsin found that further improvements and additional systemic investments were needed to ensure the consistency and accuracy of TQRIS data entry, which, in turn, are needed to ensure the validity and reliability of the ratings. In response, the Wisconsin team selected an online data system to support its TQRIS raters in observing program environments. This system uses a tablet to automate data entry and subsequent report writing. Once implemented, the system is expected to increase the accuracy and speed of YoungStar environment ratings.
SUPPORTING THE EARLY CHILDHOOD
EDUCATION WORKFORCE
Corresponds to RTT-ELC Focused Investment Area D
There is a difference between playing “Ring Around the Rosie” with 3-year-olds during the day solely because the children enjoy it, and intentionally planning to play “Ring around the Rosie” based on the knowledge that 3-year-olds are capable of cooperating; they learn language and literacy through rhyming; and they can pick themselves up after deliberately falling down. The activity looks the same to parents and feels the same to the children. But over time, planned activities will build on a child’s developing skills and knowledge, and will encourage more growth in all areas of development. With this development, children are more likely to arrive at kindergarten with the skills, knowledge, and dispositions toward learning they need to be successful in school and in life.
The RTT-ELC program requires all 14 States to address how they will support a great early childhood education workforce. A well-trained and properly supported early childhood education workforce understands how to provide high-quality early learning experiences for young children. It is an essential element of high-quality early learning and education programs.
A Workforce Knowledge and Competency Framework outlines what early childhood educators should know and be able to teach young children.xiii It provides the foundation for a well-qualified and prepared
mentoring, and coaching in the community. The Framework should also support individual professional development efforts for early childhood educators. As they move from a Child Development Associate (CDA) credential or State credential, to an associate degree, to a bachelor’s degree and beyond, early childhood educators should be building on commonly defined, previously learned information and skills. Ten States (Colorado, Delaware, Maryland, Minnesota, New Mexico, Ohio, Oregon, Rhode Island, Washington, and Wisconsin) chose to address Focused Investment Area (D)(1), for which States were required to report progress on the development of a Workforce Knowledge and Competency Framework. They chose to address the development of a common, statewide progression of credentials and degrees that were aligned with the framework.
Figure 12. Supporting a Great Early Childhood Education Workforce
Eleven States (California, Colorado, Delaware, Illinois, Maryland, Massachusetts, Minnesota, New Mexico, North Carolina, Oregon, and Rhode Island) chose to spend RTT-ELC funds on Focused Investment Area (D)(2). These States documented the extent to which they had a high-quality plan to improve the effectiveness and retention of early childhood educators who work with children with high needs. States described two basic strategies:
(1) States are providing and expanding access to professional development opportunities that are aligned with their Workforce Knowledge and Competency Framework and that tightly link training with professional development approaches, such as coaching and mentoring.
(2) States are using incentives such as scholarships, compensation and wage supplements, tiered reimbursement rates, other financial incentives, and other strategies such as management
opportunities to promote professional improvement and career advancement along an articulated career pathway that is based on the State's Workforce Knowledge and Competency Framework (see figure 13).
Figure 13. Workforce Policies and Incentives in RTT-ELC States
States that chose (D)(2) must demonstrate that more early childhood educators are receiving training in postsecondary institutions and community-based professional development programs whose curricula are aligned with the Frameworks (see figure 14 for performance measure D(2)(d)1) on the next page).
States that chose (D)(2) also must document that more postsecondary institutions and community-based professional development programs are aligning their curricula with the State’s Framework (performance measure D(2)(d)(2)).
States like Maryland, Minnesota, and North Carolina with declines in numbers attributed the change to improvements in data collection methods that resulted in eliminating duplicated records, delays in getting current graduation information from institutions of higher education, and backlogs in entering
Source: RTT-ELC 2013 APR. Performance measure (D)(2)(d)(1). Rhode Island did not report 2011 baseline data. Ohio, Washington, and Wisconsin did not select this Focused Investment Area.
Figure 14: Number of Early Childhood Educators in Professional Development Programs or Postsecondary Institutions That Are Aligned with Workforce Knowledge and Competency Frameworks
Eleven States reported data for performance measure D(2)(d)(1)(figure 14) about the number of early childhood educators who were credentialed by postsecondary institutions or professional development providers that are aligned to the States’ Workforce Knowledge and Competency Framework. Six of the States (California, Colorado, Illinois, Minnesota, New Mexico, and Oregon) reported an increase in the number of credentialed early childhood educators from baseline to the end of 2013. Three States reported decreases (Maryland, Massachusetts, and North Carolina) and one state remained constant (Delaware).
Spotlight on States
The following are examples from the 2013 State Annual Performance Reports.
The 11 RTT-ELC States that chose to focus on(D)(1) reported making progress in establishing a common statewide progression of credentials and aligning postsecondary coursework and credentials with the State’s Workforce Knowledge and Competency Framework.
States have identified the importance of collaborating at the State level to help ensure that early childhood educators throughout the State receive consistent professional learning opportunities.
In some RTT-ELC States, the community colleges are working together to give early childhood educators common experiences that are tied to the State framework.
In Colorado, 17 community colleges in the Colorado Early Childhood Family Coalition are working to align the community college early childhood certificate and degree programs with the State’s early childhood competencies framework.
Oregon community colleges are creating an early childhood certificate that would consist of the same number of credits at all colleges, would link to the State registry. This certificate could be applied toward an associate degree. Oregon is also working to align coursework to its Core Body of Knowledge workforce standards and National Association for the Education of Young Children (NAEYC) standards.
Other States are focused on the importance of the unique educational requirements for professionals working with young children.
New Mexico is implementing two new early childhood teacher pathways within the formal early childhood licensing system. It is dividing the current birth through age 8 license into two licenses: birth through age 4, and age 3 through third grade. The State also fully implemented the new Family Infant Toddler career pathway with corresponding associate and bachelor’s degree certification.
Rhode Island finalized Workforce Knowledge and Competencies for teachers (including early childhood special educators), teacher assistants, and family child care providers. Rhode Island awarded a contract to implement a new Professional Development/Technical Assistance Center which will align professional development with the Rhode Island Workforce Knowledge and Competencies and expand professional development opportunities to the current workforce. Illinois is providing opportunities and incentives for early childhood educators to advance through Illinois’ career pathway, referred to as their Gateway to Opportunity professional development system. The credentials can be earned by completing an approved program at an approved college or university that has aligned its program to the State’s professional development framework. Wisconsin is developing a cross-sector coordinated professional development approach at the State level.
In Wisconsin, a professional development coordinator acts as an “air traffic controller” for professional development in the State. The coordinator organizes professional development activities to avoid overlap and conflict, maximize resource usage, and maximize coordination of professional development offerings and opportunities across sectors. In addition, the professional development coordinator provides planning support, manages the new Professional Development Portfolio, and supports cross-sector networking activities.
The 11 RTT-ELC States that chose to focus on (D)(2) reported making progress in improving the effectiveness and retention of early childhood educators who work with children with high needs. States described how they were supporting the early childhood education workforce with professional development opportunities. States are using scholarships, compensation and wage supplements, tiered reimbursement rates and other financial incentives; and management opportunities to promote professional and career advancement.
Between 2012 and 2015,Massachusetts is funding three cohorts of 15 experienced early
childhood educators to complete a 12 credit Post Master’s Certificate program in Early Education Research, Policy, and Leadership. The goal of this advanced graduate program is to provide Master’s-educated professionals with the advanced leadership skills they need to serve as future
blended format, with approximately half of the classes taking place online. The format of these course offerings will allow educators to advance their leadership skills on a schedule that meets their needs as active teaching professionals. The State will cover the full cost of tuition, fees, and books, as well as provide each student with a stipend.
Some States are coordinating the types of education and professional development experiences that early childhood educators receive in the State.
Ohio is focusing on bringing common professional development standards to the early childhood educators in the State. Child care providers and the State’s two-year higher education institutions have been using an Early Childhood Core Knowledge and Competencies (CKC) framework and a CKC Instructor Guide to prepare pre-service teachers. However, district preschool programs and Ohio's four-year higher education institutions have primarily used the Ohio K12 Educator
Standards rather than Ohio's CKC. This means that two early childhood educators who work in the same setting may have received very different training, one based on K-12 standards and the other early childhood standards. At the
direction of RTT-ELC leadership team, external consultants drafted a bridging document for CKC and K-12 educator standards that would bring these two sets of standards into alignment. Ohio has developed a plan to review and revise the CKC and ensure that the materials are utilized by professional development providers, institutions of higher education, and local program providers in all sectors.
A challenging and all too familiar issue for the early learning field is retaining qualified staff. Two examples of States that are having difficulty recruiting and retaining staff are California and New Mexico.
In California, difficulty in hiring qualified coaches has led to a delay in implementing some of their planned TQRIS continuous quality improvement activities. California’s hiring challenges were due in part to a lack of available highly qualified personnel, as well as county hiring restrictions. Many of the consortia in California’s State RTT-ELC project attempted to overcome these challenges by collaborating with partner agencies to share in coaching responsibilities. However, several consortia experienced challenges in creating supports for training and supervision and in maintaining standards of quality across different agencies.
In New Mexico, high turnover of early childhood educators and consultants has made sustainability difficult. Inability to support higher wages, attractive offers in other States, challenging financial times, and program management challenges have all contributed to staff turnover. One strategy that New Mexico is using to address this problem is making scholarships available to prospective early childhood consultants and faculty. The State is also implementing Leadership Academies to improve retention and compensation for program administrators.