Approved April 2013
International Association of Assessing Officers
The assessment standards set forth herein represent a consensus in the assessing profession and have been adopted by the Executive Board of the International Association of Assessing Officers. The objective of these standards is to provide a systematic means by which concerned assessing officers can improve and standardize the operation of their offices. The standards presented here are advisory in nature and the use of or compliance with such standards is purely voluntary. If any portion of these standards is found to be in conflict with the Uniform Standards of Professional Appraisal Practice (USPAP) or state laws, USPAP and state laws shall govern.
Standard on
Ratio Studies
At the time of the adoption of the standard by the IAAO Executive Board, the IAAO Technical Standards Committee was composed of Chair Bill Marchand; Alan Dornfest, AAS; Mary Reavey; Michael Prestridge, Dennis Deegear, Doug Warr, AAS; Chris Bennett, Staff Liaison.
The standard benefited from revisions by Robert Gloudemans and the 2011 and 2012 Technical Standard Committees. The standard benefited from review and comment by Robert Denne, Patrick O'Connor, and Pete Davis.
Published by
International Association of Assessing Officers 314 W 10th St
Kansas City, Missouri 64105-1616 816/701-8100
Fax: 816/701-8149 http://www.iaao.org ISBN 978-0-88329-208-2
Copyright © 2013 by the International Association of Assessing Officers All rights reserved.
No part of this publication may be reproduced in any form, in an electronic retrieval system or otherwise, without the prior written permission of the
publisher. However, assessors wishing to use this standard for educating legislators and policymakers may photocopy it for limited distribution. Printed in the United States of America.
Part 1. Guidance for Local Jurisdictions ... 7
1. Scope ...7
2. Overview ...7
2.1 The Concepts of Market Value and Appraisal Accuracy ...7
2.2 Aspects of Appraisal Performance ...7
2.3 Uses of Ratio Studies ...7
2.4 Applicability ...8
3. Steps in Ratio Studies ...8
3.1 Definition of Purpose, Scope and Objectives ...8
3.2 Design (rev. March-2013) ...8
3.2.1 Level of Sophistication and Detail ...8
3.2.2 Sampling ...8
3.2.2.1 Limitations of Sale Samples ...8
3.2.2.2 Data Accuracy and Integrity ...9
3.3 Stratification ...9
3.4 Collection and Preparation of Market Data ...9
3.5 Matching of Appraisal and Market Data (rev. Jan-2010) ...9
3.6 Statistical Analysis (rev. March-2013) ...9
3.7 Evaluation and Use of Results (rev. March-2013) ...10
4. Timing and Sample Selection ...10
4.1 Data Requirements and Availability ...10
4.1.1 Nature of the Population ...10
4.1.2 Assessment Information ...10
4.1.3 Indicators of Market Value ...10
4.1.4 Property Characteristics ...10
4.2 Frequency of Ratio Studies ...10
4.3 Date of Analysis ...10
4.4 Period from Which Sales Are Drawn ...10
4.5 Sample Representativeness (rev. March-2013) ... 11
4.6 Acquisitions and Validation of Sales Data ... 11
5. Ratio Study Statistics and Analyses (rev. March-2013) ... 11
5.1 Data Displays ... 11
5.2 Outlier Ratios (rev. March-2013) ...12
5.3 Measures of Appraisal Level ...13
5.3.1 Median ...13
5.3.2 Arithmetic Mean ...13
5.3.3 Weighted Mean ...13
5.3.4 Contrasting Measures of Appraisal Level ...13
5.4 Measures of Variability ...13
5.4.1 Coefficient of Dispersion ...13
5.4.2 Other Measures of Variability ...14
5.5 Measures of Reliability ...14
5.6 Vertical Inequities (rev. March-2013) ...14
5.7 Tests of Hypotheses (rev. March-2012) ...15
5.8 The Normal Distribution ...15
5.9 Parametric and Distribution-Free (Nonparametric) Statistics ...15
6. Sample Size ...16
6.1 Importance of Sample Size ...16
6.2 Adequacy of a Given Sample Size ...16
6.3 Required Sample Size ...16
6.4 Remedies for Inadequate Samples ...16
6.5 Other Sample Size-Related Representativeness Problems ...16
7. Reconciliation of Ratio Study Performance Measures ...16
8. Presentation of Findings, Documentation, and Training ...16
8.1 Text ...16
8.4 Documentation ...17
8.5 Training and Education ...17
9. Ratio Study Standards ...17
9.1 Level of Appraisal (rev. March-2012) ...17
9.1.1 Purpose of Level-of-Appraisal Standard ...18
9.1.2 Confidence Intervals in Conjunction with Performance Standards ...18
9.2 Appraisal Uniformity (rev. March-2012) ...18
9.2.1 Uniformity among Strata ...18
9.2.2 Uniformity among Single-Family Residential Properties ...19
9.2.3 Uniformity among Income-Producing Properties ...19
9.2.4 Uniformity among Unimproved Properties ...19
9.2.5 Uniformity among Rural Residential and Seasonal Properties, Manufactured Housing, and Multifamily Dwellings ...19
9.2.6 Uniformity among Other Properties ...19
9.2.7 Vertical Equity ...19
9.2.8 Alternative Uniformity Standards ...19
9.3 Natural Disasters and Ratio Study Standards ...19
10. Personal Property Ratio Studies ...20
Part 2. Equalization and Performance Monitoring ... 21
1. Scope ...21
2. Oversight Ratio Studies ...21
2.1 Monitoring of Appraisal Performance ...21
2.2 Equalization ...21
2.2.1 Direct Equalization ...21
2.2.2 Indirect Equalization ...22
3. Steps in Ratio Studies ...22
3.1 Definition of Purpose, Scope and Objectives ...22
3.2 Design of Study ...22
3.2.1 Level of Sophistication and Detail ...22
3.2.2 Sampling ...23
3.2.3 Determining the Composition of Samples ...23
3.2.3.1 Sale Samples ...23
3.2.3.2 Independent Appraisal Samples ...23
3.2.3.3 Samples Combining Sales and Independent Appraisals ...23
3.3 Collection and Preparation of Market Data ...23
3.4 Stratification ...23
3.5 Matching Appraisal Data and Market Data (rev. Jan-2010) ...24
3.5.1 Stratification for Equalization Studies ...24
3.5.2 Stratification for Direct Equalization ...24
3.5.3 Stratification for Indirect Equalization ...24
3.6 Statistical Analysis ...25
3.7 Evaluation and Use of Results ...25
4. Timing and Sample Selection ...25
4.1 Date of Analysis ...25
4.2 Representativeness of Samples ...25
4.2.1 Maximizing Representativeness with Independent Appraisals ... 26
4.2.2 Very-High-Value Properties ...26
5. Acquisition and Analysis of Sales Data ...26
5.1 Sale Adjustments for Statutorily Imposed Value Constraints ...26
5.2 Outlier Ratios (rev. March-2013) ...27
5.2.1 Value Outliers ...27
5.2.2 Outlier Trimming ...27
6. Ratio Study Statistics and Analyses ...27
6.1 Measures of Appraisal Level ...27
6.2 Overall Ratio for Combined Strata (rev. March-2012) ...27
6.5 Measures of Reliability ...29
6.6 Vertical Inequities (rev. March-2013) ...29
6.7 Test of Hypotheses ...29
6.8 The Normal Distribution ...29
7. Sample Size ...30
7.1 Importance of Sample Size ...30
7.2 Adequacy of a Given Sample Size ...30
7.3 Required Sample Size ...30
7.4 Remedies for Inadequate Samples ...30
7.5 History of Sales Reporting ...30
8. Appraisal Ratio Studies ...30
8.1 Rationale ...30
8.2 Advantages and Disadvantages ...30
8.3 Sample Selection and Resource Requirements ...31
8.4 Data Requirements and Appraisal Techniques ...31
8.5 Appraisal Chasing ...32
8.6 Reviewing of Appraisals ...32
8.7 Combining of Sales and Appraisals ...32
8.8 Average Unit Value Comparisons ...32
9. Estimating Performance for Unsold Properties ...32
10. Presentation of Findings, Documentation, and Training (rev. Jan-2010) ...33
11. Ratio Study Standards (rev. March-2012) ...33
11.1 Level of Appraisal ...33
11.1.1 Purpose of Level-of-Appraisal Standard ...33
11.1.2 Recommended Appraisal Level Standards for Direct and Indirect Equalization ...34
11.1.3 Confidence Intervals in Conjunction with Performance Standards ...34
11.1.4 Decision Model ...34
11.1.5 Adjustments for High Variability and Small Samples ...35
11.1.6 Calculating Equalization Adjustments ...35
11.2 Appraisal Uniformity (rev. March-2013) ...35
11.2.1 Oversight Uniformity Standards ...35
11.2.2 Multi-level Uniformity Standards ...35
11.2.3 Uniformity among Strata ...36
11.2.4 Vertical Equity ...36
11.3 Natural Disasters and Ratio Study Standards ...36
12. Personal Property Studies ...37
12.1 The Performance Review ...37
12.1.1 Discovery ...37
12.1.2 Valuation ...37
12.1.3 Verification ...37
12.1.4 Forms and Renditions ...37
12.2 Appraisal Ratio Studies for Personal Property ...37
12.2.1 Assessment Ratio for Personal Property ...37
12.2.2 Stratification ...37
12.2.3 Property Escaping Assessment ...38
12.2.3.1 Identifying Personal Property Owners and Users Not in the Roll ....38
12.2.3.2 Identifying Personal Property Not Included in Taxpayer Returns/ Reports ...38
12.2.4 Computing the Level of Appraisal ...38
Definitions
(rev. March-2012) ... 39References
(rev. March-2012)... 45Additional Resources
... 45
A.2 Information Required ...47
A.3 Confirmation of Sales ...48
A.3.1 Importance of Confirmation ...48
A.3.2 Methods of Confirmation ...48
A.4 Screening Sales ...48
A.4.1 Sales Generally Invalid for Ratio Studies ...49
A.4.2 Sales with Special Conditions ...49
A.4.3 Multiple-Parcel Sales ...50
A.4.4 Acquisitions or Divestments by Large Property Owners ...50
A.4.5 IRS 1031 Exchanges ...50
A.4.6 Internet Marketing...50
A.4.7 Inaccurate Sale Data ...50
A.5 Adjustments to Sale Prices (rev. Jan-2010) ...50
A.5.1 Adjustments for Financing ...50
A.5.2 Adjustments for Assumed Leases ...51
A.5.3 Adjustments for Personal Property ...51
A.5.4 Adjustments for Time ...51
A.5.5 Other Adjustments ...52
A.5.6 Special Assessments ...52
Appendix B. Outlier Trimming Guidelines ... 53
B.1 Identification of Ratio Outliers (rev. March-2013) ...53
B.2 Scrutiny of Identified Outliers ...53
B.3 Outlier Trimming ...53
B.4 Trimming Limitations ...54
B.5 Analytical Use of Identified Outliers ...54
B.6 Reporting Trimmed Outliers and Results ...54
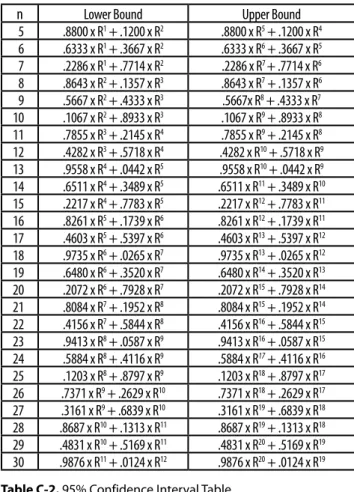
Appendix C. Median Confidence Interval Tables
for Small Samples
... 55
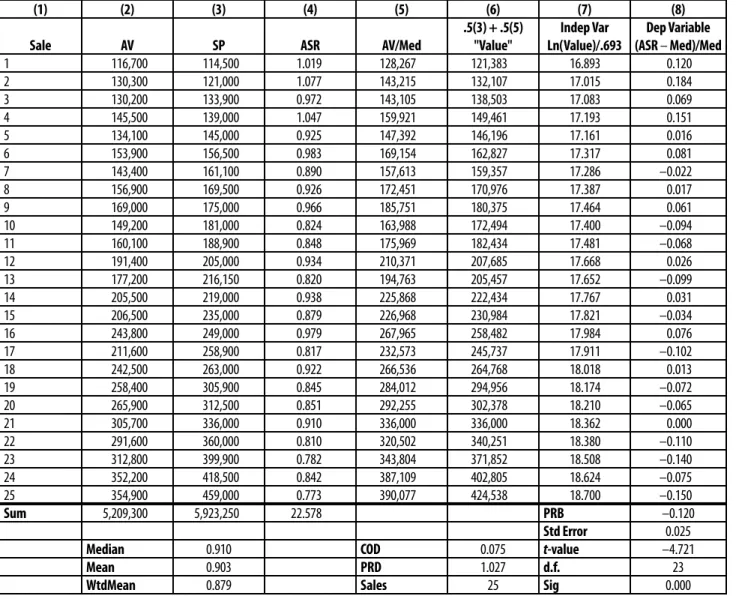
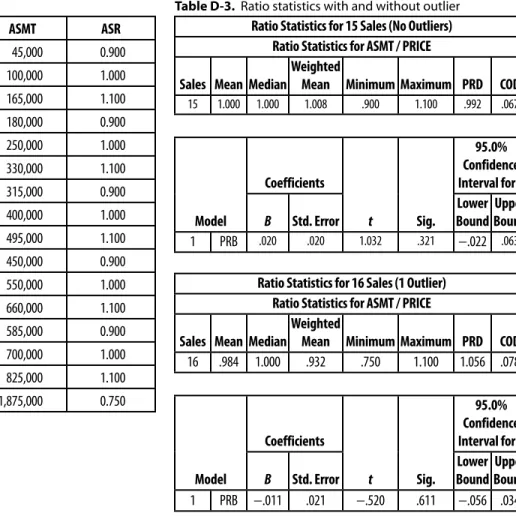
Appendix D. Coefficient of Price-Related Bias
(revised March-2013)... 56
Appendix E. Sales Chasing Detection Techniques ... 59
E.1 Comparison of Average Value Changes ...59
E.2 Comparison of Average Unit Values ...59
E.3 Split Sample Technique ...59
E.4 Comparison of Observed versus Expected Distribution of Ratios ...59
E.5 Mass Appraisal Techniques ...60
Appendix F. Alternative Uses for Ratio Study Statistics
... 61
Appendix G. Legal Aspects of Ratio Studies
... 61
This standard comprises two major parts. Part 1 focuses on the needs of local assessors. Part 2 presents guidelines for oversight agencies that use ratio studies for equalization and appraisal performance monitoring. The Definitions section explains the terms used in this standard. The ap-pendixes present many technical issues in greater detail. More information on many topics addressed in this stan-dard can be found in Property Appraisal and Assessment Administration (IAAO 1990, chapter 20) and in Gloude-mans (1999, chapter 5).
1. Scope
This part of the standard provides recommendations on the design, preparation, interpretation, and use of ratio studies for the real property quality assurance operations of an as-sessor’s office. Quality assurance/control measures include data integrity review, assessment level and uniformity analysis, and computer-assisted mass appraisal (CAMA) system performance testing, among others.
Assessors may have the opportunity to utilize ratio study information at a greater depth than oversight agencies. These internal studies can help improve appraisal methods or identify areas within the jurisdiction that need attention. External ratio studies conducted by oversight agencies (Part 2) focus more upon testing the assessor’s past per-formance in a few broad property categories.
2. Overview
For local jurisdictions, ratio study is used as a generic term for sales-based studies designed to evaluate appraisal performance. The term is used in preference to the term as-sessment ratio study because use of assessments can mask the true level of appraisal and confuse the measurement of appraisal uniformity when the legal assessment level is other than 100 percent of fair market value.
2.1 The Concepts of Market Value and
Appraisal Accuracy
Market value is the major focus of most mass appraisal assignments. The major responsibility of assessing offi-cers is estimating the market value of properties based on legal requirements or accepted appraisal definitions. The viability of the property tax depends largely on the accu-racy of such value estimates. The accuaccu-racy of appraisals made for assessment purposes is therefore of concern, not only to assessors but also to taxing authorities, property taxpayers, and elected representatives. Appraisal accuracy refers to the degree to whichproperties are appraised at
market value, as defined by professional standards (see Glossary for Property Appraisal and Assessment [IAAO 1997]) and legal requirements. While a single sale may provide an indication of the market value of the property in question, it cannot form the basis for a ratio study, which provides information about the market values of groups of properties. Dividing the appraised value by the sale price forms the ratios. The ratio can be multiplied by 100 and expressed as a percentage.
Market value is a concept in economic theory and can-not be observed directly. However, market values can be represented in ratio studies by sales prices (market prices) that have been confirmed, screened, and adjusted as nec-essary (see Appendix A, “Sales Validation Guidelines”). Sales prices provide the most objective estimates of market values and under normal circumstances should provide good indicators of market value.
2.2 Aspects of Appraisal Performance
There are two major aspects of appraisal accuracy: level and uniformity. Appraisal level refers to the overall ratio of appraised values to market values. Level measurements provide information about the degree to which goals or certain legal requirements are met. Uniformity refers to the degree to which properties are appraised at equal percentages of market value.
2.3 Uses of Ratio Studies
Key uses of ratio studies are as follows:
• measurement and evaluation of the level and uniformity of mass appraisal models
• internal quality assurance and identification of appraisal priorities
• determination of whether administrative or statutory standards have been met
• determination of time trends
• adjustment of appraised values between reappraisals
Assessors, appeal boards, taxpayers, and taxing authorities can use ratio studies to evaluate the fairness of funding distributions, the merits of class action claims, or the degree of discrimination (see Appendix G). However, ratio study statistics cannot be used to judge the level of appraisal of an individual parcel. Such statistics can be used to adjust assessed values on appealed properties to the common level.
Standard on Ratio Studies
2.4 Applicability
Local jurisdictions should use ratio studies as a primary mass appraisal testing procedure and their most important performance analysis tool. The ratio study can assist such jurisdictions in providing fair and equitable assessment of all property. Ratio studies provide a means for testing and evaluating mass appraisal valuation models to ensure that value estimates meet attainable standards of accuracy; see Uniform Standards of Professional Appraisal Prac-tice (USPAP) Standard Rule 6-6 (Appraisal Foundation 2010-2011). Ratio study reports are typically included as part of the written documentation used to communicate results of a mass appraisal and to comply with Standard Rule 6-7(b). Ratio studies also play an important role in judging whether constitutional uniformity requirements are met. Compliance with state or provincial performance standards should be verified by the local jurisdiction before value notices are sent to property owners.
3. Steps in Ratio Studies
Ratio studies generally involve the seven basic steps listed below.
1. define the purpose, scope and objectives 2. design
3. stratification
4. collection and preparation of market data 5. matching of appraisal and market data 6. statistical analysis
7. evaluation and use of results
3.1 Definition of the Purpose, Scope, and
Objectives
The first step in any ratio study is to determine and state clearly the reasons for the study. This crucial step of iden-tifying the purpose of the study determines the specific goals, scope, content, depth, and required flexibility.
3.2 Design
In the design of the study the assessor must consider the quantity of sale data and the resources available for con-ducting the ratio study. Although absolute accuracy cannot be ensured, all reasonable, cost-effective steps should be taken to maximize reliability.
The assessor should identify the following factors: • the groups or classes of properties to be included in
the study
• important legal, physical, and economic
characteristics of the properties selected for study • the quantity and quality of data available
• the values being tested and sales period being used • available resources, such as the number and
expertise of staff, computer hardware and software applications, and additional limiting conditions
3.2.1 Level of Sophistication and Detail
A basic design principle is to keep the study as simple as possible while consistent with its purpose. Ratio studies are not all alike and should be tailored to an intended use. Data analysis has been made easier through computer-ization. Although every study does not require the same level of statistical detail, each ratio study should include measures of appraisal level, appraisal uniformity, and statistical reliability. Graphs, charts, or other pictorial representations can be useful tools for showing distribu-tions and patterns in the data. There is no model ratio study design that can serve all jurisdictions or all situations equally well. Informed, reasoned judgment and common sense are required in the design of ratio studies.
3.2.2 Sampling
A ratio study is a form of applied statistics, because the analyst draws conclusions about the appraisal of the population (the entire jurisdiction) of properties based only on those that have sold during a given time period. The sales ratios constitute the sample that will be used to draw conclusions or inferences about the population. To determine the accuracy of appraisals with absolute certainty, it would be necessary for all properties in the population to have been sold in arm’s-length, open-market transfers near the appraisal date. Since this is not possible, ratio studies must use samples and draw inferences or conclusions about the population from these samples. The number of parcels in the population (the jurisdiction or stratum) is not an important determinant of a statistically valid and reliable sample.
3.2.2.1 Limitations of Sale Samples
Users of sales ratio studies should be aware of the follow-ing cautions associated with use of sale samples:
• Depending on the circumstances, sales prices can provide either useful or poor indications of market values. Sales must be screened to eliminate those that don’t meet the requirements of arm’s-length, open-market sales (see Standard on Verification and Adjustment of Sales [IAAO 2010]).
• Sales are not “randomly selected” from the
population, in the strict technical sense (see section 4.5, Sample Representativeness).
• Value-related characteristics of a sale sample may not represent all the value-related characteristics of the population.
• Adjustments to sale prices may be difficult to support or may be subjective.
3.2.2.2 Data Accuracy and Integrity
The findings of a ratio study can only be as accurate as the data used in the study. Personnel involved in collecting, screening, and adjusting sales data or making appraisals should be familiar with real estate conveyance practices in their region. They also should be proficient in the prin-ciples and practices of real estate appraisal and understand local market conditions.
Accuracy and integrity of data entered into or transferred through computer systems must be ensured. Design of com-puter programs should make it easy to verify data accuracy. Query tools should be accessible to users, so that data can be verified easily. Methods for checking the accuracy of assigned strata (such as school district, city, neighborhood, and category) as well as of assessed or appraised value, sale price, parcel identifier, and other fields must be established to reduce these and other nonsampling errors.
3.3 Stratification
Stratification divides all the properties within the scope of the study into two or more groups or strata. Stratifica-tion facilitates a more complete and detailed picture of appraisal performance and can enhance sample repre-sentativeness.
Each type of property subject to a distinct level of assess-ment could constitute a stratum. Other property groups, such as neighborhoods and age and size ranges, could constitute additional strata.
When the purpose of the study is to evaluate appraisal quality, flexibility in stratification is essential. The general goal is to identify areas in which the assessment levels are too low or lack uniformity and property groups for which additional reappraisal work may be required. In such cases, it also is highly desirable to stratify on the basis of more than one characteristic simultaneously.
Stratification can help identify differences in level of ap-praisal between property groups. In large jurisdictions, stratification by geographic areas is generally more ap-propriate for residential properties, while stratification of commercial properties by either geographic area or property subtypes (e.g., office, retail, and warehouse/in-dustrial) can be more effective.
3.4 Collection and Preparation of Market
Data
The reliability of a ratio study depends in part on how well the sales used in the study reflect market values. The underlying principle for review of sales data is to optimize the sample size, but at the same time to exclude sales that provide invalid indicators of market value. A ratio study
sample with fewer than five sales tends to have exception-ally poor reliability and is not very useful.
3.5 Matching of Appraisal and Market Data
The physical and legal characteristics of each property used in the ratio study must be the same as when sold. This implies two essential steps. First, the appraiser must ascertain whether the property descriptions match. If a parcel is split between the appraisal date and the sale date, a sale of any of its parts should not be used in the ratio study.Second, the appraiser must ascertain whether the property rights transferred, the permitted use, and the physical characteristics of the property on the date of assessment are the same as those on the date of sale. If the physical characteristics of the property have changed since the last appraisal, adjustments may be necessary before including the property in a ratio study. Properties with significant differences in these factors should be excluded from the ratio study.
When statutory constraints are imposed on appraisal methods, the resulting assessment may be less than market value. In such cases a sales ratio study may not provide use-ful performance information. Constraints typically apply to land that qualifies for agricultural use value, subsidized housing, mineral land, and timberland.
Sales may include property of a type other than the type for which the ratio study analysis is intended. However, sales including more than minimal values of secondary categories are unlikely to be representative, even with adjustment.
For example, a property that is predominantly commercial may include residential components. This sale can be included as representative of the commercial category. In this case, the numerator in the ratio calculation would be the total appraised value including the value of both the commercial and residential components.
In a second example, for a ratio study of vacant land, the numerator in the ratio should reflect only the appraised value of the land. The sale price should be adjusted for the contributory value of the improvements or the sample should be excluded from further analysis.
3.6 Statistical Analysis
After sales have been screened and matched against as-sessed values, ratios computed, and outliers identified and removed if appropriate, measures of appraisal level, uniformity, and reliability for the entire jurisdiction and each group or stratum should be computed. The sample also could undergo exploratory data analysis to reveal patterns or features of the data (Hoaglin, Mosteller, and Tukey 1983).
3.7 Evaluation and Use of Results
A properly designed ratio study is a powerful tool for analyzing appraisal performance, evaluating CAMA sys-tem models, and suggesting strategies for improvement. A ratio study also can identify weaknesses in appraisal system performance. Unexpected study results may indi-cate a need to respecify or recalibrate an appraisal model or to reevaluate the data elements used in the valuation process. However, users of ratio studies should recognize the inherent limitations of this tool, as follows:
1. A ratio study cannot provide perfect information about appraisal performance. Lack of sufficient sales, outliers, or overrepresentation of one geographic area or type of property can distort results.
2. Ratio study validity requires that sold and unsold parcels be appraised at the same level and in the same manner. Violation of this condition seriously undermines the validity of the study. 3. Findings should be used only in ways that are
consistent with the intended use(s) for which the study was designed.
4. Ratio study data are subject to statistical sampling errors and other processing (nonsampling) errors (see Lessler and Kalsbeek), but these limitations do not invalidate their use for informed decision-making.
4. Timing and Sample Selection
4.1 Data Requirements and Availability
The availability of data influences the design of the study and can call for revisions in the objectives of the study, limit the usefulness of the calculated statistics, or both.
4.1.1 Nature of the Population
The type of properties, market conditions, and composition of the population in terms of age, size, and value range are essential to the proper design of the study and interpreta-tion of the results. Very large properties that rarely sell (e.g., a large power plant) can be ignored in a ratio study designed to evaluate local appraisal performance.
4.1.2 Assessment Information
Appraised values are the numerators in the ratios used in a ratio study. Information about appraisal dates, legal re-quirements concerning reappraisals, the dates on which the appraisals were originally set, and the period they remained in effect is required for establishing the date of analysis.
4.1.3 Indicators of Market Value
Sale price, as an indicator of market value, is the denomi-nator in the calculation of the ratio. Specific information
about the date, amount, terms, and conditions of a sale is required for proper analysis.
4.1.4 Property Characteristics
Information on property characteristics is crucial for deter-mining whether property that was assessed is essentially the same as what was sold. Data for both sold and unsold properties should be current, relevant, and collected in a consistent manner.
4.2 Frequency of Ratio Studies
The purpose of a ratio study dictates how often it should be conducted. Regardless of the reappraisal cycle, ratio studies made by assessors should be conducted at least annually. This frequency enables potential problems to be recognized and corrected before they become serious. When there is a revaluation, assessors should conduct at least four ratio studies to establish the following:
1. a baseline of current appraisal performance 2. preliminary values so that any major deficiency
can be corrected
3. values used in assessment notices sent to taxpayers 4. final values after completion of the first, informal
phase of the appeals process
The final study can be used in planning for the following year. In addition, ratio studies can be conducted as needed to evaluate appraisal procedures, investigate a discrimina-tion complaint, or answer a specific quesdiscrimina-tion.
4.3 Date of Analysis
The date of analysis depends on the purpose of the study, but generally is the assessment date of the tax year being studied, which can be the current, the next, or a past year. The assessment date of the next tax year should be used when the purpose of the study is to evaluate preliminary values in a reappraisal.
4.4 Period from Which Sales Are Drawn
This period depends on the purpose of the study and on sales activity. In general, the period should be as short as possible and, ideally, no more than one year. A longer period may be required to produce a representative sample for some strata within a jurisdiction.
To develop an adequate sample size, the sales used in ratio studies can span a period of as long as five years provided there have been no significant economic shifts or changes to property characteristics and sales prices have been adjusted for time as necessary.
4.5 Sample Representativeness
In general, a ratio study is valid to the extent that the sample is sufficiently representative of the population.
The distribution of ratios in the population cannot be as-certained directly and appraisal accuracy can vary from property to property. By definition, a ratio study sample would be representative when the distribution of ratios of properties in the sample reflects the distribution of ratios of properties in the population. Representativeness is improved when the sample proportionately reflects major property characteristics present in the population of sold and unsold properties. As long as sold and unsold parcels are appraised in the same manner and the sample is otherwise representa-tive, statistics calculated in a sales ratio study can be used to infer appraisal performance for unsold parcels.
However, if parcels that sell are selectively reappraised based on their sale prices and if such parcels are in the ratio study, uniformity inferences will not be accurate (appraisals appear more uniform than they are). In this situation, measures of appraisal level also will not be supportable unless similar unsold parcels are appraised by a model that produces the same overall percentage of market value (appraisal level) as on the parcels that sold (see Appendix E, ”Sales Chasing Detection Techniques”). Assessing officials must incorporate a quality control pro-gram; including checks and audits of the data, to ensure that sold and unsold parcels are appraised at the same level. Operationally, representativeness is improved when the following occur:
1. Appraisal procedures used to value the sample parcels are similar to procedures used to value the corresponding population
2. Accuracy of recorded property characteristics data for sold property does not differ substantially from that of unsold property,
3. Sample properties are not unduly concentrated in certain areas or types of property whose appraisal levels differ from the general level of appraisal in the population
4. Sales have been appropriately screened and validated (see Appendix A).
The first requirement generally is met unless sampled parcels are valued or updated differently from nonsampled parcels, or unless appraisals of sample parcels were done at a different time than appraisals of nonsampled parcels. For example, it is unlikely that the sample is representa-tive of unsold parcels when the sample consists mostly of new construction, first-time sales of improved properties, condominium conversions, or newly platted lots. The second requirement is met only if value-related prop-erty characteristics are updated uniformly for all propprop-erty in a class as opposed to being updated only upon sale.
The third requirement relates to the extent to which ap-praisal performance for the sample reflects apap-praisal performance for the population.
The fourth requirement generally is met when the sales to be used in the sample are properly screened, adjusted if necessary, and validated.
4.6 Acquisition and Validation of Sales Data
Sales data are important in ratio studies and play a crucial role in any credible and efficient mass appraisal system. In some instances, it may be necessary to make adjust-ments to sales prices so they are more representative of the market. When there is more than one sale of the same property during a study period, only one of the transac-tions should be used in the ratio study. For guidelines on sales validation see Appendix A.5. Ratio Study Statistics and Analyses
Once data have been properly collected, reviewed, assem-bled, and adjusted, outlier handling and statistical analysis can begin. This process involves the following steps. 1. A ratio should be calculated for each observation
in the sample by dividing the appraised (or assessed) value by the sale price.
2. Graphs and exhibits can be developed that show the distribution of the ratios.
3. Exploratory data analysis, including outlier identification and screening, and tests of the hypotheses of normality may be conducted. 4. Ratio study statistics of both appraisal level and
uniformity should be calculated.
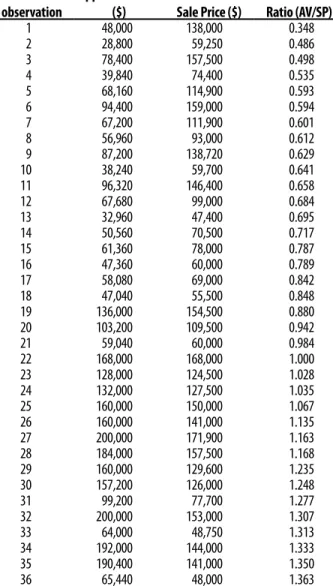
5. Reliability measures should be calculated. An example of a ratio study statistical analysis report is
given in table 1-1.
5.1 Data Displays
Displays or exhibits that provide a profile or picture of ratio study data are useful for illustrating general patterns and trends, particularly to nonstatisticians. The particular form of the displays, as well as the data used (e.g., sales prices, sales ratios, and property characteristics) depends on the purposes of the particular display. Types of displays useful in ratio studies are arrays, frequency distributions, histograms, plots, and maps (Gloudemans 1999). Graphic displays can be used to
• indicate whether a sample is sufficiently representative of the properties in a stratum • indicate the degree of nonnormality in the
distribution of ratios
• depict the degree of uniformity
• depict the degree of value bias (regressivity or progressivity)
• compare the level of appraisal or degree of uniformity among strata
• detect outlier ratios
• identify specific opportunities to improve mass appraisal performance
• track performance measures over time
5.2 Outlier Ratios
Outlier ratios are very low or high ratios as compared with other ratios in the sample. The validity of ratio study statistics used to make inferences about population param-eters could be compromised by the presence of outliers that distort the statistics computed from the sample. One extreme outlier can have a controlling influence over some statistical measures. However, some statistical measures, such as the median ratio, are resistant to the influence of outliers and trimming would not be required. Although the coefficient of dispersion (COD) is affected by extreme ratios, it is affected to a lesser extent than the coefficient of variation (COV) and the mean. The weighted mean and price-related differential (PRD) are sensitive to sales with high prices even if the ratios on higher priced sales do not appear unusual relative to other sales. Regression analysis, sometimes used in assessment ratio analyses (e.g., when ratios are regressed on sales prices or property charac-teristics, such as lot size or living area), is also affected by outliers: both ratio outliers and outliers based on the comparison characteristics (an excellent treatment of the assumptions made in regression and deviations from can be found in Cook, R.D. and Weisberg, S. 1982).
Outlier ratios can result from any of the following: 1. an erroneous sale price
2. a nonmarket sale
3. unusual market variability
4. a mismatch between the property sold and the property appraised
5. an error in the appraisal of an individual parcel 6. an error in the appraisal of a subgroup of parcels 7. any of a variety of transcription or data handling
errors
In preparing any ratio study, outliers should be 1. identified
2. scrutinized to validate the information and correct errors
3. trimmed if necessary to improve sample representativeness
Table 1-1. Example of Ratio Study Statistical Analysis Data Analyzed
Rank of ratio of
observation Appraised value ($) Sale Price ($) Ratio (AV/SP)
1 48,000 138,000 0.348
2 28,800 59,250 0.486
3 78,400 157,500 0.498
4 39,840 74,400 0.535
5 68,160 114,900 0.593
6 94,400 159,000 0.594
7 67,200 111,900 0.601
8 56,960 93,000 0.612
9 87,200 138,720 0.629
10 38,240 59,700 0.641
11 96,320 146,400 0.658
12 67,680 99,000 0.684
13 32,960 47,400 0.695
14 50,560 70,500 0.717
15 61,360 78,000 0.787
16 47,360 60,000 0.789
17 58,080 69,000 0.842
18 47,040 55,500 0.848
19 136,000 154,500 0.880
20 103,200 109,500 0.942
21 59,040 60,000 0.984
22 168,000 168,000 1.000
23 128,000 124,500 1.028
24 132,000 127,500 1.035
25 160,000 150,000 1.067
26 160,000 141,000 1.135
27 200,000 171,900 1.163
28 184,000 157,500 1.168
29 160,000 129,600 1.235
30 157,200 126,000 1.248
31 99,200 77,700 1.277
32 200,000 153,000 1.307
33 64,000 48,750 1.313
34 192,000 144,000 1.333
35 190,400 141,000 1.350
36 65,440 48,000 1.363
Note: Due to rounding, totals may not add to match those on fol-lowing table, which reports results of statistical analysis of above data.
Results of statistical analysis
Statistic Result
Number of observations in sample 36
Total appraised value $3,627,040
Total sale price $3,964,620
Average appraised value $100,751
Average sale price $110,128
Mean ratio 0.900
Median ratio 0.864
Weighted mean ratio 0.915
Coefficient of dispersion (COD) 29.8%
Price-related differential (PRD) 0.98
Price-related bias (PRB) coefficient (t-value) .232 (3.01)
95% median two-tailed confidence interval (0.684, 1.067)
95% weighted mean two-tailed confidence interval (0.806, 1.024)
Normal distribution of ratios (0.05 level of
significance) D’Agostino, Pearson Reject— K2,
and Shapiro-Wilk W
Date of analysis 9/99/9999
For guidelines on outlier identification and trimming, see Appendix B, “Outlier Trimming Guidelines.”
5.3 Measures of Appraisal Level
Estimates of appraisal level are based on measures of cen-tral tendency. They should be calculated for each stratum and for such aggregations of strata as may be appropri-ate. Several common measures of appraisal level (central tendency) should be calculated in ratio studies, including the median ratio, mean ratio, and weighted mean ratio. When one of these measures is calculated on the data in a sample, the result is a point estimate, which is accurate for the sample but is only one indicator of the level of appraisal in the population. Confidence intervals around the measures of level provide indicators of the reliability of the sample statistics as predictors of the overall level of appraisal of the population. Note that noncompliance with appraisal level standards cannot be determined without the use of confidence intervals or hypothesis tests.
5.3.1 Median
The median ratio is the middle ratio when the ratios are ar-rayed in order of magnitude. If there is an even number of ratios, the median is the average of the two middle ratios. The median always divides the data into two equal parts and is less affected by extreme ratios than the other measures of central tendency. Because of these properties, the median is the generally preferred measure of central tendency for evaluating overall appraisal level, determining reappraisal priorities, or evaluating the need for a reappraisal.
5.3.2 Arithmetic Mean
The arithmetic mean (aka mean or average) ratio is the average of the ratios. It is calculated by summing the ratios and dividing by the number of ratios. In a normal distribution the mean equals the median. In a distribution skewed to the right (typical of ratio study data), the mean is greater than the median. The mean is affected more by extreme ratios than the median.
5.3.3 Weighted Mean
The weighted mean ratio is the value-weighted average of the ratios in which the weights are proportional to the sales prices. The weighted mean also is the ratio of the average assessed value to the average sales price value. The weighted mean gives equal weight to each dollar of value in the sample, whereas the median and mean give equal weight to each parcel. The weighted mean is an important statistic in its own right and also is used in computing the PRD, a measure of uniformity between high- and low-value properties
The weighted mean also can be calculated by (1) summing the appraised values, (2) summing the sales prices, and
(3) dividing the first result by the second. The weighted mean also is called the aggregate ratio.
5.3.4 Contrasting Measures of Appraisal Level
Because it gives equal weight to each ratio and is unaffect-ed by extreme ratios, the munaffect-edian is the preferrunaffect-ed measure of central tendency for evaluating appraisal performance. Although the mean ratio is also a parcel-based measure, it can be affected appreciably by extreme ratios and can be relied upon only if the sample is of adequate size and contains few outliers.
5.4 Measures of Variability
Measures of dispersion or variability relate to the uni-formity of the ratios and should be calculated for each stratum in the study. In general, the smaller the measure, the better the uniformity, but extremely low measures can signal one of the following:
acceptable causes
• extremely homogeneous properties • very stable markets
unacceptable causes • lack of quality control • calculation errors
• poor sample representativeness • sales chasing
Note that as market activity changes or as the complexity of properties increases, the measures of variability usu-ally increase, even though appraisal procedures may be equally valid.
5.4.1 Coefficient of Dispersion
The most generally useful measure of variability or uniformity is the COD. The COD measures the average percentage deviation of the ratios from the median ratio and is calculated by the following steps:
1. subtract the median from each ratio 2. take the absolute value of the calculated
differences
3. sum the absolute differences
4. divide by the number of ratios to obtain the average absolute deviation
5. divide by the median 6. multiply by 100
The COD has the desirable feature that its interpretation does not depend on the assumption that the ratios are normally distributed. In general, more than half the ratios
fall within one COD of the median. The COD should not be calculated about the mean ratio.
5.4.2 Other Measures of Variability
Other useful measures of variability or the distribution of ratio study data are as follows:
• range • percentiles • quartiles
• interquartile range
• median absolute deviation (MAD) • median percent deviation
• coefficient of concentration • standard deviation
• coefficient of variation (COV) • weighted coefficient of dispersion • weighted coefficient of variation
See Property Appraisal and Assessment Administration (IAAO 1990, chapter 20) and Gloudemans (1999, chapter 5) for further discussion on these statistical measures. Note that the typical percentage error is not the COD, but is expressed by the median percentage deviation statistic. Also, it is the interquartile range, not the COD, that brack-ets the middle 50 percent of the assessment ratios.
5.5 Measures of Reliability
Reliability, in a statistical sense, concerns the degree of confidence that can be placed in a calculated statistic for a sample. (For example, how precisely does the sample median ratio approximate the population median appraisal ratio?) The primary measure of importance to the local assessor is the confidence interval. A confidence interval consists of two numbers (upper and lower limits) that bracket a calculated measure of central tendency for the sample; there is a specified degree of confidence that the calculated upper and lower limits bracket the true measure of central tendency for the population. See Appendix 20-4 in Property Appraisal and Assessment Administration (IAAO 1990) and Appendix C for guidelines on calculating small-sample confidence intervals.
New computer-intensive statistical methods, such as the “bootstrap” (Efron and Tibshirani 1993), now enable the development of confidence interval estimates for any statis-tic of interest, including measures of level and uniformity. Measures of reliability explicitly take into account the errors inherent in a sampling process. In general, these measures are tighter (better) when samples are relatively large and the uniformity of ratios is relatively good.
Measures of reliability indicate whether there is a desired degree of confidence that a given level of appraisal has not been achieved. This does not mean that an appraiser should tolerate measures of central tendency that fail to meet goals whenever measures of reliability are wide due to small samples, poor uniformity, or both. Such cases require either additional data for proper analysis or alterna-tive action, such as a reappraisal, if poor uniformity is the cause. Such correction might include reappraisal, trending of strata, and respecifying or recalibrating mass appraisal models (see section 9 in this part for a discussion of ratio study standards).
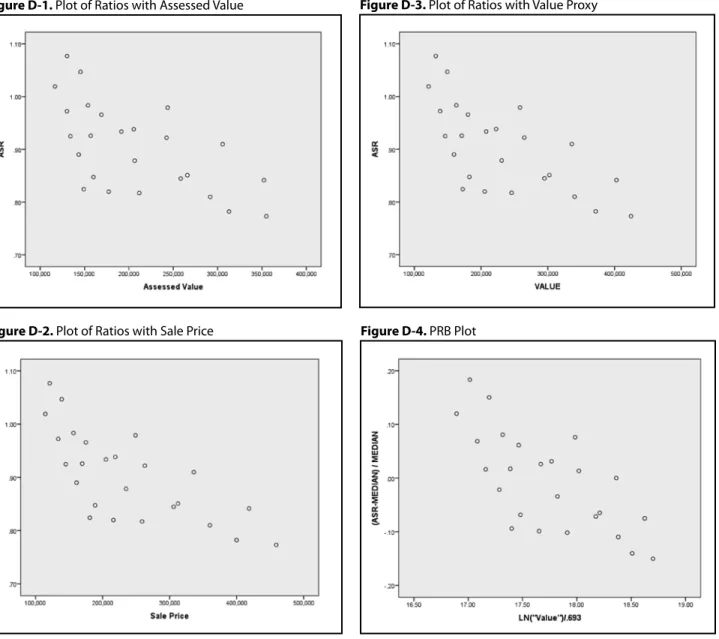
5.6 Vertical Inequities
The measures of variability discussed in section 5.4 relate to “horizontal,” or random, dispersion among the ratios in a stratum, regardless of the value of individual parcels. Another form of inequity can be systematic differ-ences in the appraisal of low- and high-value properties, termed “vertical” inequities. When low-value properties are appraised at greater percentages of market value than high-value properties, assessment regressivity is indi-cated. When low-value properties are appraised at smaller percentages of market value than high-value properties, assessment progressivity is the result. Appraisals made for tax purposes of course should be neither regressive nor progressive.
An index statistic for measuring vertical equity is the PRD, which is calculated by dividing the mean ratio by the weighted mean ratio. This statistic should be close to 1.00. Measures considerably above 1.00 tend to indicate assessment regressivity; measures below 1.00 suggest assessment progressivity. When samples are small or the weighted mean is heavily influenced by several extreme sales prices, the PRD may not be a sufficiently reliable measure of vertical inequities. A scatter plot of ratios ver-sus appraised values or sale prices is a useful diagnostic tool. A downward (or upward) trend to the data indicates systematic regressivity (or progressivity). Assuming repre-sentativeness, high PRDs generally indicate low appraisals on high-priced properties. If not sufficiently representative, extreme sales prices can be excluded in calculation of the PRD. Similarly, when samples are very large, the PRD may be too insensitive to show small pockets in which there is significant vertical inequity. Standards for evaluating the PRD are given in section 9.2.7 in this part. In addition, more powerful statistical tests for vertical inequities are available and should be employed to determine the signifi-cance of the indication provided by the PRD (see section 5.7 in this part and Twark, Everly and Downing [1989]). The coefficient of price-related bias (PRB) provides a more meaningful and easily interpreted index of price-related bias than the PRD. It is obtained by regressing percentage difference from the median ratio on percentage differences in value (see Appendix D). A PRB of −.045
indicates, for example, that assessment ratios fall by 4.5% when values double and increase by 4.5% when values are halved. Like all regression coefficients, the statistical reliability of the PRB can be gauged by noting its t-value and related significance level, and by computing confi-dence intervals. In table 1-4 the PRB is -0.035 and is not statistically significant.
Unacceptable vertical inequities should be addressed through reappraisal or other corrective actions. In some cases, additional stratification can help isolate the problem. Measures of level computed for value strata should not be compared as a way of determining vertical inequity because of a boundary effect that is most pronounced in the highest and lowest strata (Schultz 1996).
5.7 Tests of Hypotheses
An appropriate test should be used whenever the purpose of a ratio study is implicitly or explicitly to test a hypothesis. A hypothesis is essentially a tentative answer to a question, such as, Are residential and commercial properties appraised at equal percentages of market value? A test is a statistical means of deciding whether the answer “yes” to such a ques-tion can be rejected at a given level of confidence. In this case, if the test leads to the conclusion that residential and commercial properties are not appraised at equal percent-ages of market value, some sort of corrective action on the part of assessing officials is clearly indicated.
Tests are available to determine whether the • level of appraisal of a stratum fails to meet an
established standard
• meaningful differences exist in the level of appraisal between two or more strata
• high-value properties are appraised at a different percentage of market value than low-value properties
Appropriate tests are listed in table 1-2 and discussed in Gloudemans (1999), Property Appraisal and Assessment Administration (IAAO 1990), and Improving Real Prop-erty Assessment (IAAO 1978, 137–54).
5.8 The Normal Distribution
Many conventional statistical methods assume the sample data conform to the shape of a bell curve, known as the normal (or Gaussian) distribution. Performance measures based on the mean or standard deviation can be mislead-ing if the study sample does not meet the assumption of normality. As a first step in the analysis, the distribution of sample ratios should be examined to reveal the shape of the data and uncover any unusual features. Although ratio study samples typically do not conform to the normal distribution, graphical techniques and numerical tests can be used to explore the data thoroughly. Traditional choices are the binomial, chi-square, and Lilliefors tests. Newer and more powerful procedures are the Shapiro-Wilk W, the D’Agostino-Pearson K2, and the Anderson-Darling A2 tests (D’Agostino and Stephens 1986).
5.9 Parametric and Distribution-Free
(Non-para metric) Statistics
For every problem that might be solved by using statis-tics, there is usually more than one measure or test. These measures and tests can be divided into two broad catego-ries: parametric and distribution-free (nonparametric). Parametric statistics assume the population data conform to a known family of probability distributions (such as the normal distribution). When the mean, weighted mean, and standard deviation are used in this context, they tend to be more meaningful. Distribution-free statistics make less re-strictive assumptions and do not require knowledge about the shape of the underlying population distribution. Given similar distribution of ratios in the underlying populations, distribution free tests, such as the Mann-Whitney test, can determine the likelihood that the level of assessment
Table 1-2. Tests of Hypotheses
Null Hypothesis Nonparametric Test Parametric Test
1. Ratios are normally distributed. Shapiro-Wilk W test
D’Agostino-Pearson K2 test
Anderson-Darling A2 test
Lillifores Test
N/A
2. The level of appraisal meets legal requirements. Binomial test t-test
3. Two property groups are appraised at equal percentages of
market value. Mann-Whitney test t-test
4. Three or more property groups are appraised at equal
percentages of market value. Kruskal-Wallis test Analysis of Variance
5. Low- or high-value properties are appraised at equal
percentages of market value. Spearman Rank test PRB, correlation or regression analysis
of property groups differ (Hart 2001). Distribution-free statistics are the median and the COD.
6. Sample Size
6.1 Importance of Sample Size
There is a general relationship between statistical reli-ability and the number of observations in a sample. The larger the sample size, the greater the reliability.
6.2 Adequacy of a Given Sample Size
The adequacy of a given sample size can be evaluated by computing measures of reliability. If the confidence inter-val is sufficiently narrow, the sample is large enough. If the confidence interval is too wide, the assessor must either accept less precision or enlarge the sample, if possible.
6.3 Required Sample Size
Formulas are available to compute the minimum sample size necessary to produce selected margins of error at a specified level of confidence. Such formulas depend crucially on the estimated variability of the ratios (Cochran 1977).
6.4 Remedies for Inadequate Samples
Small samples should be enlarged if the assessor desires to increase the reliability of statistical measures. Inadequate sample sizes are typically indicated by unacceptably wide confidence intervals. The following alternatives should be considered:
1. Restratification. If levels of appraisal are similar or properties are homogenous, broader strata containing larger samples can be created by combining existing strata or by stratifying on a different basis.
2. Extending the period from which sales are drawn. This is often the most practical and effective approach. Sales from prior years can be used; however, adjusting the sale price for time may be necessary and significant property characteristics must not change.
3. Enlarging the sample by validating previously rejected sales. Sales previously excluded from the analysis, because it was not administratively expedient to confirm them or to make
adjustments, can be reevaluated.
4. Imputing appraisal performance. Ratio study statistics for strata with no or few sales can sometimes be imputed from the results obtained for other strata. These strata should be as similar as possible. Procedures and techniques used to appraise properties in the strata also should be similar.
6.5 Other Sample Size-Related
Representativeness Problems
Sales from areas or substrata in which the number of sales is disproportionately large can distort ratio study results by weighting level and uniformity indicators toward whatever conditions exist in the overrepresented area. To alleviate this problem and create better representativeness, large samples can be further stratified by
• randomly selecting sales to be removed
• isolating the overrepresented groups into substrata • redefining the time period for the overrepresented
groups
• weighting the data
7. Reconciliation of Ratio Study Performance
Measures
An important objective of a ratio study conducted by a local jurisdiction is the evaluation of model performance. This is a USPAP requirement in the reconciliation of a mass appraisal. Assessing officials must incorporate a quality control program, including checks and audits of the data, to ensure that sold and unsold parcels are appraised at the same level. This also requires characteristic data for both sold and unsold properties to be current, appropriate, relevant, and collected in a consistent manner.
8. Presentation of Findings, Documentation,
and Training
The findings of a ratio study should be sufficiently detailed and documented to meet the needs of the users of the study. Documentation for internal ratio studies can be less detailed than for reports prepared for external uses. The following documentation should be provided in conjunc-tion with any published ratio study.
8.1 Text
A brief text describing the purpose and the methods used should accompany a ratio study. This information can be incorporated in the report of the findings or be contained in a separate memorandum. The text should contain the statistics presented and outline the major procedural steps in completing the study. The text also should describe any rules for eliminating sales or extreme ratios and acknowl-edge any significant limitations in the data.
8.2 Exhibits
The body of the ratio study report should include for each stratum the statistical results intended to be used for decision-making purposes. All reports should contain the following information:
• date and tax year of the appraisals being evaluated • number of parcels in each stratum
• number of sales
• number of sales trimmed from the study • measures of central tendency (appraisal level) • measures of uniformity (variability) and
price-related biases
• confidence interval (measures of reliability) about the measures of central tendency
• summary of adjustments made to sales prices In addition, there should be a description of the steps taken to ensure that sold and unsold properties were valued and described consistently. If the sold and unsold properties were not treated identically, the documentation should characterize the differences discovered between them.
8.3 Analyses and Conclusions
An objective statement of the results of the ratio study should be prepared. If the study is one in a series, a com-parison of the results with those of previous studies can be helpful.
8.4 Documentation
Ratio study procedures should be documented thoroughly. This documentation should take three forms. First, a general guideline should explain the design of the study. This guideline should be updated whenever procedures are changed. Second, all software applications should be documented so that the program logic can be reviewed and modified as needed. Third, a user’s manual should explain how to execute the study or run the software.
8.5 Training and Education
The effectiveness of ratio studies can be improved through education and training. Assessment supervisors should conduct seminars or workshops for the appraisal staff to explain how to interpret reports, how ratio studies can be used to improve appraisal performance, and how the results will be used in-house.
9. Ratio Study Standards
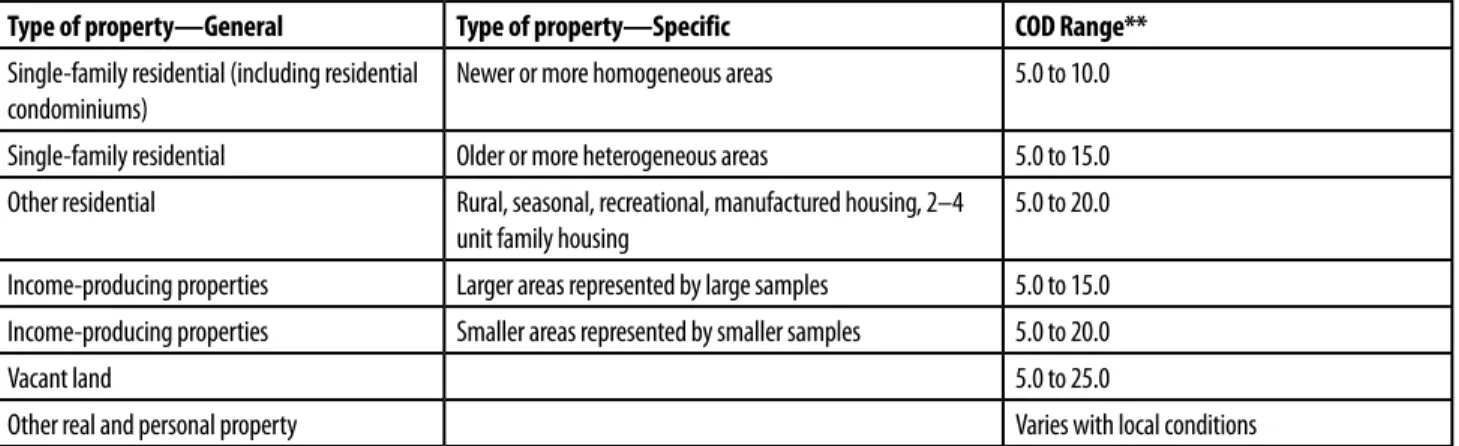
Each local jurisdiction should have ratio study performance standards. Local standards should be consistent with state or provincial standards. The standards summarized in table 1-3 are suggested for jurisdictions in which current market value is the legal basis for assessment. In general, when these standards or other local standards are not met, reappraisal or other corrective measures should be taken.
All standards recommended in this section are predicated on the assumption that steps have been taken to maximize representativeness and validity in the underlying ratio study.
9.1 Level of Appraisal
In analyzing appraisal level, ratio studies attempt to mea-sure statistically how close appraisals are to market value (or to a required statutory constraint that can be expressed as a percentage of market value) on an overall basis. While the theoretically desired level of appraisal is 1.00, an appraisal level between 0.90 and 1.10 is considered acceptable for any class of property. However, each class of property must be within 5 percent of the overall level of appraisal of the jurisdiction (see Section 9.2.1 in this part). Both criteria must be met. By themselves, the calculated measures of central tendency provide only an indication, not proof, of whether the level meets the appropriate goal. Confidence intervals and statistical tests should be used
Table 1-3. Ratio Study Uniformity Standards indicating acceptable general quality*
Type of property—General Type of property—Specific COD Range**
Single-family residential (including residential
condominiums) Newer or more homogeneous areas 5.0 to 10.0
Single-family residential Older or more heterogeneous areas 5.0 to 15.0
Other residential Rural, seasonal, recreational, manufactured housing, 2–4
unit family housing 5.0 to 20.0
Income-producing properties Larger areas represented by large samples 5.0 to 15.0
Income-producing properties Smaller areas represented by smaller samples 5.0 to 20.0
Vacant land 5.0 to 25.0
Other real and personal property Varies with local conditions
These types of property are provided for guidance only and may not represent jurisdictional requirements.
* Appraisal level for each type of property shown should be between 0.90 and 1.10, unless stricter local standards are required. PRD's for each type of property should be between 0.98 and 1.03 to demonstrate vertical equity.
PRD standards are not absolute and may be less meaningful when samples are small or when wide variation in prices exist. In such cases, statistical tests of vertical equity hypotheses should be substituted (see table 1-2).
to determine whether it can be reasonably concluded that appraisal level differs from the established goal in a particular instance. Additionally, when uniformity mea-sures show considerable variation between ratios, level measurements may be less meaningful.
9.1.1 Purpose of Level-of-Appraisal Standard
Jurisdictions that follow the IAAO recommendation of annual revaluations (Standard on Property Tax Policy [IAAO 2010] and Standard on Mass Appraisal of Real Property [IAAO 2013]) and comply with USPAP standard rules should be able to develop mass appraisal models that maintain an overall ratio level of 100 percent (or very near thereto). However, the local assessor may be compelled to follow reappraisal cycles defined by a legal authority or public policy that can extend beyond one year. During extended cycles the influence of inflation or deflation can shift the overall ratio.
The purpose of a performance standard that allows rea-sonable variation from 100 percent of market value is to recognize uncontrollable sampling error and the limiting conditions that may constrain the degree of accuracy that is possible and cost-effective within an assessment jurisdiction. Further, the effect of performance standards on local assessors must be considered in light of public policy and resources available.
9.1.2 Confidence Intervals in Conjunction with
Performance Standards
The purpose of confidence intervals and similar statisti-cal tests is to determine whether it can be reasonably concluded that the appraisal level differs from the
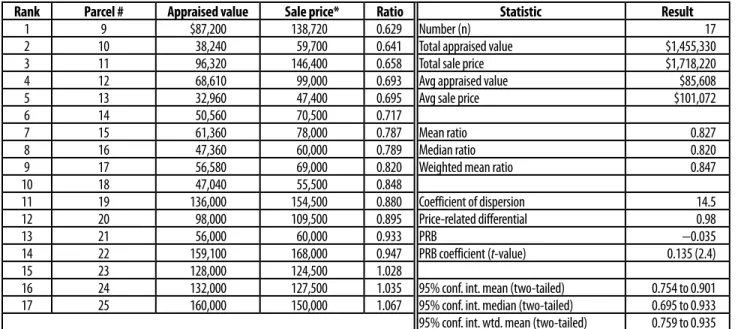
estab-lished performance standard in a particular instance. A conclusion of noncompliance requires a high degree of confidence; thus, a 90 percent (two-tailed) or 95 percent (one-tailed) confidence level should be used, except for small or highly variable samples. The demonstration ratio study report in table 1-4 presents 95% two-tailed confidence interval estimates for the mean, median, and weighted mean ratio.
9.2 Appraisal Uniformity
Assuming the existence of an adequate and sufficiently representative sample, if the uniformity of appraisal is unacceptable, model recalibration and/or reappraisal should be undertaken. It is important to recognize that the COD is a point estimate and, especially for small samples, should not be accepted as proof of assessment uniformity problems. Proof can be provided by recognized statistical tests, including bootstrap confidence intervals.
In unusually homogeneous strata, low CODs can be anticipated. In all other cases, CODs less than 5 percent should be considered suspect and possibly indicative of nonrepresentative samples or selective reappraisal of selling parcels.
9.2.1 Uniformity among Strata
Although the goal is to achieve an overall level of ap-praisal equal to 100 percent of the legal requirement, ensuring uniformity in appraisal levels among strata also is important. The level of appraisal of each stratum (class, neighborhood, age group, market areas, and the like) should be within 5 percent of the overall level of ap-praisal of the jurisdiction. For example, if the overall level of appraisal of the jurisdiction is 1.00, but the appraisal
Table 1-4. Demonstration Ratio Study Report
Rank Parcel # Appraised value Sale price* Ratio Statistic Result
1 9 $87,200 138,720 0.629 Number (n) 17
2 10 38,240 59,700 0.641 Total appraised value $1,455,330
3 11 96,320 146,400 0.658 Total sale price $1,718,220
4 12 68,610 99,000 0.693 Avg appraised value $85,608
5 13 32,960 47,400 0.695 Avg sale price $101,072
6 14 50,560 70,500 0.717
7 15 61,360 78,000 0.787 Mean ratio 0.827
8 16 47,360 60,000 0.789 Median ratio 0.820
9 17 56,580 69,000 0.820 Weighted mean ratio 0.847
10 18 47,040 55,500 0.848
11 19 136,000 154,500 0.880 Coefficient of dispersion 14.5
12 20 98,000 109,500 0.895 Price-related differential 0.98
13 21 56,000 60,000 0.933 PRB −0.035
14 22 159,100 168,000 0.947 PRB coefficient (t-value) 0.135 (2.4)
15 23 128,000 124,500 1.028
16 24 132,000 127,500 1.035 95% conf. int. mean (two-tailed) 0.754 to 0.901
17 25 160,000 150,000 1.067 95% conf. int. median (two-tailed) 0.695 to 0.933
95% conf. int. wtd. mean (two-tailed) 0.759 to 0.935
Date: 0/0/00. No outlier trimming * or adjusted sale price