THE LIVES OF 9-YEAR-OLDS
CHILD COHORT
THE LIVES OF 9-YEAR-OLDS
Name Title Institution
James Williams Research Professor and Principal Investigator, Growing Up in Ireland ESRI Sheila Greene AIB Professor of Childhood Research; Director of Children’s Research
Centre and Co-Director, Growing Up in Ireland TCD Erika Doyle Research Fellow (Children’s Research Centre) TCD Elaine Harris (formerly) Research Fellow (Children’s Research Centre) TCD
Richard Layte Research Professor ESRI
Selina McCoy Senior Research Officer ESRI
Cathal McCrory Research Fellow ESRI
Aisling Murray Research Fellow ESRI
Elizabeth Nixon Lecturer (School of Psychology and Children’s Research Centre) TCD Tom O’Dowd Professor of General Practice (School of Medicine) TCD Mona O’Moore Associate Professor (School of Education) TCD
Amanda Quail Research Fellow ESRI
Emer Smyth Research Professor ESRI
Lorraine Swords Research Fellow (Children’s Research Centre) TCD
Maeve Thornton Research Fellow ESRI
Trinity College Dublin
The views expressed in this report are those of the authors and do not necessarily reflect the views of the funders or of either of the two institutions involved in preparing the report.
James Williams, Sheila Greene, Erika Doyle, Elaine Harris, Richard Layte,
Selina McCoy, Cathal McCrory, Aisling Murray, Elizabeth Nixon, Tom O’Dowd,
Mona O’Moore, Amanda Quail, Emer Smyth, Lorraine Swords, Maeve Thornton.
2
Copyright © Minister for Health and Children, 2009
Office of the Minister for Children and Youth Affairs Department of Health and Children
Hawkins House Hawkins Street Dublin 2
Tel: +353 (0)1 635 4000 Fax: +353 (0)1 674 3223 E-mail: omc@health.gov.ie Web: www.omc.gov.ie
Published by The Stationery Office, Dublin
ISBN 978-1-4064-2450-8
All rights reserved. No part of this publication may be reproduced, stored in a retrieval system, or transmitted, in any form or by any means,
electronic, mechanical, photocopying, recording or otherwise, without the prior permission in writing of the copyright holder.
For rights of translation or reproduction, applications should be made to the Head of Communications, Office of the Minister for Children and Youth Affairs, Hawkins House, Hawkins Street, Dublin 2, Ireland.
3
ACKNOWLEDGEMENTS
Growing Up in Irelandhas benefitted greatly from the help and assistance of a very large number of people, groups and organisations.
We wish to acknowledge the funding of the project by the Department of Health and Children, through the Office of the Minister for Children and Youth Affairs, in association with the Department of Social and Family Affairs and the Central Statistics Office.
Thanks are due to members of both the inter-Departmental Steering Group, (Chaired by Ms Sylda Langford, Director General of the Office of the Minister for Children and Youth Affairs) and also the Project Team (Chaired by Dr Sinead Hanafin, Head of Research, Department of Health and Children). Ms Anne-Marie Brooks and Mr Tim Heneghan from the Office of the Minister for Children and Youth Affairs were also extremely supportive.
The innumerable insights from Professor Anne Sanson of the University of Melbourne and Dr Satya Brink of Human Resources and Social Development, Canada were particularly helpful, as were the comments on this report from three anonymous referees.
We are very grateful to the members of the Scientific and Policy Advisory Committee (SPAC) and the Research Ethics Committee (REC) for their commitment, time and inputs.
Staff and colleagues in both the ESRI and Trinity College provided assistance in very many ways as did the members of the Advisory Panels of Experts who made a particularly important contribution to instrument development and provided comments on the first draft of this report.
We would like to thank the stakeholder groups who gave so generously of their time, particularly during the planning, design and development stages of the project.
We are deeply indebted to all the principals, teachers and administrative staff in the schools which
participated in the study. We appreciate that Growing Up in Irelandadded considerably to their already very heavy workload.
The 84 children who sit on the Children’s Advisory Forum (CAF) provided very important help in developing and testing themes, issues and questionnaires for the study.
The final (and biggest) word of thanks goes, of course, to the 8,570 nine-year-olds and their families who participated in the study, initially in their schools and subsequently in their homes. Growing Up in Ireland would not have been possible without the time and assistance which they so readily and generously provided to us.
MINISTER'S FOREWORD
As Minister for Children and Youth Affairs, it gives me great pleasure to publish The Lives of Nine Year Olds.
This represents the first formal publication from Growing Up in Ireland, the landmark National Longitudinal Study of Children. This Study was initiated and is funded by the Office of the Minister for Children and Youth Affairs as part of the National Children’s Strategy.
Growing Up in Irelandis one of the largest and most complex studies of this nature that has ever been undertaken in Ireland. By tracking the development of two cohorts of young children for at least seven years (approximately 11,000 infants and 8,500 nine-year old children), Growing Up in Irelandaims to ‘examine the factors which contribute to or undermine the wellbeing of children in contemporary Irish families, and, through this, contribute to the setting of effective and responsive policies relating to children and to the design of services for children and their families’.
I am confident that this first publication from the cohort of nine-year-old children will prove to be of enormous benefit to both policy makers and practitioners and will play an important role in the ongoing quest to improve children’s lives in Ireland.
I would like to thank Professor James Williams of the Economic and Social Research Institute and Professor Sheila Greene of the Children’s Research Centre at Trinity College Dublin, their research team and their team of fieldworkers who carried out this Study. Most importantly, I would like to thank the 8,570 children, their families and schools who have generously given up their valuable time to participate.
Barry Andrews, T.D.
Minister for Children and Youth Affairs
TABLE OF CONTENTS
CHAPTER 1 – INTRODUCTION AND BACKGROUND 15
1.1 Introduction 16
1.2 Background to and Objectives of Growing Up in Ireland 16
1.2.1 Introduction 16
1.2.2 Conceptual Framework 18
1.2.3 Timeliness of Growing Up in Ireland 20
1.3 Data and Methodology 20
1.3.1 Design, response rates and reweighting the data 20
1.3.2 The questionnaires 21
1.4 The Content and Organisation of this Report 22
CHAPTER 2 – CHARACTERISTICS OF NINE-YEAR-OLDS AND THEIR FAMILIES 23
2.1 Introduction 24
2.2 How Many Nine-year-olds and in What Kinds of Families Do Nine-year-olds Live? 24
2.3 The Characteristics of Mothers and Fathers 27
2.4 The Nine-year-old Child’s Religious Denomination and Citizenship 30
2.5 Classificatory Variables Used in Report 31
2.5.1 Family social class 31
2.5.2 Family income group 31
2.5.3 Family type 31
2.5.4 Highest level of maternal educational attainment 32 2.6 Interrelationships Between Different Characteristics 32
2.7 Summary 34
CHAPTER 3 – FAMILY AND PARENTING 35
3.1 Introduction 36
3.2 What do the Families of the Nine-year-olds Look Like? 37
3.3 The Importance of Family Relationships 39
3.3.1 What do parents say about their relationships with their children? 39 3.3.1.1 What do parents say about being close to their children 40 3.3.1.2 What do parents say about conflict with their children 41 3.4 What Do the Children Say About Their Relationships with Parents and Siblings 42
3.5 The Importance of Parenting Style 43
3.5.1 Do fathers and mothers differ in their parenting styles? 43 3.5.2 Do parents adopt different parenting styles with boys and girls? 44
3.6 Different Approaches to Discipline 45
3.6.1 Mothers’ reports on their disciplinary strategies 45
3.6.2 Mothers’ self-reported use of smacking 46
3.6.3 Do mothers and fathers differ in their use of smacking? 47
3.7 Information on the Non-resident Parents 48
3.7.1 Relationship between mother and non-resident father 48 3.7.2 How much contact do the children have with their non-resident fathers? 49
3.8 Key Findings 50
3.9 Summary 51
CHAPTER 4 – CHILDREN’S HEALTH AND DEVELOPMENT 53
4.1 Introduction 54
4.2 General Health of Children is Good 54
4.3 Chronic Illness and Disability 55
4.4 Children’s Oral Health Practices 56
4.5 Measuring Height and Weight 57
4.6 Overweight and Obesity 58
4.7 Parental Influence on Child Weight 59
4.8 Children and Food 60
4.9 Children and Breakfast 61
4.10 Physical Activity and Exercise 61
4.11 Getting to School 62
4.12 Key Findings 63
4.13 Summary 64
CHAPTER 5 – CHILDREN’S USE OF HEALTHCARE 65
5.1 Introduction 66
5.2 Visiting the General Practitioner 66
5.3 Visiting the Dentist 67
5.4 Visiting Medical Specialists 68
5.5 Visiting Accident and Emergency 68
5.6 Accidents and Injuries 69
5.7 Nights in Hospital 70
5.8 Children Who Do Not Use Medical Services 70
5.9 Key Findings 72
5.10 Summary 72
CHAPTER 6 – THE SOCIAL, EMOTIONAL AND BEHAVIOURAL WELL-BEING OF NINE-YEAR-OLDS 73
6.1 Introduction 74
6.2 Children’s Emotional and Behavioural Strengths and Difficulties 74
6.3 Children’s Temperament 76
6.3.1 Variations in children’s temperament 76
6.3.2 Serious problem behaviours and temperament 78
6.4 Children’s Self-concept 80
6.5 Children’s Experience of Stressful Life Events 81
6.6 People to Whom Children Choose to Talk About Problems 84
6.7 Key Findings 85
6.8 Summary 85
CHAPTER 7 – CHILDREN’S EDUCATION 87
7.1 Introduction 88
7.2 Academic Performance 88
7.3 Children’s Attitudes to and Engagement with School 90
7.3.1 Attitudes to school 90
7.3.2 Engagement with school 92
7.3.2.1 Absenteeism 92
7.3.2.1 Homework completion 92
7.4 The School Setting 93
7.4.1 Teacher characteristics 93
7.4.2 Pupil-teacher ratio 94
7.4.3 Discipline Policy 94
7.4.4 Classroom management 95
7.5 Support for Learning at Home 96
7.5.1 Mother’s educational resources 96
7.5.2 Mother’s support of the child’s education 96
7.5.3 Mothers’ expectations of child’s education 98
7.5.4 Reading-related resources in the home 99
7.6 Key Findings 101
7.7 Summary 102
CHAPTER 8 – PEER RELATIONSHIPS 103
8.1 Introduction 104
8.2 Friendship Networks 104
8.3 Prevalence of Bullying: Victimisation 106
8.4 Nature of Victimisation 107
8.5 Prevalence of Bullying: Bullying Others 110
8.6 Prevalence of Bullying: Bully/Victims 111
8.7 Key Findings 112
8.8 Summary 113
CHAPTER 9 – CHILDREN’S ACTIVITIES 115
9.1 Introduction 116
9.2 Watching TV, Videos and DVDs 117
9.3 Playing Video Games 119
9.4 Children's Access to and Use of a Computer at Home 121 9. 5 Children’s Participation in Structured Activities 124
9.5.1 Participation in sports sctivities 124
9.5.2 Children’s participation in structured cultural activities 124 9.5.3 Children’s participation in Youth Clubs, Scouts/Guides/Boys’ or Girls’ Brigade 125
9.5.4 Children’s participation in homework clubs 126
9.6 Key Findings 128
9.7 Summary 129
CHAPTER 10 – CHILDREN’S NEIGHBOURHOODS AND COMMUNITY 131
10.1 Introduction 132
10.2 Quality of the Neighbourhood Environment 132
10.2.1 The mothers’ views of their local neighbourhood 132 10.2.2 The children’s view of their neighbourhood 134
10.3 Perceived Safety in the Community 135
10.3.1 The mothers’ views of safety 135
10.3.2 The children’s view of safety 137
10.4 Services in the Community 137
10.4.1 The mothers’ views of services 138
10.4.2 The children’s view of services 139
10.5 Involvement in the Community 141
10.5.1 Involvement with local voluntary groups 141
10.5.2 Family living in the area 143
10.6 Key Findings 144
10.7 Summary 145
CHAPTER 11 – SUMMARY 147
11.1 Introduction 148
11.2 Family Context 148
11.3 Health Outcomes 149
11.4 Educational Outcomes 150
11.5 Emotional and Behavioural Outcomes 151
11.6 The Future for the Nine-Year-Old Cohort 153
References 155
LIST OF TABLES
Table 2.1: Basic characteristics of primary and secondary caregivers of nine-year-olds 26 Table 2.2: Principal economic status of mothers and fathers and average number of
hours worked among those who work outside the home. 28
Table 2.3: Religious denomination of mothers 29
Table 2.4: Nine-year-olds’ mothers and fathers classified by whether or not they are (a) a citizen of Ireland, (b) they were born in Ireland and (c) length of time
since first coming to live here 30
Table 2.5: Religious denomination of nine-year-olds 30 Table 2.6: Nine-year-olds classified by whether or not they are (a) a citizen of Ireland,
(b) they were born in Ireland and (c) length of time since first coming to live here 31 Table 3.1: Mother’s self-reported use of discipline strategies (percentages) 45 Table 6.1: Mean scores for boys and girls on each of the SDQ subscales based
on mother and teacher reports 75
Table 6.2: Average scores for boys and girls on the four EAS subscales of shyness,
emotionality, activity, and sociability 77
Table 6.3: 25th, 50thand 75thpercentile scores for each EAS subscale 77 Table 6.4: Percentage of children who engaged in each serious problem behaviour
in the past year 78
Table 6.5: Percentage of children experiencing listed life events classified by family type 82 Table 7.1: Average pupil/teacher ratio in schools attended by nine-year-olds classified
by family social class, income group, family type and mother’s education 94
LIST OF FIGURES
Figure 1.1: Bronfenbrenner’s ecological perspective on child development 19 Figure 2.1: Family type and size of households in which nine-year-olds live 24 Figure 2.2: Number of siblings living in the household 25 Figure 2.3: Age groups of siblings living in household 25 Figure 2.4: Age order of nine-year-olds in relation to other siblings living in household 26 Figure 2.5: Proportion of mothers and fathers in different age groups 27 Figure 2.6: Highest level of educational attainment of mothers and fathers of nine-year-olds 28
Figure 2.7: Social class of nine-year-old’s family 29
Figure 2.8: Relationship between family social class and family income 33 Figure 2.9: Relationship between the family social class and highest level of
education completed to date by nine-year-old’s mother 33
Figure 3.1: Family type and current marital status 37
Figure 3.2: Family type and employment status 38
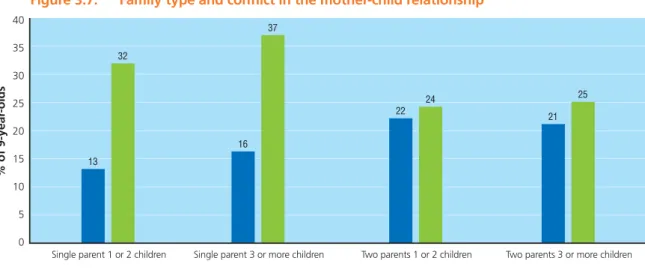
Figure 3.3: Relationship between the family social class and family type. 38 Figure 3.4: Relationship between the family type and family income group. 39 Figure 3.5: Closeness in the child-parent relationships classified by child’s sex 40 Figure 3.6: Conflict in the child-parent relationships classified by child’s sex 41 Figure 3.7: Family type and conflict in the mother-child relationship 41 Figure 3.8 Closeness and conflict in the child-mother relationship and
relationship with siblings. 42
Figure 3.9: Percentage of parents in each parenting style category 44 Figure 3.10: Percentage of mothers and fathers using each parenting style with boys and girls 44 Figure 3.11: Percentage of mothers who use smacking ‘now and again’ according to
their highest level of educational attainment 46 Figure 3.12: Percentage of mothers who use smacking ‘now and again’ according to family
income group 46
Figure 3.13: Frequency of smacking classified according to whether one or more than one
child in family 47
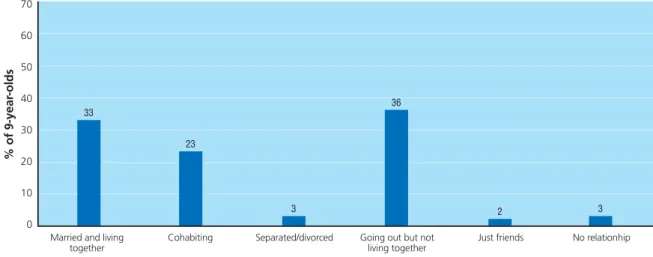
Figure 3.14: Children’s reports of parental smacking by child’s sex and parent 47 Figure 3.15: Mother’s relationship to child’s father when she became pregnant with
the Study Child. 48
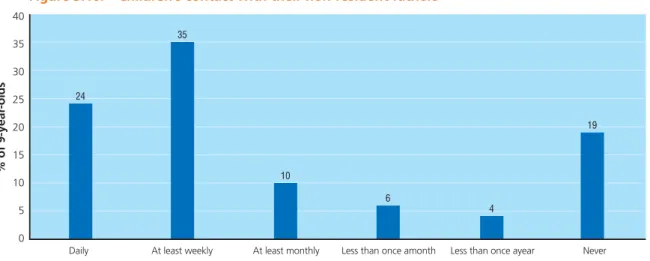
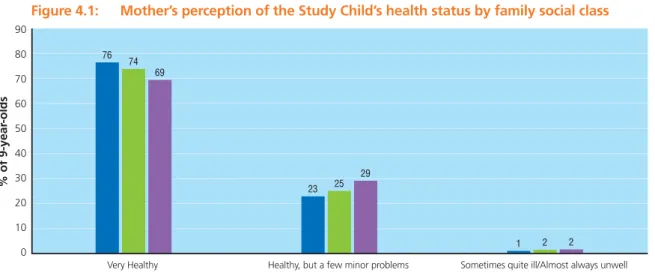
Figure 3.16: Children’s contact with their non-resident fathers 49 Figure 4.1: Mother’s perception of the Study Child’s health status by family social class 54 Figure 4.2: Percentage of children within each chronic illness type 56 Figure 4.3: Percentage of children not brushing their teeth at least once per day by
household income group 57
Figure 4.4: Percentage of children within each BMI category by family social class 58 Figure 4.5: Percentage of children within each weight class category by weight status
of caregivers 59
Figure 4.6: Percentage of children consuming at least one portion of various foods by
mother’s highest level of educational attainment 60 Figure 4.7: Percentage of children not eating breakfast by income quintiles 61 Figure 4.8: Children’s self-reported frequency of exercise and sports participation by gender 62 Figure 4.9: Mode of transportation to school by family social class 63
Figure 5.1: Average number of GP consultations in the last year by sex of child and
income group 66
Figure 5.2: Average number of GP consultations in the last year by sex of child and
medical card status 67
Figure 5.3: Proportion visiting their dentist at least yearly by sex of child and family
income group 67
Figure 5.4: Proportion visiting a medical specialist in the last year by sex of child and
medical card status 68
Figure 5.5: Proportion visiting an Accident and Emergency Department in the last year
among boys by income group 69
Figure 5.6: Average number of accidents for those boys who have experienced an accident or injury which required hospital treatment or admission by income group 69 Figure 5.7: Proportion reporting that their child required dental care in the last year but
did not receive it by sex of child and location 70 Figure 5.8: Reasons given for child not receiving medical and dental care when required 71 Figure 6.1: Percentage of nine-year-olds in each category of maternal education who
were classified in the abnormal (high) category of (a) emotional symptoms, (b) conduct problems, (c) hyperactivity/inattention, (d) peer relationship
problems and (e) Total Difficulties 75
Figure 6.2: Percentage of nine-year-olds in each category of family income who were classified in the abnormal (high) category of (a) emotional symptoms, (b) conduct problems, (c) hyperactivity/ inattention and (d) peer relationship
problems 76
Figure 6.3: Percentage of children in the top quartile of each EAS subscale according
to mother’s education 77
Figure 6.4a: Distribution of children across EAS emotionality quartile scores for those who
had and had not often lied to obtain goods or services 78 Figure 6.4b: Distribution of children across EAS emotionality quartile scores for those
who had and had not often started fights, or bullied, threatened or intimidated
others. 79
Figure 6.4c: Distribution of children across EAS emotionality quartile scores for those who
had and had not been physically cruel to other people or animals 79 Figure 6.4d: Distribution of children across EAS emotionality quartile scores for those who
had and had not deliberately damaged or destroyed property 79 Figure 6.5: Average scores for boys and girls on the six Piers-Harris total subscale scores 80 Figure 6.6: Percentage of children categorised as ‘above average’ on the six
Piers-Harris subscales classified by family social class 81 Figure 6.7: Percentage of children experiencing listed life events 82 Figure 6.8: Percentage of children experiencing four or more of the listed life events
classified by family type 83
Figure 6.9: The percentage of children with varying experience of stressful life events with high scores on the four problem subscales of the Strengths and Difficulties Questionnaire 83 Figure 6.10: People whom nine-year-olds would talk to about a problem 84 Figure 7.1: Proportion in lowest and highest reading quintiles by mother’s educational level 89 Figure 7.2: Proportion in lowest and highest Maths quintiles family by social class 89 Figure 7.3: Attitudes to school (percentage saying ‘always’) by sex of child 90 Figure 7.4: Proportion ‘always’ liking school subjects by sex of child 91
Figure 7.5: Average number of days absent from school by background characteristics 92 Figure 7.6: Proportion ‘occasionally’ or ‘regularly’ not completing homework
(based on teacher report) by background characteristics 93 Figure 7.7: Nine-year-olds classified by the age and gender profile of their teachers 93 Figure 7.8: Forms of discipline reported by principal to be most often used in schools 95 Figure 7.9: Percentage of nine-year-olds described by teachers as being well-behaved,
respectful and rewarding to work with 95
Figure 7.10: Mothers lacking literacy and numeracy skills by household equivalised
income quintile 96
Figure 7.11: Provides help with homework by family type 97 Figure 7.12: Mother’s expectation of child's education by mother’s own education level 98 Figure 7.13: Number of children's books in the home by maternal education 99 Figure 7.14: Child’s self-report on how often s/he reads for fun (not for school)
classified by gender 99
Figure 7.15: Child’s self-report on how often s/he reads for fun (not for school)
classified by social class and highest level of mother’s educational attainment –
restricted to categories of Every Day and Never 100 Figure 8.1: Number of close friends by sex of child 105 Figure 8.2: Number of days per week that children spent with friends by sex of child 105 Figure 8.3: Agreement between mother/child dyads in reports of child victimisation 106 Figure 8.4: Prevalence of victimisation experiences by family type and by respondent 107 Figure 8.5: Nature of victimisation experiences by sex of the child 108 Figure 8.6: Nature of victimisation experiences by respondent 108 Figure 8.7: Emotional impact of victimisation by sex of the child 109 Figure 8.8: Nature of perpetration by sex of the child 110 Figure 8.9: Classification of children’s involvement in bullying 111 Figure 9.1: Maternal report on time spent by nine-year-olds watching TV, videos
or DVDs on a normal weekday during term time, classified according to
(a) family type and (b) mother’s highest level of educational attainment 118 Figure 9.2: Percentage of nine-year-olds who have (a) a TV and (b) a video/DVD player
in their own bedroom classified by level of mother's highest level of educational attainment 118 Figure 9.3: Percentage of nine-year-olds who have (a) a TV and (b) a video/DVD player
in their own bedroom classified by level of family income (equivalised) 119 Figure 9.4: Maternal report on time spent by nine-year-olds playing video games on a
normal weekday during term time, classified by sex of child 119 Figure 9.5: Maternal report on time spent by nine-year-olds playing video games on a
normal weekday during term time, classified by mother's highest level of
educational attainment 120
Figure 9.6: Percentage of nine-year-olds with a games console in their bedroom,
classified by mother’s highest level of educational attainment and family type 120 Figure 9.7: Percentage of nine-year-olds with a computer at home, classified by mother's
highest level of educational attainment and family type 121 Figure 9.8: Percentage of nine-year-olds with a computer or laptop in their bedroom,
classified by mother's highest level of educational attainment and family
income group 122
Figure 9.9: Uses to which children reported putting the computer at home 123
Figure 9.10: Percentage of children who recorded being allowed to use the internet without parental or other adult supervision classified by sex of child, social
class and highest level of mother's educational attainment 123 Figure 9.11: Maternal report on participation in structured sports classified by sex of child,
family income and family type 124
Figure 9.12: Maternal report on participation in structured cultural activities classified by
sex of child, mother's highest level of educational attainment and family income 125 Figure 9.13: Mother’s report on participation in Youth Clubs classified by mother's highest
level of educational attainment and family income 125 Figure 9.14: Parental report on participation in Scouts/Guides/Boys’ or Girls’ Brigade
classified by child's sex, social class and family income 126 Figure 9.15: Parental report on participation in homework clubs, classified by highest
level of mother's educational attainment, family income and family type 127 Figure 10.1: Percentage of mothers rating a number of physical conditions as very
commonor fairly commonby family social class 133
Figure 10.2: Percentage of mothers rating a number of physical conditions as very
commonorfairly commonby urban/rural classification 133
Figure 10.3: Percentage of nine-year-olds agreeing to each statement by lowest/highest
family income group 134
Figure 10.4: Percentage of children agreeing to each statement by urban/rural classification 135 Figure 10.5: Percentage of nine-year-olds whose mothers agreed with each statement
about safety of local area classifed by family social class 136 Figure 10.6: Percentage of mothers agreeing with each statement about safety of
local area by urban/rural classification 136
Figure 10.7: Percentage of children agreeing with each statement about safety of local
area by urban/rural classification 137
Figure 10.8: Mothers’ views of availability of services in the local area by family social class 138 Figure 10.9: Mothers’ views of availability of services in the local area by urban/rural
classification 139 Figure 10.10: Children's view of availability of services/facilities 140 Figure 10.11: Children's view of availability of services/facilities by urban/rural classification 140 Figure 10.12: Percentage of mothers reporting their involvement in local voluntary groups
by highest level of mother’s educational attainment, family social class, family
income quintile and urban/rural classification 141 Figure 10.13: Percentage of mothers reporting their involvement in local voluntary
groups by family type 142
Figure 10.14: Percentage of mothers reporting having family living in local area by highest level of maternal educational attainment, family social class and family income
quintile 143
15
INTRODUCTION AND BACKGROUND
1.1. INTRODUCTION
This report presents the first descriptive analysis of the findings from the first wave of data collection with the 8,570 nine-year-old children, their families and teachers who have participated in Growing Up in Ireland – the National Longitudinal Study of Children.The data were collected between September 2007 and June 2008. This report is one of a series describing the background literature, the design, instrumentation and the findings of the Growing Up in Ireland project.
Growing Up in Irelandtracks the development of two cohorts of children, one aged nine years and one aged nine months. This report addresses the first objective of Growing Up in Ireland:‘to describe the lives of children in Ireland’. It will provide a comprehensive picture of how the nine-year-old children are faring across the main domains of their development and their daily life experience. The findings will be presented for all children and will also be presented by the sex of the child. Where interesting differences occur in relation to the children’s social class and family type, these data will be reported. This report is
straightforwardly descriptive. The next report on the findings of the nine-year-old survey will be analytic, that is, it will examine more closely relationships between the child’s wellbeing and developmental status and a wide range of factors that may impact on the child’s development.
Although both scheduled reports will aim to be as comprehensive as possible it should be borne in mind that the amount of data collected in Growing Up in Irelandis considerable and it is amenable to much more analysis. All the data will be lodged in a national archive, the Irish Social Science Data Archive (ISSDA), for other researchers to access, analyse and publish. The data will also be used again from a different perspective when the next wave of the longitudinal study is conducted. At that point, in the case of this cohort, it will be possible to relate the child’s status and development at age 9 to their outcomes at age 13.
1.2
BACKGROUND TO AND OBJECTIVES OF GROWING UP IN IRELAND
1.2.1 INTRODUCTION
Growing Up in Irelandwas commissioned in April 2006. It is funded by the Department of Health and Children through the Office of the Minister for Children and Youth Affairs, in association with the
Department of Social and Family Affairs and the Central Statistics Office. The Study is being carried out by a
consortium of researchers led by the Economic and Social Research Institute (ESRI) and Trinity College Dublin (TCD).
The principal objective of Growing Up in Ireland – the National Longitudinal Study of Children is to describe the lives of Irish children, to establish what is typical and normal as well as what is atypical and problematic. The Study will focus on a broad range of child outcomes with a view to documenting how well children in Ireland are doing in relation to a number of key child outcomes. In so doing, it will facilitate comparison with findings from similar international studies of children, as well as establishing norms for Ireland. Being longitudinal in nature the Study will also address developmental trajectories over time and will explore the factors which most impact on those trajectories and on the life chances of children as they grow from nine months to early childhood, in the case of the infant cohort, and from 9 years to 13 years, in the case of the child cohort. By providing an evidence base of research and insights into children and childhood, the Study will inform and contribute to the development of responsive policies and the design of services for children and their families.
The first phase of the project will extend over seven years and will involve two longitudinal sweeps of data collection from a nationally representative sample of children in two age categories – a nine-month-old cohort of 11,000 infants and a nine-year-old cohort of 8,570 children. The nine-year-old cohort, which is the focus of this report, was selected through the primary school network. A random sample of schools was drawn and, subject to the school’s participation, age-eligible children and their families in that school were invited to participate in the Study. A wide range of perspectives have been included in the Study with information being recorded from parents, teachers, principals and carers, and most importantly of all, the Study Child himself or herself.
Growing Up in Irelandcan be set within the National Children’s Strategy (Department of Health & Children, 2000), the primary objective of which is to ‘…enhance the status and further improve the quality of life of Ireland’s children’ (p.4). It affirms Ireland’s commitment to respecting children as fully participating members of society in their own right. The three main goals of the National Children’s Strategy are to give children an appropriate voice in matters which affect them, to improve children’s lives through increased understanding, and to promote children’s development through the provision of quality supports and services.
The principles espoused by the National Children’s Strategy are an integral part of Growing Up in Ireland and very much ensure that in its conception and planning it is a Study of children, with children, and for children. The Study encompasses all children in Ireland – in all their multifaceted variation and diversity. The design of the Study has benefitted greatly from the input of the Children’s Advisory Forum. Eighty-four children from all round Ireland have met periodically with members of the Study Team to advise on such issues as the Study logo, the wording of questions in the child questionnaire, the design of the web site, and how the Study findings should be communicated to children.
Growing Up in Irelandhas nine stated objectives as follows:
1. to describe the lives of children in Ireland, in order to establish what is typical and normal as well as what is atypical and problematic
2. to chart the development of children over time, to examine the progress and wellbeing of children at critical periods from birth to adulthood
3. to identify the key factors that, independently of others, most help or hinder children’s development 4. to establish the effects of early childhood experiences on later life
18
5. to map dimensions of variation in children’s lives
6. to identify the persistent adverse effects that lead to social disadvantage and exclusion, educational difficulties, ill health and deprivation
7. to obtain children’s views and opinions on their lives 8. to provide a bank of data on the whole child
9. to provide evidence for the creation of effective and responsive policies and services for children and families.
Given these objectives, the first data wave with the nine-year-old cohort focused on their lives with a view to furthering our understanding of the broad spectrum of experiences and circumstances of nine-year-olds in Ireland today and the factors which are associated with differences in outcomes.
1.2.2 CONCEPTUAL FRAMEWORK
The conceptual framework adopted by Growing Up in Irelandis described in full in Greene et al., (2009). It emphasises children’s connectedness to the world within which they live. It also highlights the importance of considering the multifaceted nature of the influences on development over the life-course. The conceptual model incorporates a model of the child’s relationship to the world outlined by Bronfenbrenner in 1979 and further developed in later years. Bronfenbrenner’s work offered a re-conceptualisation of the child’s ecology as a multilayered set of nested and interconnecting environmental systems all of which influence the
developing child, but with varying degrees of directness. The perspective has evolved since its early inception and today acknowledges the role of the child’s own characteristics, including biological factors in the overall development of the person, hence the model is now referred to as the bioecologicalmodel (Bronfenbrenner & Morris, 2006).
Within the bioecological model, the child is located at the centre of a set of concentric rings that represent the ecology of human life (Bronfenbrenner 1979; 2001). These systems are layered in terms of their influence on child development. In Figure 1.1 these systems or layers are represented as concentric circles, extending outwards from the individual child and his or her personal characteristics. Parents (and family members such as siblings and grandparents, if they are present) are the most influential part of the ecology in early child development as are, for example, school and childcare arrangements. As these have the most direct contact with the child, they are represented in the circle or layer immediately surrounding the individual (the
microsystem).
Other relationships within the household, aside from the child’s relationship with one or both parents, matter but parents and children also have relationships outside the household, for example in school and in the workplace, that connect the household to the wider community. To Bronfenbrenner this illustrates the intimate relationship between the microsystem, the face-to-face interactions which the child experiences, and the mesosystem, which encompasses the interactions amongst contexts in the microsystem– how families interact with schools, how parents’ worklife impacts on their parenting, how close family interacts with extended kin.
MACROSYSTEM
EXOSYSTEM Attitudes and idealogies of the culture
Extended family
Social welfare services Mass
media
Legal services Friends
of family
Neighbours School
Family
Health services
Church Group
Neighbourhood play area Daycare
centre
Peers MESOSYSTEM MICROSYSTEM
CHRONOS
YSTEM
CHILD
19 Figure 1.1: Bronfenbrenner’s Ecological Perspective on Child Development
Source: Adapted from Bronfenbrenner (1979) and Garbarino (1982)
Outside the mesosystemin Bronfenbrenner’s model sits the exosystem. This comprises the structures, institutions and settings which, whilst not in direct contact with children, exert an important influence upon their quality of life and outcomes. Examples of influential elements within the exosystem would be the Departments of State, which will have an important impact on their wellbeing through the systems they control, such as welfare services. The last ring of Bronfenbrenner’s schema is the macrosystem. This consists of the culture-specific ideologies, attitudes and beliefs that shape the society’s structures and practices as well as economic and political systems. Together these four levels (and the linking mesosystem) provide a comprehensive description of the wide range of factors that may influence the experiences and wellbeing of a child as he/she develops from birth to adulthood. The passing of time during this development, and time as a context for development, is important in Bronfenbrenner’s model. This has two aspects. The first is the individual’s lifetime. The second is the historical time or period effects associated with any particular point in history. Period effects will create a set of unique circumstances for the members of a given cohort. These period effects include the particular sociocultural context at any time, for example in moving from a period of economic boom to recession.
In the course of conducting Growing Up in Irelandit will be possible to use this model as a way of understanding the specific and distinctive processes that shape the development of Irish children. By adopting a whole child perspective and by locating the child in his or her complex and multilayered ecology and taking account of the multiple interacting and bi-directional influences on child outcomes, Growing Up in Irelandaims to determine the factors that promote or undermine the wellbeing of children in
contemporary Ireland and, through this, to contribute to the development of effective and responsive policies and services for children and their families. The adoption of this comprehensive, ecological framework underpins the decision to seek information on the children from multiple informants. Thus, information on the nine-year-olds is derived from the children themselves, their parents, their teachers and school principals and carers (when the carer has a major role in the child’s life).
1.2.3. TIMELINESS OF GROWING UP IN IRELAND
It is particularly appropriate that Growing Up in Irelandin its present form and scale should have been initiated at this time. Since the early 1990s unprecedented change in Ireland’s economy, sociodemography, culture, society and value systems has taken place (Whelan & Layte, 2006). From the early 1990s to 2007 Ireland experienced high levels of economic growth and has become increasingly secular and multicultural. It went from a position of high unemployment in the early 1990s to almost full employment, accompanied by increased female labour market participation and labour shortages in some sectors of the economy as recently as 2008. This has been associated in recent years with substantial increases in the prevalence of out-of-home and non-parental care for children of all ages. In some parts of the country commuting times to and from work increased substantially, often causing pressures and tensions in terms of working life balance and time available for family and children. Significant changes in family structures have occurred in this time period, with a substantial increase in non-marital births and lone parenting. Approximately 31% of births in Ireland today are outside marriage (Bonham, 2005). These trends in society, labour market and fertility are reflected in a situation in which approximately 22% of families with primary school children use some form of non-parental childcare arrangements1(Central Statistics Office, 2006).
In common with the international economy, throughout 2009 Ireland has witnessed major reversals in the buoyant economic climate which had prevailed over the previous decade. Levels of unemployment have risen sharply and house prices have fallen substantially (Barrett, Kearney, and O’Brien, 2008). A significant proportion of families have experienced a drop in their standard of living and more parents are now struggling to provide the best start in life for their children than has been the case for many years.
Notwithstanding the major economic changes experienced in 2008 and 2009, it is clear that the substantial social changes that have occurred in the last two decades and that influence children’s lives are likely to persist, such as, for example, the increasing numbers of children living in single-parent families. All of the changes noted since the early 1990s have had an impact on the structure of society and have replaced previous traditional certainties with new and often unaccustomed structures and processes, whose impact on children and childhood can only be guessed at in the absence of relevant research. Growing Up in Irelandwill provide important new and comprehensive information on the current position of children in Ireland and on how it changes over time.
1.3
DATA AND METHODOLOGY
1.3.1 DESIGN, RESPONSE RATES AND REWEIGHTING THE DATA
The sample of 8,570 nine-year-old children and their families was generated through the primary school system. A representative sample of 910 schools participated in the study – from the national total of 3,200 Primary schools. The sample of children and their families was then randomly generated from within those schools.
As is clear from the design of the study, response rates are relevant at two levels - the school and pupil levels. At the school level a rate of 82% was achieved. At the level of the household (i.e. eligible child selected within the school) a total of 57% of children and their families consented to participate in the study. All figures presented in this report are based on statistically grossed or reweighted data. This means that the information has been statistically adjusted to ensure that it is representative of all nine-year-olds in Ireland.2 The figures discussed throughout the report in the body of the text are those that are statistically significant at the 95% level. This means that, where the text notes that two figures are different, one can be sure 95 times in 100 that the differences in question are real differences and are not a function of the sample or sample design.
20
1The pre-school and current child care arrangements in the families in this cohort will be covered in a later report.
2The actual weighting system used is based on a minimum information loss algorithm which fits population marginals in a regression framework and adjusts the sample estimates to ensure that they produce estimates which match the population parameters. (See, for example, Gomulka, J. (1994) and (1992 ))
1.3.2 THE QUESTIONNAIRES
The sample design was chosen so as to facilitate data collection in the schools from principals, teachers and the children themselves. The following questionnaires were completed in the school:
1. Principal’s questionnaire
– recording details on the school, its resources, its management and its ethos 2. Teacher-on-self questionnaire
– recording demographic details on the teacher himself/herself 3. Teacher-on-child questionnaire
– recording details on each Study Child and his/her performance in school 4. Drumcondra English and Maths tests
– academic performance tests sat by all children participating in the study 5. Piers-Harris 2, self-concept questionnaire
– a self-completion instrument recording information on the child’s self-concept across a number of domains.
On completion of the school-based phase of the project interviewers visited the families of the nine-year-olds in their homes and administered the following core questionnaires to the Study Child and his/her caregivers:
1. Primary Caregiver – core questionnaire
2. Primary Caregiver – sensitive self-completion module 3. Spouse/partner of Primary Caregiver – core questionnaire
4. Spouse/partner of Primary Caregiver – sensitive self-completion module 5. Child core questionnaire
6. Child sensitive modules
7. A one-day time-use diary for the Study Child.
In addition to the above, the family was also asked to provide contact information for non-resident parents and other caregivers who delivered at least eight hours of care to the nine-year-old Study Child on a regular basis. This regular caregiving could be delivered in either a domestic or institutional setting (the latter including, for example, an after-school facility). This contact information was used by the Study Team to administer (on a postal basis) short self-completion questionnaires to non-resident parents and/or carers who provided either home-based or centre-based care on a regular basis. In the course of the household
interview the interviewer also recorded the height and weight of the Study Child and the Primary and Secondary caregivers (the latter where relevant).3
21 3A copy of all questionnaires administered to the nine-year-old cohort can be found at
1.4
THE CONTENT AND ORGANISATION OF THIS REPORT
In keeping with the conceptual framework described in the previous section the nine-year-old children are at the centre of this report. The second chapter introduces the children, where they are living and with whom. It outlines some of the key features of their living situations, such as the income available to their families and the educational and employment status of their parents.
The third chapter focuses on the children’s experience of family life with particular attention given to how the children are parented. Parents are one of the major influences on the children’s quality of life and on their behaviour. They are located in the microsystem according to Bronfenbrenner’s model.
In each following chapter the child’s characteristics and circumstances are described first, and the key influences on the child are described later in the chapter. Thus, Chapter Four describes the children’s health, including parental ratings of their child’s current health status and whether the child has a chronic illness, and also presents data on the children’s physical measurements, activity levels and eating habits. Data are described which illustrate the connection between a child’s weight and that of their parents.
Chapter Five considers health care utilisation by the Study Child and examines, among other issues, how often s/he has been admitted to hospital or has seen a GP. Health services are located in an outer ring of Bronfenbrenner’s model (in the exosystem) and play a crucial role in determining the health outcomes of Irish children.
Chapter Six examines the Study Child’s emotional health and wellbeing. Issues relating to the child’s self-concept, emotional strengths and difficulties and temperament are all considered. One aspect of the child’s ecology – their exposure to life events and stresses – illustrates the impact the wider environment has on the child’s emotional equilibrium.
Chapter Seven deals with the education of nine-year-olds starting with their educational achievement level and then examining some of the contextual variables that are likely to influence their performance, for example the characteristics of the school and those of the home.
Chapter Eight presents a consideration of the children’s peer relationships and focuses on some of the findings concerning bullying and victimisation among children. Again, features of the children’s context are examined in order to pinpoint the influence of important factors such as parental education and class on bullying behaviour.
Chapter Nine considers the activities in which the child is involved. These include structured and unstructured activities outside school.
Chapter Ten examines another aspect of the child’s exosystem, aspects of the neighbourhood and community settings within which nine-year-olds live and develop.
Finally, Chapter Eleven presents a brief summary of the main findings and outlines some policy implications.
23
CHARACTERISTICS OF
Single Parent 1 or 2 children Single Parent 3 or more children
Two parents 1 or 2 children
Two parents 3 or more children
% of 9-year
-ol
ds
50
40
30
20
10
0
11
7
35
47
Family type
24
2.1.
INTRODUCTION
Growing Up in Irelandis a pioneering study which enables policy formation aimed at targeting children on the basis of their developmental outcomes. The child’s characteristics, experiences and development are at the heart of the study. Understanding what children experience and their interaction with their world requires that we first know something about the environment in which they live. One of the most important aspects of this environment is, of course, the child’s family. The characteristics of the family, in terms of whether the child lives with both biological parents, other siblings or other extended kin, and the characteristics of these people, will structure the child’s daily life, shape what opportunities are open to them and what disadvantages they may face, and in so doing will have a major influence on the course of their future development.
This chapter describes some of the characteristics and circumstances of the nine-year-olds and their families. The chapter begins by looking at whom the child lives with; whether the child lives with one or both parents and the number of other children aged under 18 in the household; the number of siblings resident in the household, their ages and the age order of the Study Child in relation to those siblings; and the relationships of caregivers in the household to the Study Child. It then looks at the characteristics of parents, including their age, level of education, employment status, and citizenship. It goes on to describe the religious denomination and citizenship of the Study Child. The next section of the chapter provides a breakdown of the main classificatory variables used throughout the report. Finally, the chapter looks at the ways in which different family characteristics are related such as, for example, the income and social class groups of households led by a single parent or two parents together.
2.2
HOW MANY YEAR-OLDS AND IN WHAT KINDS OF FAMILIES DO
NINE-YEAR-OLDS LIVE?
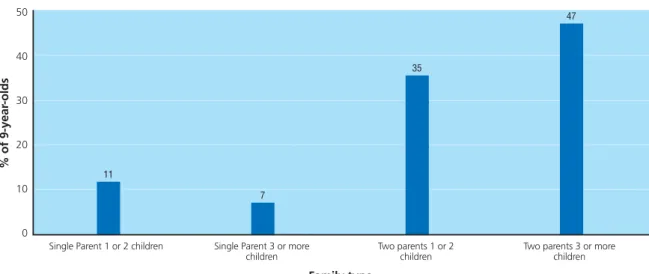
There are just over 56,400 nine-year-olds in Ireland, 51% of whom are male. Figure 2.1 summarises details on the family types in which these year-olds lived. This shows that a substantial majority (82%) of nine-year-olds lived in two-parent families – 35% in two-parent families with 1 or 2 children under 18 years and 47% in two-parent families with 3 or more children under 18 years. Historically, Ireland had larger family sizes than other European nations and this still pertains, with the effect that almost half of nine-year-olds lived in households with two or more other children. In Britain less than one-fifth of families have three or more children. Almost one-fifth of nine-year-olds in Ireland lived in single-parent families (18%) with 11% living in single-parent families with one other child, and 7% in single-parent families with two or more other children.
None 1 2 3 4 5 or more
% of 9-year
-ol
ds
35
30
25
20
15
10
5
0
10
32 33
17
6
3
Number of siblings
Siblings aged 0 to 5 Siblings aged 6 to 10 Siblings aged 11 to 15 Siblings aged 16 to 17 Siblings aged 18 or over
% of 9-year
-ol
ds
60
50
40
30
20
10
0
36
42
48
13
11
Age group of siblings
1For this reason the figures do not exactly match those in Figure 2.1, which looks only at children aged under 18 years in the household, regardless of their relationship to the Study Child.
2Note that these figures do not add to 100% as nine-year-olds can have siblings in more than one age category.
25 Figure 2.2 looks at the number of siblings living in the households in which nine-year-olds lived. It includes
all full, half-, step-, adoptive and foster-siblings of the Study Child and siblings aged under and over 18 living in the household1.
Figure 2.2: Number of siblings living in the household
One can see that 10% of nine-year-olds had no siblings resident in the household. Most nine-year-olds had one or two resident siblings (32% and 33% respectively).
Figure 2.3 shows the percentages of nine-year-olds with siblings in the age groups 0 to 5 years, 6 to 10 years, 11 to 15 years, 16 to 17 years, and 18 years or over. Almost half (48%) of nine-year-olds had siblings in the 11 to 15 year age group, followed by 42% in the 6 to 10 year age group and 36% in the youngest age group.
26 3Because one is considering only resident siblings this is age order within the household not birth order per se.
% of 9-year
-ol
ds
35
30
25
20
15
10
5
0
Age order of nine-year-olds in relation to siblings living in the household
Youngest Middle child Oldest Only child Twin (no other siblings)
33
25
31
10
1
Figure 2.4 shows the age order of the nine-year-olds in relation to other siblings who were living in the household.3 It shows us that one third (33%) of nine-year-olds were the youngest sibling in the household, almost one third (31%) were the oldest, and one quarter (25%) had both older and younger siblings. Figure 2.4: Age order of nine-year-olds in relation to other siblings living in household
The administration of the Growing Up in Irelandsurvey required that one adult in the household provided the majority of the information. To facilitate this, one adult, preferably a parent, was asked to self-identify as the ‘Primary Caregiver’ to the Study Child. The Primary Caregiver was defined as the person who provided most care to the child on a day-to-day basis and who knew most about him/her. If there was a resident partner or spouse of the Primary Caregiver they were then automatically nominated as the ‘Secondary Caregiver’.
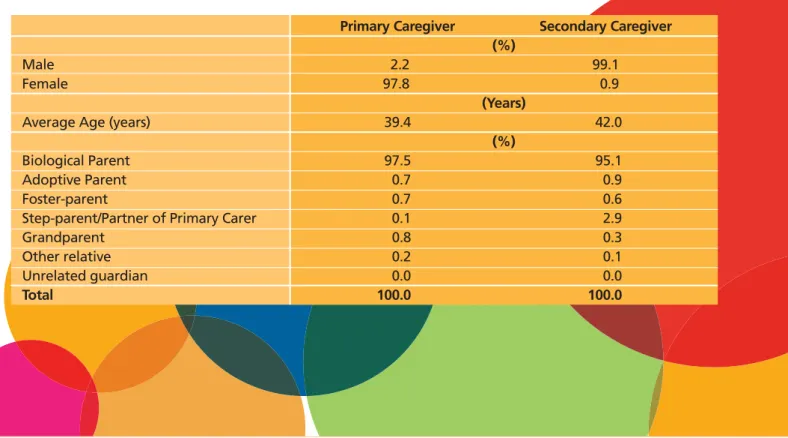
Table 2.1: Basic characteristics of Primary and Secondary Caregivers of nine-year-olds.
Primary Caregiver Secondary Caregiver
(%)
Male 2.2 99.1
Female 97.8 0.9
(Years)
Average Age (years) 39.4 42.0
(%)
Biological Parent 97.5 95.1
Adoptive Parent 0.7 0.9
Foster-parent 0.7 0.6
Step-parent/Partner of Primary Carer 0.1 2.9
Grandparent 0.8 0.3
Other relative 0.2 0.1
Unrelated guardian 0.0 0.0
Table 2.1 shows that the person nominated as the Primary Caregiver was generally the biological mother of the Study Child (98% of cases) with adoptive, foster-parents and grandparents being the next most frequent groups (each accounting for 0.7-0.8% of children). Just as the Primary Caregiver was most likely to be the biological mother, the Secondary Caregiver was most likely to be the biological father (95%). A greater proportion of Secondary Caregivers were likely to be step-parents or partners to the Primary Caregiver (2.9%). This largely reflects the fact that children are much more likely to live with their mother following partner separation and divorce in Ireland (and elsewhere). Overall, therefore, the figures indicate that the Primary Caregiver was almost (though not entirely) synonymous with the nine-year-old’s mother and the Secondary Caregiver with child’s biological father. For ease of presentation in the remainder of this report we refer to Primary and Secondary Caregivers as mother and father respectively.
2.3
THE CHARACTERISTICS OF MOTHERS AND FATHERS
Figure 2.5 outlines the proportion of mothers in different age groups. The average age of mothers of nine-year-olds in the study was just over 39 years. Figure 2.5 shows that 30% of mothers in the study were aged 35 to 39 with just over 31% aged 40 to 44 years. Only 3% of mothers were aged 50 or over and these individuals were often grandparents and step-parents rather than the child’s biological parent.
The average age of fathers was slightly older than mothers, at 42 years. Most fathers were aged 40 to 44 years (36%), 22% were aged 45 to 49 years and 10% were aged 50 or over. Only 2% of fathers were aged less than 30 years.
Figure 2.5: Proportion of mothers and fathers in different age groups
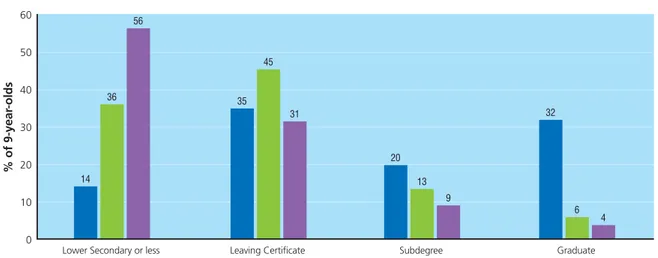
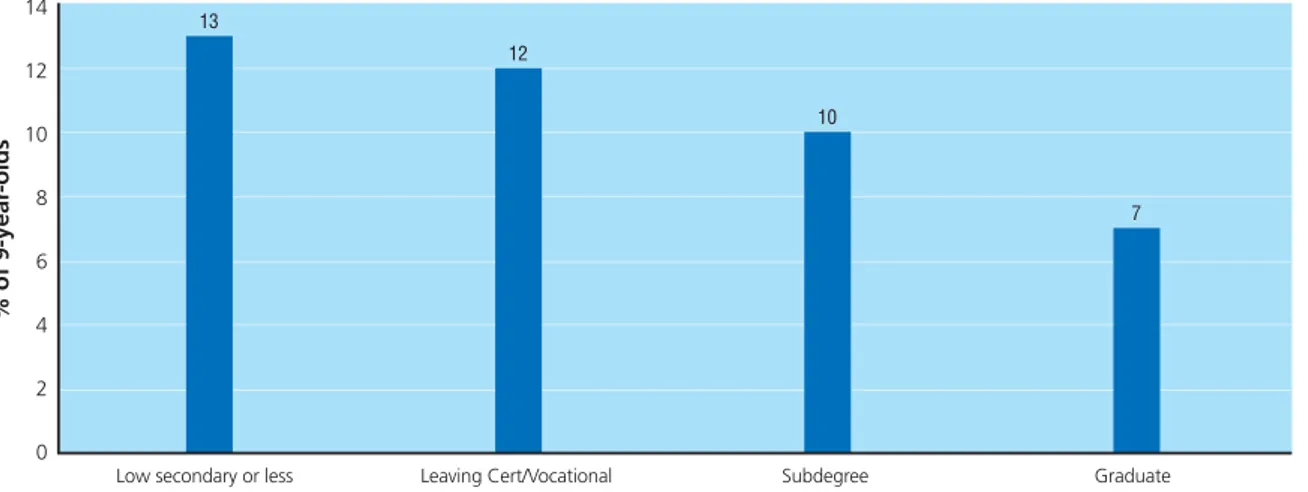
Figure 2.6 shows the highest educational qualification achieved by the mothers and fathers of the Study Children. Around one-third of children lived with mothers who had lower secondary education or less (that is, finished education with a Junior Certificate or less), a third with mothers with a Leaving Certificate and the same proportion with mothers who had obtained a subdegree or Third Level qualification. The educational profile of fathers was somewhat different, with a substantially lower proportion (22%) with higher secondary level qualifications but a higher proportion with a subdegree (23%) or degree level qualification (21%).
27 Less than 30
% of 9-year
-ol
ds
40
35
30
25
20
15
10
5
0
7 2
30-34
13 7
35-39
30 23
40-44
31 36
45-49
15 22
50+
3 10
Age group of mother and father Mother Father
28
Lower Secondary or less
Mother
% of 9-year
-ol
ds
40
35
30
25
20
15
10
5
0
31 35
Leaving Certificate
37
22
Subdegree
15 23
Degree
17 21
Father
Highest level of educational attainment
Figure 2.6: Highest level of educational attainment of mothers and fathers of nine-year-olds
The employment status of parents will be an important influence upon the daily interaction of the child with his/her parents as well as, potentially, the resources available to the child’s family. Participation in paid employment among Irish mothers increased strongly over the period of the recent economic boom in Ireland. More women working meant fewer full-time carers in the home but substantially larger average family incomes. The figures in Table 2.2 show that just under 54% of mothers and 91% of fathers were employed outside the home. Almost 39% of mothers defined themselves as being in ‘home duties’, i.e. a full-time carer. This was true of only 1.6% of fathers.
Table 2.2: Principal economic status of mothers and fathers and average number of hours worked among those who work outside the home.
Mothers Fathers
(per cent) (per cent)
Employee 46.8 59.6
Self-employed 6.4 26.8
Farmer 0.3 4.3
Full-time student 4.3 0.1
Unemployed/State Training Scheme, etc. 2.9 4.8
Home duties 38.7 1.6
Other 0.5 2.9
The kind of job in which parents work will be an important influence on the experiences of the child. Parents with higher levels of education are more likely to have non-manual and professional jobs, and these occupations bring with them higher levels of reward in the form of salaries. A large amount of research from a number of countries has shown that higher occupational positions among parents can substantially influence the educational attainment and job obtained by children, even controlling for the parents
education. Social class is a useful measure of occupation. In the Growing Up in Irelandstudy the highest class position among the parents is taken as the household’s class position and used in analysis. Figure 2.7
presents the proportion of children in households from each social class grouping. This shows that 47% of the nine-year-old children in the study lived in households where at least one parent was in a
Professional/Managerial social class group. Approximately 40% were in the Non-Manual or Skilled-Manual category and the remaining 13% were in the Semi-skilled or Unskilled Manual class group.
Figure 2.7: Social class of nine-year-old’s family
The religious denomination of mothers is given in Table 2.3. Mothers were presented with six choices of denomination and an open-ended ‘other’ category. Table 2.3 shows that the overwhelming majority of the mothers of nine-year-olds in Ireland were Roman Catholic (85%) with 9% recorded as having no
denominational affiliation.
Table 2.3: Religious denomination of mothers
Denomination Mothers
(per cent)
None 8.6
Non-denominational Christian 1.9
Roman Catholic 84.8
Anglican/CoI/Episcopalian 2.3
Other – Protestant 1.3
Other 1.0
Total 100.0
29
% of 9-year
-ol
ds
50
45
40
35
30
25
20
15
10
5
0
Social class of 9-year-old’s family
Professional / Managerial Other Non-Manual / Skilled Manual Semi-skilled / Unskilled Manual
47
40
Table 2.4 shows the proportion of mothers and fathers who were citizens of Ireland at the time of interview, whether or not they were born in Ireland, and (for those not born here) the length of time since first coming to live here. Just over 93% of mothers were Irish citizens and a substantial majority were born in Ireland (84%). Of the 16% of mothers who were not born in Ireland just over two-fifths came to Ireland more than 20 years prior to interview, with a further one-quarter arriving more than a decade ago. Patterns among fathers were similar overall, although a slightly higher proportion of those who were not born in Ireland had arrived more than two decades ago compared to patterns among mothers.
Table 2.4: Nine-year-olds’ mothers and fathers classified by whether or not they are (a) a citizen of Ireland, (b) they were born in Ireland and (c) length of time since first coming to live here.
Mothers Fathers
(per cent) (per cent)
Citizen of Ireland 93.1 93.3
Born in Ireland 84.1 85.2
Length of time since first coming to Ireland:
Within last year 1.6 1.3
1 – 5 years 16.0 16.0
6 – 10 years 23.5 23.5
11 – 20 years 16.7 13.2
More than 20 years 42.2 46.0
2.4
THE NINE-YEAR-OLD CHILD’S RELIGIOUS DENOMINATION AND CITIZENSHIP
The last section showed that 85% of mothers were Roman Catholic by religious denomination but it is quite possible that the Study Child had a different denomination. Actually, Table 2.5 shows that a higher
proportion of nine-year-olds in the Study ( 87%) were christened Roman Catholic. The proportion classified as having no denomination (7%) is slightly lower than among mothers.
Table 2.5: Religious denomination of nine-year-olds
Denomination 9-year-old
(per cent)
None 7.4
Non-denominational Christian 1.8
Roman Catholic 87.0
Anglican/CoI/Episcopalian 1.9
Other – Protestant 0.9
Other 1.0
Total 100.0
Table 2.6 presents information on whether or not the Study Child was a citizen of Ireland, whether or not he/she was born in Ireland and, for those not born here, length of time since first coming to live here. Almost 95% of children were Irish citizens and almost 9 out of every 10 (89%) were born here. A majority of those nine-year-olds not born in Ireland came to live here between 6 and 9 years ago (56%) and only 4% came to live here within the 6 years preceding the interview.
Table 2.6: Nine-year-olds classified by whether or not they are (a) a citizen of Ireland, (b) they were born in Ireland and (c) length of time since first coming to live here.
9-year-old (per cent)
Citizen of Ireland 94.8
Born in Ireland 89.2
Length of time since first coming to Ireland:
Within last year 4.4
1 – 5 years 39.7
6 – 10 years 55.9
2.5
CLASSIFICATORY VARIABLES USED IN REPORT
Throughout the report, in order to examine how children’s lives vary in different sociodemographic contexts, data are principally examined in relation to family social class, family income, family type, and mother’s highest level of educational attainment. These sociodemographic variables are briefly outlined below. 2.5.1 FAMILY SOCIAL CLASS
A social class classification was assigned to both mother and father (where the latter was resident) based on their respective occupations. In line with standard procedures, in two-parent families in which both partners were economically active outside the home the family’s social class group was assigned on the basis of the higher of the two4. A three-fold classification of family social class is used throughout this report:
Professional/Managerial, Other Non-Manual/Skilled-Manual and Semi-skilled/Unskilled Manual. 2.5.2 FAMILY INCOME GROUP
In order to make meaningful comparisons across families in terms of their total disposable income it is necessary to take household size and composition (number of adults and children) into account to create what is known as the ‘equivalised’ family income5. The nine-year-old’s family is then assigned to one of five income groups from lowest to highest. Each group (quintile) contains 20% of families. Thus, throughout the report the lowest family income group refers to the 20 per cent of families at the bottom of the income distribution (based on ‘equivalised’ family income or income adjusted to account for the size and
composition of the family). The second lowest income group includes the families in the next 20% of the income distribution, and so on.
2.5.3 FAMILY TYPE
A four-fold classification of family type is used: • Single-parent,1 or 2 children under 18 years • Single-parent, 3 or more children under 18 years • Two-parent, 1 or 2 children under 18 years • Two-parent, 3 or more children under 18 years.
As used throughout the report, single- and two-parent families refer only to the number of resident caregivers/guardians. The terms do not refer to the relationship of the caregiver to the Study Child.
Biological parents and others are included in the definition of single- or two-parent families although, as we saw in discussion of Table 2.1 above, mothers and fathers are overwhelmingly the caregivers of the children. The term ‘children’ in the four-fold classification above refers to all children aged under 18 years living in the household. It does not necessarily refer to siblings of the Study Child. There may also be siblings of the Study Child living in the household who are aged over 18 years but who are not included as children in the household.
31 4 This is based on a so-called dominance criterion.
5 To do this the number of ‘equivalised’ adult members resident in the household is calculated. This is done by assigning a weight of ‘1’ to the first adult; ‘0.66’ to all subsequent adults, and ‘0.33’ to each child (14 years or less). The total number of adult equivalents is then divided into the household’s total disposable income to give the household’s equivalised income. It is this measure of equivalised income which is used throughout the report.
2.5.4 HIGHEST LEVEL OF MATERNAL EDUCATIONAL ATTAINMENT
Much of the international literature on child development points to the importance of the mother’s educational attainment; in the literature this is identified as being relatively more important than father’s education. Throughout the report a four-fold classification of the educational attainment of the nine-year-old’s mother is used. This is based on the classification used in the Census of Population. The groups are:
• Lower Secondary or less (in the Irish system Junior Certificate or no formal education). • Leaving Certificate.
• Subdegree – not full degree status but 2½ level qualification (many of which qualifications will have been completed in a third level institution).
• Degree or Third Level.
2.6
INTERRELATIONSHIPS BETWEEN DIFFERENT CHARACTERISTICS
So far this chapter has shown a number of different characteristics of the Study Children and their parents. It is important to understand how these characteristics combine. For example, lower levels of education among parents may have very different implications for the experiences and development of the child if the mother or father is assigned to a higher social class group.
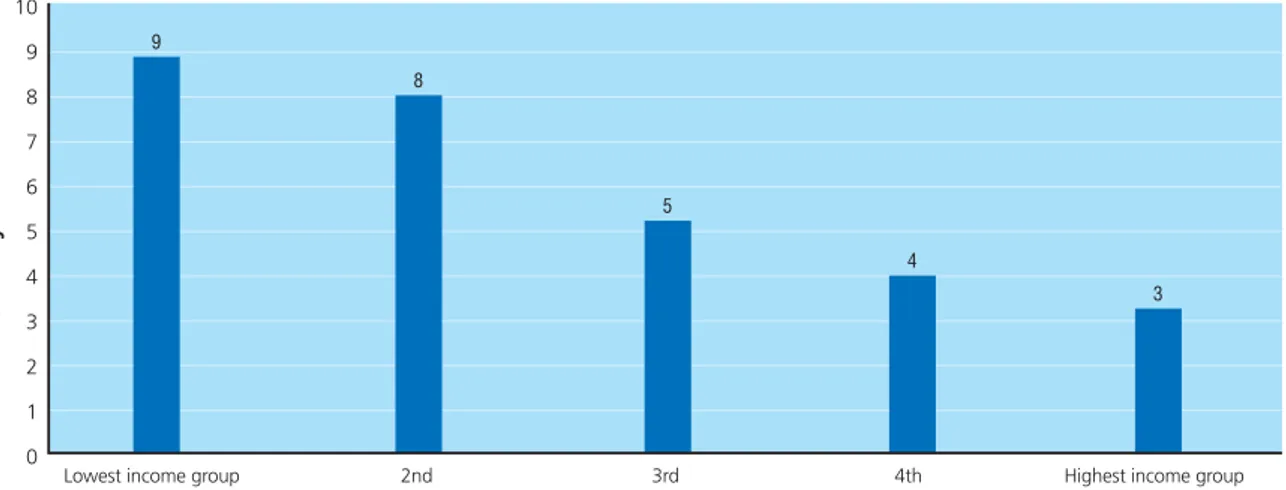
As one would expect there was a strong relationship between family social class, family income, and the highest level of mother’s educational attainment. Figure 2.8 illustrates the relationship between family social class and income group. As social class increases so too does the proportion of households in the higher income group. For example, 36% of nine-year-olds and their families who were in the
Professional/Managerial category were in the top income group. In contrast, only 4% of children whose parents were in the Semi-skilled or Unskilled Manual category were in the top income group.