HEAVY METAL ASSESSMENT IN INDUSTRIAL
GROUNDWATER IN AND AROUND VIJAYAWADA,
ANDHRA PRADESH, INDIA
T. Ravi Sankar and P. T. S. R. K. Prasada Rao
Keywords: Heavy metals, ground water, pollution, Vijayawada, industries.
Assessment of trace metals in ground water in industrial groundwater in and around Vijayawada, Andhra Pradesh, India was carried out. Samples were collected from 60 bore wells for this study. The present study was made assessing the impacts of industrial activities on the ground water quality in and around Vijayawada A.P. 60 ground water samples are collected from industrial areas of Vijayawada. The following metals, say, Pb, Cu, Ni, Fe, Ag, Zn, Mn, Cd, Cr and Co were analyzed in all the samples, The distribution maps served as important information to understand ecological status of the groundwater systems and for the identification of groundwater quality parameters with concentration above the allowable limits.
Corresponding Authors Fax: 91 866 2881852 Tel: 91 866 2882911
E-Mail: [email protected]
[a] Department of Chemistry, Acharya Nagarjuna University, Nagarjuna Nagar, Guntur, Andhra Pradesh INDIA [b] PG Department of Chemistry, P. B. Siddhartha College of
Arts & Science, Moghalrajpuram, Vijayawada – 520010, Andhra Pradesh, INDIA
Introduction
The ground water is an important source for drinking water. It plays an important role in ecological functions in various eco systems. Due to increase of industrialization urbanization gradually decreases the ground water quality in some regions during some periods due to unsustainable use of water resources. However the problem is differ in some developing countries where in the latter the threat of unavailability of good quality ground water1 is a life time
threat problem. Water is also called elixir of life. About 71% of the earth surface covered by water mostly in oceans and other large water bodies 1.6% of water present in ground in aquifers and 0.001% in the air as vapour, clouds and precipitation. If 70%to 90% by weight in living organism. In urban area 50% of ground water is used in all developing countries derived wells bore holes and springs. 1000 millions in Asia and 150 million people in Latin America rely on sources. Over 97% of water present In the oceans and other water bodies and these water not useful for most of the purpose and in the remaining 3%, 2% % of water is present in icecaps and glaciers, 0.62% of water was present in ground water.
Water is dispersion medium in many biochemical reactions2 which are responsible for the living process
therefore without water life cannot survive. So water is essential for life not only for humans but all life plants and animal. Hence the quality of water plays an important role in human life. Generally ground water is much clean than surface3 water but the abnormal growth of urbanization,
Industrialization further affected the ground water quality due to increasing of resources and improper draining of
wastage and effluents. One of another reason is large amount of wastage is concentrated in small area.
According to WHO 2.2 million people die from dieses causes from lake of safe drinking water4.(Global Water
Supply and Sanitation Assessment 2000 report). In general ground water is a suitable source for drinking water because of its high quality w.r.t others sources of water. Hence we need to protect and management of ground water quality5.
The main aim of this study is to carry out the quality analysis of physicochemical parameters of selected groundwater industrial areas in around the Vijayawada. The result of the study increases to understand identification of ground water contamination and reliable management of groundwater quality.
Study Area
Vijayawada is a commercial city located on the bank of Krishna river in Krishna district of Andhra Pradesh, India. It is the third largest city in Andhra Pradesh, with an area of 261.88 km2.
The city municipal limits has a population of 1,048,240 (2011 Census), while the population of the metropolitan area is 1,491,202. Located at 16.52° north latitude 80.62° east longitude and the average elevation of the land of the city of Vijayawada is about 39 feet above the sea level (Fig. 1). The northern, northwestern, and southwestern parts of the city are covered by a low range of hills, while the central, southwestern and northwestern parts are covered by rich and fertile agriculture lands with three major irrigation canals.
The main ground water recharging area in the study area is Krishna River and Eluru canal. The Krishna River passing on south side and Eluru canal passing on the North-East of our study area, Vijayawada. The ground water level in open-dug and bore wells are varying 2.5 to 3 meters below the ground level. The study area located North-East side of Vijayawada city (AutoNagar) south side (Morampudi and Pedavadlapudi, Atmakuru) and IDL (Ibrahimpatnam).
Geology and soil type in study area
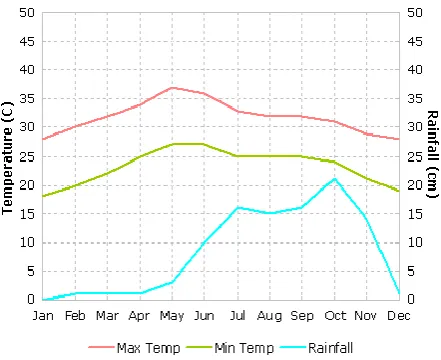
The study area has changed lithological formations ranging in age from archaean crystallines to recent alluvium. Depending upon the occurrence of these rock formations the area can be divided into three lithological provinces. i) The north and western part occupied by crystalline group of rocks comprising of khondalites, peninsular gneisses, dharwars and Proterozoic group of rocks, ii) North-eastern and central part occupied by Sandstones of Gondwana group and iii) Eastern and southern part occupied by River and Coastal Alluvia. There are four types of soils in the area, viz., black cotton soils (57.6%), sandy clay loams (22.3%), red loamy soils (19.4%), and sandy soils (0.7%). The sandy soils form a fringe along the coast. The black cotton soil is most extensive and occurs in Western part. The sandy clay loam formed along river. The climate is an integral part of the geography of Vijayawada. Marked by hot summers, the temperature in the summer months goes on ascending and can even reach up to 50 °C. The winter months on the other hand are cool and pleasant and the temperature varies from 10 to 30 °C. The region experiences regular rainfall, (Fig. 2) caused by the south-west and north-east monsoons. The area is somewhat prone to cyclones which have resulted in the place being nicknamed as "Blazewada”.
Figure 2. The average temperature and rainfall amount in a year
Materials and methods
The ground water samples are collected from bore and wells in the study area in the month of October 2012 .the sampling location are give table-1Deionised water used for the preparation of solution throughout the study. The samples are collected in clean HDPE bottles .the bottles are prewashed with laboratory grade detergent followed by adequate rinsing with deionized water. Two samples are collected in each sample site and the samples are acidified with 1.5ml of nitric acid per liter. And these samples are stored at 4°C before analysis.
Sample Analysis
Samples were categorized in five sections, as listed in Table 1. Samples were analyzed for trace metals6 (Pb, Cu,
Fe, Ag, Zn, Cd, Mn, Ni, Cd, and Co) using atomic absorption spectrophotometer (AAS, Shimadzu AA-6300). Analysis was carried out in triplicate and average values are reported.
Table 1. List of collected samples
S.No. Industry type No. of samples
Area/sample location
1 Chemical 13 Ibrahimpatnam, Vijayawada 2 Beverage/Diary 6 Morampudi,
Vijayawada 3 Electroplating
Alloys
20 Autonagar, Vijayawada 4 Power plants 4 Kondapally, Vijayawada 5 Automobiles and
Mechanical works
17 Autonagar, Vijayawada
The AAS was calibrated with relevant Shimadzu AAS spectroscopic grade standards. Flame atomic absorption spectrophotometer (Shimadzu double beam Atomic Absorption Spectrophotometer) (Direct determination - Flame: Pb, 0.1ppm; Furnace: Pb, 0.3ppb)
Results and discussions:
All the 60 samples were labeled properly and analyzed for the metal content. Sample were analyzed 5 times (n=5) and their SUM, Max, Min, Mean, STDEV, % RSD and AveDEV were obtained. The minimum, maximum and average trace metal concentrations7 in different parts of the
Vijayawada region has been presented in Table 2.
Lead (Pb)
The minimum and maximum lead concentrations varied between 0.012-0.153 mg/l all of the samples exceeded the relevant prescribed limits for drinking water for that element.
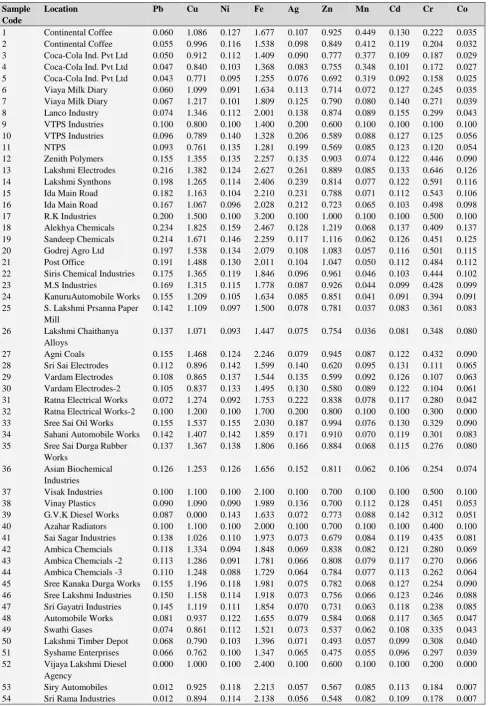
Table 2. The minimum, maximum and average trace metal concentrations in different parts of the Vijayawada region.
Sample Code
Location Pb Cu Ni Fe Ag Zn Mn Cd Cr Co
1 Continental Coffee 0.060 1.086 0.127 1.677 0.107 0.925 0.449 0.130 0.222 0.035 2 Continental Coffee 0.055 0.996 0.116 1.538 0.098 0.849 0.412 0.119 0.204 0.032 3 Coca-Cola Ind. Pvt Ltd 0.050 0.912 0.112 1.409 0.090 0.777 0.377 0.109 0.187 0.029 4 Coca-Cola Ind. Pvt Ltd 0.047 0.840 0.103 1.368 0.083 0.755 0.348 0.101 0.172 0.027 5 Coca-Cola Ind. Pvt Ltd 0.043 0.771 0.095 1.255 0.076 0.692 0.319 0.092 0.158 0.025 6 Viaya Milk Diary 0.060 1.099 0.091 1.634 0.113 0.714 0.072 0.127 0.245 0.035 7 Viaya Milk Diary 0.067 1.217 0.101 1.809 0.125 0.790 0.080 0.140 0.271 0.039 8 Lanco Industry 0.074 1.346 0.112 2.001 0.138 0.874 0.089 0.155 0.299 0.043 9 VTPS Industries 0.100 0.800 0.100 1.400 0.200 0.600 0.100 0.100 0.100 0.100 10 VTPS Industries 0.096 0.789 0.140 1.328 0.206 0.589 0.088 0.127 0.125 0.056 11 NTPS 0.093 0.761 0.135 1.281 0.199 0.569 0.085 0.123 0.120 0.054 12 Zenith Polymers 0.155 1.355 0.135 2.257 0.135 0.903 0.074 0.122 0.446 0.090 13 Lakshmi Electrodes 0.216 1.382 0.124 2.627 0.261 0.889 0.085 0.133 0.646 0.126 14 Lakshmi Synthons 0.198 1.265 0.114 2.406 0.239 0.814 0.077 0.122 0.591 0.116 15 Ida Main Road 0.182 1.163 0.104 2.210 0.231 0.788 0.071 0.112 0.543 0.106 16 Ida Main Road 0.167 1.067 0.096 2.028 0.212 0.723 0.065 0.103 0.498 0.098 17 R.K Industries 0.200 1.500 0.100 3.200 0.100 1.000 0.100 0.100 0.500 0.100 18 Alekhya Chemicals 0.234 1.825 0.159 2.467 0.128 1.219 0.068 0.137 0.409 0.137 19 Sandeep Chemicals 0.214 1.671 0.146 2.259 0.117 1.116 0.062 0.126 0.451 0.125 20 Godrej Agro Ltd 0.197 1.538 0.134 2.079 0.108 1.083 0.057 0.116 0.501 0.115 21 Post Office 0.191 1.488 0.130 2.011 0.104 1.047 0.050 0.112 0.484 0.112 22 Siris Chemical Industries 0.175 1.365 0.119 1.846 0.096 0.961 0.046 0.103 0.444 0.102 23 M.S Industries 0.169 1.315 0.115 1.778 0.087 0.926 0.044 0.099 0.428 0.099 24 KanuruAutomobile Works 0.155 1.209 0.105 1.634 0.085 0.851 0.041 0.091 0.394 0.091 25 S. Lakshmi Prsanna Paper
Mill
0.142 1.109 0.097 1.500 0.078 0.781 0.037 0.083 0.361 0.083 26 Lakshmi Chaithanya
Alloys
0.137 1.071 0.093 1.447 0.075 0.754 0.036 0.081 0.348 0.080 27 Agni Coals 0.155 1.468 0.124 2.246 0.079 0.945 0.087 0.122 0.432 0.090 28 Sri Sai Electrodes 0.112 0.896 0.142 1.599 0.140 0.620 0.095 0.131 0.111 0.065 29 Vardam Electrodes 0.108 0.865 0.137 1.544 0.135 0.599 0.092 0.126 0.107 0.063 30 Vardam Electrodes-2 0.105 0.837 0.133 1.495 0.130 0.580 0.089 0.122 0.104 0.061 31 Ratna Electrical Works 0.072 1.274 0.092 1.753 0.222 0.838 0.078 0.117 0.280 0.042 32 Ratna Electrical Works-2 0.100 1.200 0.100 1.700 0.200 0.800 0.100 0.100 0.300 0.000 33 Sree Sai Oil Works 0.155 1.537 0.155 2.030 0.187 0.994 0.076 0.130 0.329 0.090 34 Sahani Automobile Works 0.142 1.407 0.142 1.859 0.171 0.910 0.070 0.119 0.301 0.083 35 Sree Sai Durga Rubber
Works
0.137 1.367 0.138 1.806 0.166 0.884 0.068 0.115 0.276 0.080 36 Asian Biochemical
Industries
0.126 1.253 0.126 1.656 0.152 0.811 0.062 0.106 0.254 0.074 37 Visak Industries 0.100 1.100 0.100 2.100 0.100 0.700 0.100 0.100 0.500 0.100 38 Vinay Plastics 0.090 1.090 0.090 1.989 0.136 0.700 0.112 0.128 0.451 0.053 39 G.V.K Diesel Works 0.087 0.000 0.143 1.633 0.072 0.773 0.088 0.142 0.312 0.051 40 Azahar Radiators 0.100 1.100 0.100 2.000 0.100 0.700 0.100 0.100 0.400 0.100 41 Sai Sagar Industries 0.138 1.026 0.110 1.973 0.073 0.679 0.084 0.119 0.435 0.081 42 Ambica Chemcials 0.118 1.334 0.094 1.848 0.069 0.838 0.082 0.121 0.280 0.069 43 Ambica Chemcials -2 0.113 1.286 0.091 1.781 0.066 0.808 0.079 0.117 0.270 0.066 44 Ambica Chemcials -3 0.110 1.248 0.088 1.729 0.064 0.784 0.077 0.113 0.262 0.064 45 Sree Kanaka Durga Works 0.155 1.196 0.118 1.981 0.075 0.782 0.068 0.127 0.254 0.090 46 Sree Lakshmi Industries 0.150 1.158 0.114 1.918 0.073 0.756 0.066 0.123 0.246 0.088 47 Sri Gayatri Industries 0.145 1.119 0.111 1.854 0.070 0.731 0.063 0.118 0.238 0.085 48 Automobile Works 0.081 0.937 0.122 1.655 0.079 0.584 0.068 0.117 0.365 0.047 49 Swathi Gases 0.074 0.861 0.112 1.521 0.073 0.537 0.062 0.108 0.335 0.043 50 Lakshmi Timber Depot 0.068 0.790 0.103 1.396 0.071 0.493 0.057 0.099 0.308 0.040 51 Syshame Enterprises 0.066 0.762 0.100 1.347 0.065 0.475 0.055 0.096 0.297 0.039 52 Vijaya Lakshmi Diesel
Agency
55 Sree Uma Maheswara Mech.
0.013 0.826 0.161 3.889 0.139 0.509 0.114 0.133 0.102 0.008 56 Automobile Compacts 0.013 0.802 0.157 3.775 0.135 0.494 0.111 0.129 0.099 0.008 57 Krishan Moulds 0.013 0.776 0.152 3.655 0.130 0.479 0.107 0.125 0.096 0.007 58 Siva Sankar Casting
Works
0.011 0.928 0.137 1.963 0.080 0.628 0.101 0.135 0.160 0.006 59 Sai DurgaTurning Works 0.222 1.713 0.158 2.597 0.045 1.508 0.243 0.133 0.342 0.130 60 Rockwell Industries 0.093 1.093 0.127 2.279 0.064 0.943 0.143 0.136 0.178 0.054
Figure 2. The heavy metal contamination of sample sites
Lead8 enters the water (“leaches”) through contact with
the plumbing. Lead leaches into water through corrosion – a dissolving or wearing away of metal caused by a chemical reaction between water and your plumbing. Lead can leach into water from pipes, solder, fixtures and faucets (brass), and fittings. The amount of lead in your water also depends on the types and amounts of minerals in the water, how long the water stays in the pipes, the amount of wear in the pipes, the water’s acidity and its temperature.
Copper (Cu)
The minimum and maximum copper concentrations were found to be ND and 1.85 mg/L respectively. Out of 60, 40 water samples exceeded the Cu maximum contaminant limits stipulated for drinking water. Cu enters the water system through mineral dissolution, industrial effluents, because of its use as algaecide, agricultural pesticide sprays and insecticide. Cu may be dissolved from water pipes and plumbing fixtures, especially by water whose pH is below 7. Cu salts are sometimes purposely added in small amounts to water supply reservoirs to suppress the growth of algae. Therefore Cu is more readily available for solution in surface and ground water than its low average abundance in rocks might imply
Iron (Fe)
The minimum and maximum iron concentrations varied between 1.347mg/l Measurable concentrations of the metal were found in all samples. However, all samples exceeded the relevant prescribed limits for drinking water Iron exists naturally in rivers, lakes, and underground water. It may also be released to water from natural deposits, industrial wastes, refining of iron ores, and corrosion of iron containing metals.
Silver (Ag)
The maximum and minimum concentration o f silver varied between 0.05- 020 mg/l. Measurable concentration of the metal was found in all samples. In some of the samples the concentration of the metal exceeds the limits. It released from a large area, such as an industrial plant or from a container, such as a drum or bottle, it enters the environment as a chemical emission.
Zinc (Zn)
The maximum and minimum concentration of zinc metal varied between the 0.05 -1.5 mg/l. In all samples measurable concentration of Zn is found. The metal concentration is not exceed the limits. Zn has lots of use like galvanization of steel, preparation of negative plates in electric batteries, vulcanization of rubber, wood preservatives and antiseptics and in rat and mouse poison (Zn-phosphide)17. Zn is also used extensively as a white pigment, zinc oxide (ZnO) in paint and rubber.
Manganese (Mn)
The minimum and maximum manganese concentrations varied between 0.02-0446 mg/l. Measurable concentrations of the manganese metal were found in all samples. However, only 15 of the samples exceeded the relevant prescribed limits for drinking water for that element. Mn is a very reactive element, found in nature and used extensively in industry for the manufacture of glass, ceramics, batteries, paints, varnishes, inks, dyes and fireworks14. However, in ground waters subject to reducing conditions Mn can be leached from the soil and occur in high concentrations
Cadmium (Cd)
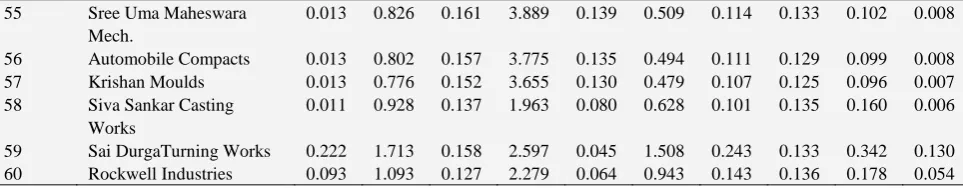
Figure 3. Distribution of heavy metal elements along the sample sites
Chromium (Cr)
The minimum and maximum Cr concentrations were found to be 0.096-0.646 mg/l respectively. Sixty water samples had measurable concentrations of Cr metal. However, the entire sample exceeded the Cr maximum contaminant limits stipulated for drinking water.
Hexavalent chromium can enter water through industrial contamination from manufacturing facilities, including electroplating factories, leather tanneries and textile manufacturing facilities, or from disposal of fluids used in cooling towers before 1990. It also occurs naturally in some minerals. The commonly used tap water disinfectant chlorine can transform trivalent chromium into toxic hexavalent chromium. Chromium-6 is also produced by industrial processes and manufacturing activities including discharges from steel and pulp mills among others.
Nickel (Ni)
Sixty water samples had measurable concentrations of Ni between 0.093-0.157 mg/l However, none of the samples exceeded the Cr maximum contaminant limits stipulated for drinking water. Ni enters groundwater and surface water sources by dissolution from rocks and soils, from biological recycling, from atmospheric fallout and especially from industrial wastes. Through leaching from Ni-containing pipes
Pb
Cu
Ni
Fe
Ag
Zn
Mn
Figure 3. Cont.in the next column.
Cd
Cr
Cobalt (Co)
The minimum and maximum cobalt concentrations were found to 0.007-0.137 mg/l. Out of the 60 samples none of the samples are found to be exceeds the limits. The Sources of environmental cobalt are both natural and anthropogenic13. Natural sources include erosion
(wind-blown continental dusts), weathering of rocks and soil, seawater spray, volcanoes, forest fires, extraction by plants, and continental and marine bionic emission.
Conclusions
The result shows that ground water quality assessment9
helps to identify the significant parameters of water samples were collected from bore wells covering the Vijayawada industrial region. The minimum and maximum trace metals concentrations10 in different areas for, Pb, Cu, Fe, Ag, Zn,
Cd, Mn, Ni, Cd, and Co are 0.012-0.153 , 0.00 and 1.85, 0.00 -1.347, 0.05- 020, 0.05 -1.5, 0.2-0.446, 0.081 - 0.155, 0.096-0.646, .007-0.137, 0.093-0.157 mg/L respectively. Trace metals like Cd, Cr, Fe, Mn and exceeded the maximum limits according to WHO and IS10500 2012 for drinking water11 in several sampled bore wells in the
Vijayawada region. It is recommended to use some kind of inexpensive treatment to reduce the levels of trace metals12
in areas supplying water directly to consumers without any treatment. From the obtained results it is evident that, at present the metal ion concentrationis not at the levels which could be harmful for humans13. But still the study clearly
points out that the concentrations of toxic metals are present in slight excess in some locations. It indicates precautionary measures should be immediately taken to avoid the consequences.
Acknowledgement
The authors express their deep sense of gratitude and sincere thanks to Mr. Sammaiah for assistance in water analysis in all these studies.
References
1Rizwan, U., Riffat, N. M., and Abdul,Q., Afr. J. Env. Sci. Technol.,
2009,3(12), 429-446.
2 Pacyna, J. M., Pacyna, E. G. and Asa, W., Atm. Environ., 2009,
43(1), 117-127.
3 Satyanarayana, T. and Guru Prasad, B., J. Nat. Environ. Pollut.
Techn.2006, 5(3), 459-461.
4 Schulze, E., WHO, Geneva 1984(2), 335.
5 Chaitali V. M., Jayashree, D., Int. J. Innov. Res. Sci. Eng. Tech.,
2013, 2(7), 2992.
6Catherine, G., Richard, G., and Philippe Q., Ed(s), Rapid
Chemical and Biological Techniques for Water Monitoring,
2009.
7 Ehi-Eromosele, C. O., Okiei, W. O., Resourc. Environ., 2012,
2(3), 82. doi: 10.5923/j.re.20120203.01
8Clescexi, L. S., Arnold, E., Greenberg, R. and Rhodes, T.,
Standard methods for the examination of water and waste-water. APHA,Washington D.C. 2005.
9Janardhana Rao, D., Hari Babu, B., Swami, A.V.V.S., and
Sumithra, S., Univ. J. Environ. Res. Tech.,2013, 3(2), 225.
10Shaheda, N., Swamy, A.V.V.S., Syamala Devi, K., Int. J. Eng.
Sci. Res.,2013, 3(8), 419.
11Hem, J. D., Study and Interpretation of the Chemical
Characteristics of Natural Water, 3rd Ed., Scientific
Publishers, Jodhpur 1991, 73-122.
12Borah, K. K., Bhuyan, B., and Sarma, H. P., E-J. Chem., 2009,
6(S1), S501.
13Botkin, B. D., Keller, E.A., Environmental Science: Earth as a
Living Planet. New York: Wiley; 2005.