EVALUATION OF THE CHEMICAL AND MICROBIOLOGICAL
CONTAMINATION OF THE RIVER SITNICA WATERS
(KOSOVO): A STATISTICAL APPROACH
Fatbardh Gashi
[a], Bardha Korca
[a]*, Kemajl Kurteshi
[b], Fatmir Faiku
[a],
Muhamet Domuzeti
[a]and Sadije Gashi
[a]Keywords: Chemical and microbiological evalution, Sitnica water, contamination, statistical analysis.
Chemical and microbiological contamination of ground water has several implications for human health. The study of chemical and microbiological contamination of water is carried out in Sitnica river (Kosova). Water samples are collected at 10 sampling points and fourteen different parameters are investigated. The program, Statistica 6.0, is used for calculations of basic statistical parameters and anomalies (extremes and outliers). The chemometric approach and the results yielded useful information about water quality and can lead to better water resource management. Dendograms and box-whisker plots are drawn to evaluate the chemical variation. The level of some microbiological and phsico-chemical parameters and eco-toxic ions from surface water are compared with the results from the river source where anthropogenic effects are negative. Our results show that chemical and microbiological pollutions are the results of anthropogenic factors coming from settlements, peripheral rivers and agricultural in the region surround.
* Corresponding Authors
E-Mail: [email protected]
[a] Department of Chemistry, Faculty of Natural Sciences, St. M. Teresa 10, University of Prishtina, Kosovo
[b] Department of Biology, Faculty of Natural Sciences, St. M. Teresa 10, University of Prishtina, Kosovo
Introduction
The sources of microbial and chemical contamination are numerous and include the land disposal of sewage effluents, sludge and solid waste, septic tank effluent, urban runoff, and agricultural, mining and industrial practices.1,2 Chemical contamination of drinking water is
often considered a lower priority than microbial contamination by regulators, because adverse health effects from chemical contaminations are generally associated with long-term exposures, whereas the effects from microbial contamination are usually immediate.3
The quality of drinking water is an issue of primary interest for the residents of the European Union.4 In peat
bogs, water flows freely in the active layer of water or acrotelm. Water storage is critical to the balance of water in peat swamps and at surrounding areas. Logging activity, agriculture, peat extraction and destruction of peat swamp drainage activity also give a negative effect and has a bad implication on the hydrology.5
Decomposition of organic matter and pollution due to anthropogenic activity are the main sources of pollution of water.6 Therefore, multidisciplinary collaborative
research is essential for understanding the pollution processes. As reported by Brils,7 adequate water quality
in Europe is one of the most eminent concerns for the future. Good management of natural and environmental waters will give results if leading institutions constantly monitor information about environmental situation. Therefore, seeing it as a challenge for environmental chemists, our goal is to determine the amount and nature of pollutants in the environment.
This work is a continuation of our earlier studies of surface waters in Kosovo.8-11 One could claim that the
most polluted areas in the world are those with the dense population. It should therefore be the foremost goal of environmentalists to prevent such pollution, and to educate the population towards proper management of ecosystems.12
The aim of the current work is to perform, a systematic research on the water of Sitnica river. The research is about chemical and microbiological aspects as they affect directly and indirectly the water quality, also impact the aquatic life. A major impact will be on biota where a large amount of this river flow is used for irrigation of agricultural lands and thus it may have an indirect impact on people's lives as they consume agricultural products that can deposit pollutants in the body of people through the food chain.13
Experimental
Study area
The objective of this study is microbial and chemical examination of water quality of Sitnica (length = 90 km). Sampling strategy was planned at 10 monitoring stations spread over the source in the mountain and downstream to the end of the river within Kosovo’s territory. Although there are more than 50 water quality parameters available, only 14 parameters are selected for our investigation. These parameters are: water temperature, conductivity, pH, turbidity, consumption of KMnO4, total
locate pollution sources. Surface water sampling of champions and their elaboration at the depth ≥ 20 cm are done with Pyrex non-contaminating bottles according to standards methods for surface water.14 Some of the
natural water samples are filtered with Whatman paper (0.45 μm) made from cellulose nitrate in the bottle of Teflon under pressure of nitrogen (purity 99.99 %).
Sampling and sample preparation
For chemical analysis water samples are collected on 3 March 2010 in plastic bottles, previously rinsed three times with sampled water, and labeled with the date and the name of the sample. These samples are transferred to refrigerator (at 4 °C) for analysis in the laboratories.
For bacteriological evaluation, samples, taken on 7 March 2010, in plastic sterile bottles are refrigerated (at 4°C) and transported immediately to laboratory and analyzed on the same day.
All tests are performed at least thrice to calculate the average value. The sampling locations are chosen at points where pollution is expected due to closeness of factories, traffic, settlements or combinations of these factors. Sampling, preservation and experimental procedure for the water samples are carried out according to the standard methods for examination of water.15-18
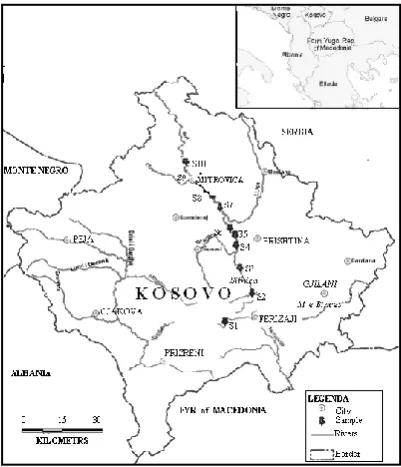
Samples are preserved in refrigerator after treatment. The study area and the sampling locations are shown in Figure 1. The details about sampling sites are presented in Table 1.
Figure 1. Study area with sampling stations.
Chemical and microbiological characterization
Double distilled water was used in all experiments. All instruments are calibrated according to manufacturer’s recommendations. Temperature of water was measured immediately after sampling, using digital thermometer, model Quick 63142. pH measurements were performed
using pH/ion-meter of Hanna Instruments. Electric conductivity is measured by InoLab WTW conductometer, turbidity with turbidimetric method with formazine standard, chemical expense with KMnO4 using
Thiemann Küebel volumetric method (boiling in acidic environment). Some of physico-chemical parameters (total oxygen, NO2-, NO3- and NH4+) are determined
using UV-VIS spectrometry method.
Table 1. Detailed description of sampling stations.
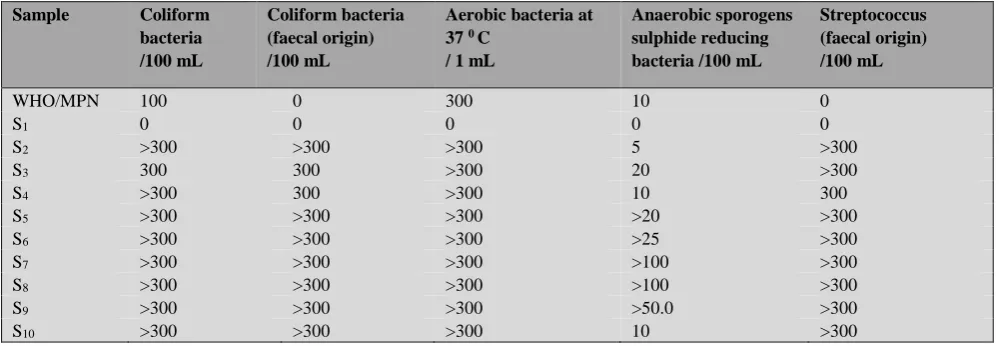
The total coliform bacteria are evaluated at 30 °C (agar plate) according to probable number technique (MPN) per 100 mL. The coliform bacteria of fecal origin were evaluated at 44 °C (endo agar plate). The total aeorobic bacteria in 1 mL are evaluated at 37 °C (plate count agar) according to “colony star” (Frank Gerber), 1MPN technique. Sulphide reducing anaerobic sporogens bacteria are evaluated at 37 °C (sulphite agar plate). The streptococcus bacteria of fecal origin are evaluated in 100 mL of water.
Statistical Methods
Program Statistica 6.019 is used for all statistical
calculations such as determination of basic statistical parameters (mean, geometric mean, median, maximum minimum variance and standard deviations) and determination of anomalies (extremes and outliers) for solution data. Outlier values are between 1.5 and 3, and extreme values are above 3 standard deviations.
Results
The physico-chemical parameters i.e. water temperature, EC, pH, turbidity, consumption of KMnO4, total oxygeny
and concentrations of NO2ˉ, NO3ˉ and NH4+ are presented
in Table 2.
Sample Locality Coordinates Possible pollution sources
S1 Jezerc 34T 0501340 UTH4689442
Settlement
S2 Rubofc 34T 0511168 UTH0701529
Waste water, agriculture
S3 Lypjan 34T 0509360 UTH4706698
Road, waste water from Lypjan
S4 Lismir 34T 0505443 UTH4721072
Settlement, agriculture, flotation waste, waste water from Prishtina
S5 Palaj 34T 0504992 UTH4725302
Agriculture, waste water from Fushë kosova S6 Plemetin 34T 0503152
UTH4728263
Thermal power plant, waste water from Kastriot S7 Pestova 34T 0499284
UTH4736665
Agriculture
S8 Vushtrri (exit)
34T 0496273 UTH4741288
Agriculture, tin factory, waste water from Vushtrria S9 Mitrovica
(exit)
34T 0490408 UTH4749416
Phosphate and accu factory, settlement, road, waste water from Mitrovica S10 Zveqan 34T 0487012
UTH4754445
Table 2. Some physico-chemical parameters of the river water
Table 3. Microbiological parameters of the river water
Sample Coliform bacteria /100 mL
Coliform bacteria (faecal origin) /100 mL
Aerobic bacteria at 37 0 C
/ 1 mL
Anaerobic sporogens sulphide reducing bacteria /100 mL
Streptococcus (faecal origin) /100 mL
WHO/MPN 100 0 300 10 0
S1 0 0 0 0 0
S2 >300 >300 >300 5 >300
S3 300 300 >300 20 >300
S4 >300 300 >300 10 300
S5 >300 >300 >300 >20 >300
S6 >300 >300 >300 >25 >300
S7 >300 >300 >300 >100 >300
S8 >300 >300 >300 >100 >300
S9 >300 >300 >300 >50.0 >300
S10 >300 >300 >300 10 >300
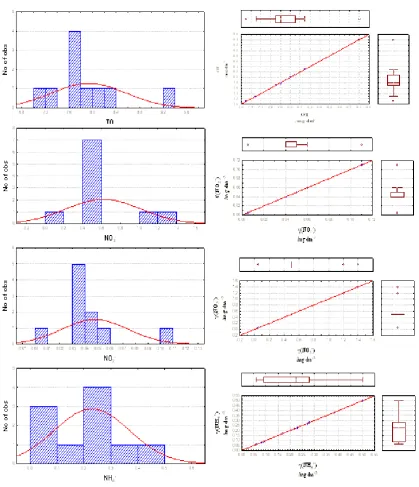
The bacteriological parameters viz. total coliform bacteria, coliform bacteria of fecal origin, number of aerobic bacteria, numbers of anaerobic sulphide reducing sporogens and streptococcus of fecal origin are presented in Table 3. The basic statistics of the measured data set and anomalous values (outliers and extremes) from 9 variables of water are summarized in Table 4. Using experimental data (Table 2) and box plot approach of Tukey20, anomalous values (extremes and outliers) in
waters were determined for the whole region (Figure 2).
Discussion
The temperature variation at different locations of the river, indicated by the in situ readings, is given Table 2. The pH of the investigated samples, ranging from 7.09 to 7.93, indicates that all water samples are slightly alkaline. Electrical conductivity, ranging from 297-594 μScm−1, is within highest desirable limit (HDL). If we compare EC separately, the lowest value is observed at S2 station and
the highest value is observed at S4 station. Higher EC
values indicate the presence of higher content of dissolved salts in the water. The lowest value of turbidity is observed at point S1 (near the river source) while at all
points we observed higher values of turbidity coming
from settlements, gravel separations and anthropogenic waste. Consumption of KMnO4 has maximum values at
S2 and S4 while the lowest vale is at S1. The total oxygen
(TO) is in the range of 7.1 mg L-1 at S
4 and 9.4 mg L-1 at
S1(source of the river).
Presence of nutrient salt of nitrogen in water as ammonia, nitrites and nitrates causes the process of eutrophication.21 The concentration of ammonia presents
the potentional risk for the aquatic organisms. Total ammonia values changed downstream of the river and the lowest value is found at point S1 and highest value at
points S5 and S6. The highest value of NO2- is found at S4
and that for NO3- it is found at points S6 and S7.
Concentration of NO2-, NO3- and NH4+ are within highest
desirable limit (HDL) according to WHO standards for drinking water.
Statistical methods are applied to find anomalous values also. Outlier value for NH4+ (0.5 µg L-1) is found
in the S5 sample, extreme for NO2- (0.11 µg L-1) is in the
S2 sample and extreme for NO3- (1.2-1.4 µg L-1) is found
in S6 and S7 samples.
The National Primary Drinking Water Regulations (NPDWRs) have prescribed limits of the amount of total coliforms, faecal coliform, E. coli, Salmonella spp.
Sample Water temp. /º C
EC /μS cm−1
pH /1
Turbidi-ty, / NTU
Cons. of MnO4
-/mg L-1
TO /mg L-1
NO2ˉ
/mg L-1
NO3ˉ
/mg L-1
NH4+
/mg L-1
S1 11.90 405 7.18 0.13 11.06 9.4 0.005 0.05 0.06
S2 11.90 297 7.34 94 37.83 8.3 0.06 0.50 0.09
S3 11.80 309 7.39 79 28.44 7.8 0.05 0.50 0.08
S4 11.90 594 7.09 51 37.6 7.1 0.11 0.50 0.17
S5 11.80 423 7.93 91 26.86 7.7 0.05 0.50 0.38
S6 11.90 446 7.84 92 23.70 7.8 0.04 1.20 0.50
S7 11.90 435 7.51 61 24.65 7.8 0.04 1.40 0.27
S8 11.90 455 7.73 69 24.33 8.0 0.04 0.50 0.22
S9 12.00 462 7.68 59 30.02 7.3 0.04 0.50 0.28
Table 4. Basic statistical parameters for 9 variables in 10 water samples.
Variable Descriptive Statistics
Mean Geo. mean Median Minimum Maximum Variance SD
Water temp. /°C 11.9 11.9 11.9 11.8 12.0 0.003 0.05676 EC /μS cm−1 427.1 419.7 440.0 297.0 594.0 6885.656 82.97985
pH /1 7.54 7.53 7.56 7.09 7.93 0.079 0.28143
Turbidity/NTU 65.51 37.85 65.0 0.13 94.00 771.943 27.78386 Cons. of MnO4- /mg L-1 26.66 25.44 25.76 11.06 37.83 60.128 7.75423
TO /mg L-1 7.93 7.91 7.80 7.10 9.40 0.391 0.62548
NO2- /mg L-1 0.0475 0.0391 0.0400 0.0050 0.1100 0.001 0.02617 NO3- /mg L-1 0.6150 0.4805 0.5000 0.0500 1.4000 0.152 0.39019 NH4+ /mg L-1 0.2280 0.1874 0.2250 0.0600 0.5000 0.019 0.13911
Shigella spp. and Vibrio spp. as primary standards to protect the health of the public by limiting the levels of contaminants in drinking water.22 In the present study
(Table 3) the number of total coliform bacteria in 100 mL river water is found to be greater than 300 in samples S2
-S10 and are well above recommended number by WHO
standards (MPN = 100). The number of total coliform bacteria of faecal origin (in100 mL river water) is greater than 300 in samples S2-S10 and are above recommended
number by WHO standards (MPN = 0). Osuinde and Enuezie reported that high coliform count obtained in water samples may be attributed to faecal contamination of the water sources.23 Hence none of the water samples
analyzed complies with EPA standard for coliform in water. According to EPA standard, every water sample that has coliform must be analyzed for either faecal coliforms or E. coli to ascertain whether the source of contamination is from human or animal waste, and possibly pathogenic bacteria or organism, such as Gardia and Cryptosporidium, may be present. The number of aerobic bacteria in 1 mL at 37 °C are found to be greater than 300 in samples S2-S10 (MPN = 300). The number of
sulfide reducing anaerobic sporogens bacteria in 100 mL is above the recommended number by WHO standards (MPN = 10) in S3 and in S5-S9. The number of
streptococci bacteria of faecal origin in 100 mL is greater than 300 in samples S2-S10 and therefore much above the
recommended number by WHO standards (MPN = 0).
Conclusions
The chemical and microbiological analysis shows that Sitnica river water is highly polluted. Therefore this water cannot be used without previous physical and chemical treatment. A long and uncontrolled discharge of municipal waste impacts the water quality. The large number of total coliforms and coliforms bacteria in faecal origin, sulfide reducing bacteria and streptococcus bacteria, and high concentration of nutrient salt of nitrogen as ammonia, nitrites and nitrates showed the faecal contamination of the river Sitnica water in some samples is beginning to reach the aquifer. For this reason, we recommend avoiding the discharge of waste water without treatment, mainly from septic tanks, which are extensively used in the area.
Acknowledgements
This report is a part of M.Sc. thesis defended by Muhamet Domuzeti at the University of Prishtina, Kosovo, (supervisor Dr. Fatbardh Gashi). Colleagues from the Department of Chemistry, Biology and Geography, University of Prishtina are thanked for their assistance.
References
1Close, M., Dann, R., Ball, A, Pirie, R., Savill, M. and Smith,
Z., New Zealan. J. Water Health., 2008, 6(1), 83–98.
2Keswick, B. H., Groundwater Pollution Microbiology. New
York: John Wiley and Sons. 1984, 39-64..
3Thompson, T., Fawell, J., Kunikane, S., Jackson, D., Appleyard, S., Callan, P., Bartram, J. and Kingston, P., Chemical safety of drinking-water: Assessing priorities for risk
management, World Health Organization,2007.
4Chirila, E., Bari, T., and Barbes, L., Ovidius Univ. Ann. Chem., 2010, 21, 87-90.
5Hamilton, L. S., 1st Edition, Food and Agriculture
Organization of the United Nation, Rome, 2008, 78.
6Montgomery, J. M., Water Treatment, Principles and Design.
John Wiley & Sons, New York, 1996, 474.
7Brils, J., Ann. Inst. Superiore Sanita. 2008,44, 218–223.
8Gashi, F., Frančišković-Bilinski, S., Bilinski, H., Troni, N., Bacaj, M. and Jusufi, F., Environ. Monit. Assess., 2011, 75, 279–289.
9Gashi, F., Faiku, F., Haziri, A., Hoti, R., Isufi, F., Laha, F., Shala, B., Feka, F., Dreshaj, A., J. Int. Environ. Appl. Sci.,
2012, 2(3), 530-537.
10Gashi, F., Faiku, F., Haziri, A., Hoti, R., Laha, F., Isufi, F., Rexhepi, A., Shala, M. and Hasanaj, A., J. Int. Environ.
Appl. Sci.,2012, 7(2), 373-380.
11Gashi, F., Troni, N., Faiku, F., Laha, F., Haziri, A., Kastrati, I., Beshtica, E. and Behrami, M., Am. J. Environ. Sci., 2013,
9(2), 142-155.
12Šajn, R., Bidovec, M., Andjelov, M., Piric, S. and Gosar, M.,
Geochemical atlas of Ljubljana and surround. Geološki
Zavod Slovenije (Geological Survey of Slovenia),
Ljubljana, 1998, 670,
13Pecsok, R. and Shields, L. Modern Methodes of Chemical
Analysis, John Wiley & Sons. Inc., New York, London,
Sidney.1968.
14Hurd, D. C., Spencer, D. W., American Geophysical Union,
Geophysical Monograph., 1991, 63.
15Skoog, D. A., West, D. M. and Holler, F. J., Fundamentals of
analytical chemistry. College Publishing, Philadelphia,
1992.
16APHA, AWWA and WEF., Standard Method for the
Examination of water and waste water, 20th ed. Am. Pub. Health. Ass. Washington D.C. 1998.
17Alper, B., Abidin, K. and Yuksel, K. B., Water, Air Soil
Pollut., 1998, 149, 93–111.
18Dalmacija, B., Water Quality Control in Towards of Quality
Management, Novi Sad,2000.
19Stat Soft, Inc. STATISTICA (data analysis software system), ver. 6. http://www.statsoft.com. 2001.
20Tukey, J. W., Exploratory data analysis. Addison-Wesley. Reading, 1977.
21Davis, M. and Masten, S., Principles of Environmental
Engineering and Science, The McGraw Hill Company,
New York,2002.
22Environment Protection Agency (EPA), US Environment Protection Agency: Safe drinking water act amendment. 2002.
23Osuinde, M. I. and Eneuzie, R., Nigerian J. Microbiol., 1999,
13, 47-54.