International Journal of Advances in Management and Economics Available online at: www.managementjournal.info
RESEARCH ARTICLE
An Analysis of Factors Leading Gastronomy Students in Brazil to
Attend Food Parks
Hamilton Pozo
1*, Luciana Marchetti da Silva
21Fatec Baixada Santista Rubens Lara, Rua Mario Carpenter, 3, AP.62. Santos/SP- Brazil.
2Centro Universitário Monte Serrat, R. Comendador Martins, 52. Santos/SP- Brazil .
*Corresponding Author : [email protected]
Abstract
This research aims to analyze which factors lead gastronomy students to attend Food Parks. According to data from the last Family Budget Survey (FBS) developed by IBGE, more than 1/4 of the meals in Brazil are consumed outside the home. This scenario stimulated the arrival, of the concept of food truck for Brazil. However, the parking of trucks on public roads is limited by most governmental policies that were created by the food parks-spaces that host various types of food trucks. The exploratory study was designed through quantitative and qualitative methods with semi-structured interviews with data collection, semi-structured interviews with 137 students of the technical course in gastronomy at two colleges. As a result, it was obtained that the variety of foods is what most motivates students to attend the food parks that are considered as an alternative to street of trucks foods
Keywords:culinary students, Food Parks, Food outside the home, Street food, Gastronomy.
Introduction
The commensality (act of sharing the table and eating together) is what distinguishes civilized from uncivilized man, for man does not eat only from starvation or to meet a need of the body, but above all to make this moment sociable [1]. Economic, social and
demographic changes have generated
demands that have forced the diner to rearrange his routine. Currently table fellowship is characterized by a lack of time given to the preparation and consumption of food, the presence of manufactured and imported products, the transfer of home meals to restaurants, coffee shops, street vendors, and bakeries among others, the use of lunch boxes, publicity associated with the food, flexible schedules to eat aggregately a diversity of foods, and by the increasing individualization of food rituals [2].
The inclusion of women in the labor market, greater a distance between home and work and lack of time for the preparation of food has made food outside the home a necessity. The home out of food can be defined as all foods prepared outside the home regardless of where they are consumed or as all food consumed away from home no matter where
they are prepared, including prepared snacks at home for consumption elsewhere [3] and [4]. In Brazil, over the past decade, the sectors linked to food outside the home (food service) grew 292.3%, compared to a 209% rate for traditional food retailing as food outside the home (2013). According to data from the latest household budget survey (POF) developed by IBGE, more than 1/4 of the meals in Brazil are consumed outside the home. In large urban centers, it is 1/3.
This means that the growth potential of this market is promising when compared to the American reality, in which the sector currently accounts for over 60% of the meals. According to the Food Industry Brazilian Association (ABIA), in 2013 more than 33% of the population’s food consumption was outside the home—in 1995, the figure was 19%.
for cheaper meals. "The sector shrinks, but the shrinkage does not reach the quantity of meals or frequency. It occurs in a lower average spending per persons" he said. The move affects mostly restaurants that offer meals over 9 USD, which represents 12% of the sector. On the other hand, it favors establishments with prices lower than 6.50 USD which represents 75% of the sector according to [6]. This scenario stimulated the opening of new establishments and the coming of the concept of food truck to Brazil in order to provide good food at affordable prices.
The food truck or car is a van that sells various types of food, such as bat, kebabs, hamburgers, Chinese food, Mexican food, etc. It arrived in Brazil in 2008 but became popular in São Paulo in 2014 after the mayor Fernando Haddad signed a document that regulates law 15,947-2013 on the marketing of foods in public areas. [7]. However, the rules for the marketing of food on the street remain rigid in most municipalities; this favored the creation of food parks, as places where food trucks park and have an infrastructure such as bathrooms, tables, etc., for the marketing of foods.
With the gastronomy market growing, the search for qualified professionals trained to work in the food and beverage area is growing. A degree in gastronomy integrates the technical skills of preparation and food
and beverage services, taking into account the good food handling practices and conscious use of available resources. The authors had contact with students of the technical course in gastronomy—one is a teacher and another works in the coordination of the course. The realization that they frequent the food parks, produced in both authors an interest in checking which factors lead the gastronomy of students to attend the parks.
The following Hypotheses were
Investigated
The prices of food sold in food parks attract students;
The variety and quality of foods sold in food parks attract students;
The environment of food parks attracts students.
The exploratory and descriptive research was outlined through quantitative and qualitative methods. Semi-structured interviews were conducted with senior students of the Technological course of Gastronomy two private colleges, one located in São Paulo and another in the city of Santos, both in São Paulo. And applied to them a reasoned form in Likert scale.
The theoretical framework was based on the authors presented in Table 1 below
Table 1: Key Authors who referred to the theoretical framework
Key Words References/Authors
Food parks GR – Gestão de Restaurantes (2014)
Food away from home Burns et al. (2002); IBGE (2010); Proença, (2000)
Culinary students Belculfine (2011); Jhun et al. (2009); Miyazaki (2006); Werdini et al. (2014); Street food Bezerra (2008); Cardoso (2009); Draper (1996); Fonseca et al. (2013);
Commensality Amon (2014); Boutaud (2011); Carneiro (2003); Flandrin and Montanari (1998); Franco (2001); Gimenes (2011); Létoublon (2011)
Source: Authors
Theoretical Framework
The growth of the food market outside the home was significant in several countries and peoples according to [8]. Some factors contributing to this growth are: the process of urbanization, population lifestyle changes, demographic and socioeconomic changes, and the inclusion of women in the labor market [9].
Consumers tend to act according to their interests and seek a balance between works,
leisure and consumption. The place remains essential as a concrete reference of social practice, full of symbols that access individual records of the human being, according to the personal experience of each [10].
Thus, the preference for consuming food at home or away is related to the way the individual wants to distribute their time in these activities. Eating out is more expensive and requires mobility but, saves time in preparing food [8].
[...] Contemporary culture has changed so the logic of everyday time depending on the work and productivity that weakened the symbolic reference the table. It was reserved for Sundays or special moments, party or birthday, when family members are together. But, as a rule, no longer the point of family permanent convergence.
Food outside the home is a sector that is responsible for the production and sale of meals away from home. It is presented as divided into two segments: the collective and commercial power supply. The collective power meets a steadier clientele in food and nutrition units (institutional foodservices) in hospital, schools, and businesses, among others. The commercial supply meets a motley clientele including self-service
establishments (self)—these include
restaurants by weight, fast food, à la carte restaurants, bars and coffee [12].
According to [3] set to outside the home power in two ways: all foods prepared outside
the home, regardless of where they are consumed, and all food consumed outside the home, regardless of where they are prepared. The results of the Household Budget Survey (HBS) conducted in 2002/2003 and 2008/2009 show that in six years, the power of participation outside the home in food expenditures in urban areas rose from 26% to 33% and in rural areas from 13% to 17.5%, highlighting the southeast region where the percentage increased from 26.9% to 37.2%. The market collective meals also grew from 7.5 million meals served in 1998 to surpassing 16.5 million in 2011 [13].
According to research conducted by the Federation of Industries in São Paulo (FIESP) and the Brazilian Institute of Geography and Statistics’ [14] custom Brazil food trains project, 27% of meals eaten outside the home occur in restaurants and 19% in fast-food chains.
The table 1 below shows the growth of the collective power over the past nine years.
Table 2: Meals (in Millions of Meals/Day)
Meals/Period 2006 2007 2008 2009 2010 2011 2012 2013 2014 2015
Self-management (managed by the company) 0.30 0.26 0.22 0.18 0.19 0.15 0.11 0.10 0.08 0.09
Collective meals (service provider) 7.00 7.50 8.30 8.50 9.40 10.5 10.90 11.7 12.5 13.4 Meals agreement (tickets/coupons) 4.20 4.60 5.20 5.00 5.30 6.00 6.40 7.00 7.60 8.50 Source: [15]
Table 3 shows the growth of genres per meal in nine years.
Table 3: Food Stuff for Meals (in Million Units/Month)
Types/Period 2006 2007 2008 2009 2010 2011 2012 2013 2014 2015
Basic baskets 3.2 3.4 3.6 3.6 4.0 4.4 4.7 5.2 5.7 6.3
Vouchers/coupons/Tickets to
supermarkets 4.5 5.0 5.5 5.6 6.2 6.8 7.4 7.6 8.0 8.6
Source: [15]
Table 4 shows the growth of dining sales in the last ten years.
Table 4: Revenue (in Billions of USD) According to Meals
Types/Period 2006 2007 2008 2009 2010 2011 2012 2013 2014 2015
Collective meals 2.41 2.67 3.02 3.12 3.44 4.27 4.68 5.29 5.99 6.83
Self-management 0.22 0.22 0.16 0.17 0.19 0.22 0.23 0.23 0.23 0.24
Basic baskets 1.94 2.23 2.45 2.55 2.74 3.12 3.51 3.79 4.55 5.37
Meals agreement 1.27 1.44 1.60 1.61 1.75 1.91 1.95 2.11 2.45 2.91
Power agreement 0.95 1.40 1.65 1.72 1.85 2.07 2.20 2.45 2.81 3.31
Source: [15]
In 2013, 32.9% of the food consumption of the population was carried out away from home; in 1995, the figure was 19%. This growth points to the potential for development of this market. In 2015, the turnover of the sector in
the country was equivalent to one-third of household expenditure on food and in 2015, it was 93.5 billion USD [15].
According [16] food plays an important role in defining identity groups, companies and communities as well as in defining the relationships between people. For [17] food is a way of social knowledge. To eat is to know and produce common knowledge that is constituted as social memory when narrated. According to [18] feeding is vital for human survival, though this practice is not only related to a physiological need, it is inserted in a larger cultural context and can be understood as a cultural practice that can reveal much about the group of that exercise. Due to this, the act of foraging has become the object over time of various knowledge areas such as medicine, nutrition, economics, sociology, anthropology, history and tourism. In this same line of Argument, [19] State the following
The act of eating is not only biological but also social and cultural. It has a symbolic meaning for every society and every culture. It is a cultural differentiation factor, since the identity is communicated by people also through the food that reflects the preferences, dislikes identifications and discrimination. Through food, you can see and feel traditions that are not said. Powerful also is memory, it operates very strongly in the imagination of each person, and is associated with the senses: smell, sight, taste and even hearing. It highlights the differences, similarities, beliefs and social class to which it belongs for carrying the marks of culture.
According to biblical accounts, food has been present since the dawn of humanity, including the establishment of limits or standards. Two important milestones in the human socialization process were the mastery of fire and hunting. By using them, man took a significant step towards distinguish himself from his ancestral hominids and other animals.
Already the human predisposition to share the food, beverages and space-the basic principles of hospitality—originated when man developed the ability to hunt large prey and divide them [20]. According to [21] suggests that there resides the origin of food and hospitality in full. The idea of sharing food is associated with the basic principle of hospitality: the pleasure of meeting the needs of others explained by psychological theories
generates a reward above all emotional and that is part of the human condition.
The modification of raw food to cook was described by [22] as the process of the passage of man's biological condition for the social; but, in the social function of meals, table fellowship was also decisive. [23].
The word commensality derives from the Latin "mensa" and means to live at the table and this covers the dietary pattern, what you eat and, above all, how to eat. Thus, it should not be considered only as a biological phenomenon, but also as a structuring factor of social organization [24].). Through diet we can "understand the social and economic relationships maintained between peoples of different regions; know the history of appetite, habits and tastes of individuals;
preserving tradition and origin of
experiments developed in gastronomy, among others" [25].
[...] The commensality helps organize the rules of identity and social hierarchy—there are societies, for example, where women and children are excluded from the common table-as well as it serves to weave networks of relationships and also serves to impose limits and boundaries, social, political, religious, etc. Over the seasons and regions, different human cultures have always regarded food as a coated act of symbolic content, the meaning of which currently seeks to identify and classify it as "political" or "religious." The meaning of such content is not interpreted by the cultures that practice it, but serve as an unquestioned precept, for which explanations are not necessary [24].
According to [26], table fellowship and sharing the table is a form of hospitality, an expression of civilization and one of the supporting pillars of the contemporary world, understood as a dimension of hospitality. For the author, eating has a symbolic meaning of sharing, exchange and recognition that enriches relationships and strengthens social bonds.
In this Perspective, [1], Highlight the Social Role of Food as a Differentiating Feature between Human Beings and other Animals and Argue
[...] the civilized man and not only (and less) by hunger, to satisfy a basic need of the body, but also (and especially) to turn the occasion into a moment of sociability in an action of strong social content and great power of communication.[1].
Corroborating this view, to [28] the table is a communication space. Currently, this space has become less and less at home; economic, social and demographic changes have generated demands that have forced the diner to rearrange his routine and food outside the home as a necessity. The inclusion of women in the labor market, the difficulty of mobility in urban centers and the lack of time for preparation of food have contributed to this panorama [16].
Today commensality is characterized by a lack of time for preparation and consumption of food, the presence of manufactured goods and imported ones by transferring homes meals for restaurant ones, by using lunch boxes, the publicity associated with the food, and the increasing individualization of food rituals as stated by [29]. Already, [21]
Makes the Following Interpretation of this Moment
The power of the modus operandi has always been related to lifestyles and if we analyze it in contemporary times, we should certainly consider, among other factors, that time for leisure is still time "left over" in the routine: that women have left the traditional housework for paid work outside the home; the significant media interest in the dissemination of a previously restricted knowledge to certain social groups piqued the curiosity for new food experiences. For these and other reasons, more and more people do their meals outside the home, in the search for pleasure or out of necessity.
This scenario favors the street food market, according to ECD consultancy, specializing in food away from home (food service), with estimated revenues 26 billion USD a year in Brazil. This represents 10% of what is moved by the power sector outside the home-bars,
restaurants, coffee shops, bakeries,
convenience stores, etc. [30].
Developing countries favor the growth of the informal labor market, highlighting the segment of street food. The sale of culinary preparations on public roads was inherited from black Africa of the West Coast where the women performed this type of itinerant trade [31].
The term "street food" is used to identify foods sold on public roads ready for immediate or later use. These foods are heterogeneous, and include meals, drinks and snacks prepared with a variety of ingredients and processing techniques [32].
According to [33], street food is the type of food prepared, cooked or finished and sold on the street, whether from fixed retail outlets (markets), furniture (stands), temporary or seasonal (typical markets) and periodic temporary (tents). This concept can be expanded to consider the foods that are not cooked or prepared or finalized in the streets, but appear ready, as “biju”, coconut candy, “queijadinhas”, cotton candy, among others [34].
To the United Nations Food and Agriculture Organization (FAO), street food can be defined as the set of food and beverages ready for consumption, prepared or sold by street vendors, especially in the streets and/or public places. Foods commonly sold on the streets are hot dogs, candy and cookies, popcorn, ice cream, sugar cane juice, cotton candy, corn, pastel, mush, or regional foods, such as “vatapa”. Sellers meet on fixed or mobile tents, cars and even “tablados”; food services are regulated by local governments [35].
Street food is different from meals served in restaurants, especially when it comes to hygiene, food safety, food sources as well as comfort and elegance. However, many individual suppliers that serve food on the streets are recognized for the quality of the product they serve, and many have expanded their business into a franchise [34]. Eating on the street is not a physiological need only, but also an act—social, economic and cultural.
values are passed between generations through the street food-popcorn sold at the school gate to an elaborate Japanese meal in a tent in the Liberdade district, an area of São Paulo concentrates shops and nips of restaurants and other. [34]. From analyzing the concept of street food, it is clear that the food sold in foods parks for food trucks is considered street food because the parks are public places that resemble fairs.
The Arrival of the Food Truck in Brazil and the Creation of Foods Parks
It is estimated that about 2.5 billion people worldwide consume street food daily according to [35]. These figures have attracted the interest of micro entrepreneurs to the food truck segment. According to [36] the food truck is a mobile kitchen on wheels that transports and sells food itinerantly. In the US, this business has been around for a long time and is widely used by the executive audience. The first food truck was established in 1872, in Providence, United States.
The owner, Walter Scott, sold pies and sandwiches to workers who needed cheap and fast food. By the beginning of 2000, food trucks also carried the stigma of having cheap food and low quality. With the economic crisis of 2008 that has changed; many restaurants were forced to close their doors and chefs invested in an old stripped form of making food [37].
In Brazil, the first food trucks appeared in 2008, and in São Paulo, over 300 open requests for authorization of this business model were requested. For this reason, on May 6, 2014, the mayor of São Paulo, Fernando Haddad, signed the decree of Street Food Law—Municipal Law No. 15,947, on December 26, 2013, Municipal Decree No. 55.085, authorizing the sale of street food in the city, subject to certain established rules [37].
Three months after the publication of the decree, the city of São Paulo received over a thousand requests form persons interested in investing in food trucks. Santana, Mooca and Ipiranga were the neighborhoods that received authorization. On the other hand, other neighborhoods like Cidade Ademar, Penha, Itaquera, Sé and Pirituba did not record any interest in the same period. Other Brazilian cities are reviewing their rules and are soon to regulate the trade in food in the
streets. In Santos, for example, food trucks are still prohibited. Estimates suggest that this market should generate around 0.6 billion USD as early as 2015 [38].
The main attraction for micro entrepreneurs is the value of the investment; including the value of the vehicle, the kitchen and assembling of a truck food costs about 8,000 USD-cheaper than opening a restaurant. With investment and reduced costs, they can charge less for meals that on average sell for 6.25 USD [37].
In the Food Truck in the Streets-Location Guide for Food Trucks 64 food trucks are registered as installed in São Paulo. This guide came about through the need for creators to locate the food trucks in the city of São Paulo, where they live; now the guide provides the location of food trucks across the country. Also, when possible, a preference for local foods is seen as the best alternative for better quality than foods that go over long distances; this option provides a significant decrease in costs [23].
Besides the location, the guide tells the specialty served in each trailer, the hours of operation, phone number and e-mail. It can be accessed through their website or through a mobile app. According to the director of the guide, the number of application downloads and hits on the site grow at a rate of 30% per month. In September 2014, 300,000 visits were recorded.
Entrepreneurs who customize vehicles for events show that revenue increased 300% in recent months after the legalization of street food vending on wheels. Formerly they used to have an order every three month and now fit five to six vehicles per month [39].
only one car per legal entity.The solution to this impasse was the food parks, large spaces that serve as parking for several food trucks.
Every day, the food truck drives to one of them through the city [37]. There are several food parks in São Paulo, as shown in Table 4 below.
Table 5: Spaces for the Parking of Food Trucks Wheelz Gastronomia
Urbana
Panela na rua Faria Lima Food
Park
Marechal Food Park PátioGastron
ômico Casa Verde
Ocpa Food Park
Picknick Faria Lima
Monday to Friday, 11:30 am /3 pm
Thursdays 6 pm/10 pm
Monday to Friday 11 am/4 pm
Tuesday to Sunday 11 am / 9 pm
Sunday 11am / 8 pm
Tuesday to Sunday 11am/10 pm
Monday to Sunday
11 am /10 pm Chilon Street, 381 - Vila
Olimpia
Benedito Calixto Square, 85
Street Matias Valadão, s/nº
Albuquerque Lins Street, 505,Snt.Cecilia
Street Relíquia, 383 - Casa Verde.
Av Cons. Rodrigues
Alves, 83
Av. Rebouça
s, 3128
Source: Restaurants, [37]
Food trucks are charged for these spaces to park and offer their products. The amounts range from 400 USD per four hours up to 800 USD for the weekend. On a weekend in September 2016, a food trucks festival in Shopping Iguatemi attracted about 16,000 people. In the Shopping Centre Norte, were 25,000 [39].
Although it is a success, the industry is awakening discussions. Rolando Vanucci, president of Street Food Paulistana Association and owner of six vehicles selling pastas, churros, hot dogs and pizza in portions that cost from 3.50 USD criticises "[...] the concept of cheap street food and the quality of food is being misrepresented. A hamburger sells for 8 USD is exorbitant " [37].
Vanucci also Criticizes the Food PARKS that have been Selling Street Food since 2007; he believes that Many People are entering the Industry now only because it is a Fad. He says
The fad has attracted many people to this business and they lost a handle on prices. A cheeseburger for 8 USD is too expensive. A family of four who decides to eat at a food truck, leaves having spent no less than 38 USD. In this case, it is better to go to a restaurant where there is more comfort, such as toilets and waiters [39].
The president of the Brazilian Association of Bars and Restaurants (ABRASEL), Percival Maricato, says the food trucks are unfair competition for restaurants. According to him, 10% of the turnover of an establishment is spent on the rent, for example. In addition, he notes, as this is a fad, while customer demand is great, the price of the meals tends to be high [39].
Technical Course in Gastronomy
The origin of the word is Greek for cuisine, "gastrostomy", which also means stomach and food. "Autonomy" means the set of rules, laws or regulations. So etymologically it is understood that the term gastronomy refers to the set of rules governing the food; it would be the law of the stomach or simply the knowledge of it [40].
In academia gastronomy is a discipline, and is the knowledge used to understand the rules governing food to enable their service providers to understand the desires and provisions of the diners, the adequacy of what constitutes the enabling environment for food in a social relationship [40].
According to [41], the demand for qualified professionals and concern for the vocational education of gastronomy arose in the late nineteenth century. In 1895 the first school of gastronomy—Le Cordon Bleu—in Paris was founded. At first the school taught French cuisine to the daughters of wealthy families; after fifty years it began to offer higher and
postgraduate courses in business
management in the area. It is currently a
world-renowned network dedicated to
providing culinary and hospitality instruction through world-class programs.
In the United States, in 1946 came the Culinary Institute of America (CIA) offering professional courses and cooking, and which for 12 years has been offering undergraduate courses [41]. In Brazil, until the mid-1960s the cooking courses were sponsored by food industries and taught by culinarians. In the professional environment learning happens on the desktop. Migrants and immigrants without work experience they needed were absorbed by restaurants, beginning as general helpers and gradually with much effort gained higher positions [43].
The first vocational school for cooks in Brazil
was the Senac-National Commercial
Training Service in 1964, the then School Senac Lauro Cardoso de Almeida in Sao Paulo. After six years, cooking courses began to be offered in the town of Aguas de Sao Pedro, Sao Paulo. This course was offered free of charge at boarding school for financially needy students, many of them coming out of FEBEM-State Foundation for the Well-Being of Minors [42].
In 1994, also in the city of Aguas de Sao Pedro, SENAC started the course Chef Cook International (CCI), then a professional training course created in partnership with the Culinary Institute of America (CIA). The faculty consisted of CIA chefs and renowned Brazilian and foreign chefs. Two chefs trained at the CIA were hired to monitor the implementation of the course and to translate the lessons. Unlike the course for cook training, this course was paid and involved an audience of another social class and better educated [42].
The course Chef Cook International (CCI) has become a model for technology courses and was a milestone in the recovery of kitchen professionals. Coming to Brazil, international chefs in the 1990s also strengthened this category [43]. In 1999, according to [42]
The First-Degree Courses in
Gastronomy in Brazil were
February: Tourism Course (BA mode) with specialization in gastronomy at the University of Southern Santa Catarina-Florianópolis/SC;
March: Course of Specific Training in Food (sequential mode) at the Anhembi-Morumbi University-São Paulo/SP;
July: Gastronomy Course (sequential mode and Graduate) at the University of Vale do Itajaí-Itajaí/SC.
The SENAC launched a culinary technology course in 2000 at the Hotel School Aguas de São Pedro [36]. According to the Ministry of Education, there are currently in Brazil 133 top courses in cooking regulations; among
them are the present technological,
technological distance and bachelor’s degrees. In addition to higher education, there are also several short courses for qualifications and improvements, and technicians who offer
technical training and issue official
certificates [44].
The profile of a gastronomy course student has been changing. A few decades ago it was made up of professionals in search of professionalization; currently, most entrants are influenced by reality shows about gastronomy, best sellers, chefs in evidence and by glamorizing the profession by the
media. Students have the common
characteristics of curiosity and interest in
ingredients, restaurants and new
gastronomic trends.
Materials and Methods
As to the objectives, this research is classified as exploratory and descriptive. According to [45] the exploratory surveys aim to provide greater familiarity with the issue in order to make it more explicit or form hypotheses. It can be said to have as its main objective the improvement of ideas or the discovery of intuitions. Planning is therefore quite flexible so that it allows for the consideration of various aspects related to the fact studied.
A descriptive, as the name implies, describes the characteristics of certain populations or phenomena. One of its peculiarities is the use of standardized techniques of data collection, such as questionnaires and systematic observation, e.g. research regarding age, gender, origin, election, etc. [46].
studied, since the situation is known; it simply describes their behavior. The answers found in this type of research tell you how a certain problem occurs.
Quantitative research is direct questioning of people whose behavior you want to know. Pursuant to the request for information from a large group of people about the problem studied by quantitative analysis, conclusions corresponding to the data collected are obtained. The survey collects information from all members of the group studied; there is a census [46]. We also promoted bibliographic research. According to [48], this mode is developed based on material accessible to the general public, such as
books, magazines, electronic networks, among others.
Regarding data collection, semi-structured interviews with 137 senior students of the technical course in gastronomy at two private colleges were held in the municipalities of São Paulo and Santos, and thereto a form with 12 questions based on Likert scale with five categories (DT = disagree strongly; D = disagree; I = indifferent; C = agree; CT = strongly agree) was applied.
Data collection was carried out in January, 2016. Research was attended by all students present on the day of the interview and the interviews. The relationship of the universe and the sample is shown in Table 5 below.
Table 6: Universe Ratio versus the Research Sample
Students %
Universe 160 100
Sample 137 85.6
Source: Research data
The Likert questionnaire questions were formulated from seven categories as shown in
Table 6 below. Table7: Categories of Issues
Categories Questions
Attractive 3, 4, 8, 9, 11, 12, 19, 20
Comfort 6, 13, 14, 16
Hygiene 5
Hospitality 7, 18
Innovation 17
Organisation x Security 1, 10
Quality Food x Price 2, 6, 15
Source.Research data
The 12 Likert survey questions are presented in Figure 1, below.
Figure 1Likert questionnaire
Q 1 The food parks offer quality food at affordable prices.
Q 2 The food parks are fashionable and are frequented by rich people.
Q 3 The food options offered by food parks are the main attraction.
Q 4 The environment of food parks is hospitable and promotes interaction between people who attend them.
Q 5 The food parks provide contact with chefs and people in the food area. Q 6 The relaxed atmosphere is one of the main attractions of the food parks.
Q 7 The food parks are organized and safe.
Q 8 In food parks, you can follow the food preparation.
Q 9 The traditional gourmet preparations followed by food trucks are attractive. Q10 Having to wait and stand to be answered (a), is a favorable point of food parks.
Q11 The food parks are an entertainment option not only a supply.
Q12 Eating at the food parks is like a large picnic; this is attractive.
Source: Research Data
In the Interview Process, too, there were Three Qualitative Questions
P2. The food park is a good alternative for food?
P3. What limits you from attending food parks?
These questions were developed from categories and subcategories created from the Bardin method, as shown in Figure 2, below.
Figure 2: Categories of questions created by the Bardin method Categories
Motivation Alternative Limitation
Variety Yes Price
Sub- Innovation No Localizations
categories Entertainment Don’t know, can be Comfort
Convenience Yes Hygiene
Price No Absence
Source: Research Data
Results and Discussion
Our results reflect the determination of 137 valid responses from 137 questionnaires and interviews, representing a rate of 100%. Statistical analysis was performed using the Statistical Package for the Social Sciences
(SPSS). According to the results presented in Table 7 below, respondents are mostly female (57.7%) belong to the age group of up to 20 years (60.6%), with individual income above 1,570 USD (73%) and residents of São Paulo (71.53%).
Table 8: Distribution of Respondents by Gender, Age, Income and City
Source: Research Data
As shown in Table 8, the interviews revealed
that: most respondents’ (54%) main
motivation to attend the food parks was the variety of foods marketed, 76.6% think the
parks are a good alternative for food, and the main factors that limit the frequency of visits to food parks are the price (29.9%) and their location (48.1%).
Table 9: Distribution of Answers of the Interviews according to the Categories of Bardin Motivation Quan
tity % Alternative to feeding Quan tity % Limitation Quan tity %
Variety of foods 74 54,0 Yes, it is an
alternative 105 76.6 Price 41 29.9
Innovation 32 23.4 It is not an
alternative 0 0 Localisation 66 48.1
Entertainment 17 12.4 I do not know; can be 32 23.4 Comfort 10 7.3
Convenience 7 5.1 Yes Hygiene 5 3.7
Price 7 5.1 No Absence of Parks 15 11,0
Variety of foods 137 100 Total 137 100 Total 137 100
Source: Research Data
The Qualitative Analysis of the Answers Given in the Interviews Complements
the Results in Table 8; here are some:
(P1) Variety of dining options and the opportunity to meet new options, but in the
city where I live, we do not have many such events.
(P1) Variety of food in one place in addition to the new concept of food served on site.
Gender Quantity % Age Quanti
ty % income. USD Individual Quantiti ty % localizations City Quanti ty %
Female 79 57,7 > 20 years 83 60.6 < 320 10 7.3 Bertioga 1 0.73
Male 58 42,3 21 to 30 31 22.6 = 950 26 18.9 Cubatão 1 0.73
31 to 40 14 10.2 > 951 to1,600 28 20.5 Guarujá 2 1.46
41 to 50 7 5.1 >1,601 73 53.3 Praia Grande 1 0.73
50 2 1.5 Santos 29 21.17
São Paulo 98 71.53
S. Vicente 5 3.65
(P2) I think it's a good choice; the power industry is very vast and there is a public for all tastes.
(P2) Yes, because it facilitates the knowledge of the "new" cuisine people who do not have access to it.
(P3) High cost, location, parking, many people and the lack of a place to sit.
The Table 9 shows the general statistics resulting from the launch of the Likert scale questionnaire data in SPSS 21.0.
Table 10: Scale Statistics
Mean Variance Standard deviation No. of items
45.03 18.411 4.291 12
Source: Research Data
The reliability of a measurement refers to the ability of it being consistent. If a measuring instrument always gives the same results (data) when applied to structurally equal targets, we can rely on its meaning and say that the measure is reliable. However, with a greater or lesser degree of certainty, the entire measurement is subject to error. Thus, the reliability of observing the data of this research is an estimate, not a "given".
In the last 50 years, the Cronbach’s α has satisfied the function that psychometricians sought from the early work of Spearman and Brown for a valid measure of internal
consistency; it is a measure of consistency, understood or not, that is used for excellence. In general, a tool or test is classified as having suitable reliability when α is at least 0.70. However, in some research scenarios of the social sciences, an α of 0.60 is considered acceptable as long as the results obtained with this instrument are interpreted with caution and take into account the index of the computing environment [49].
As shown in Table 10, the Cronbach's α of this research was 0.639, which can be accepted as we are within a research setting of the social sciences.
Table 11: Reliability Statistics
Cronbach's alpha Cronbach’s alpha based on standardized items Number of items
0.639 0.646 12
Source: Research Data
In the Table 11 shows the output SPSS-point analysis for the range of item-total statistics for the opinion of students regarding food trucks and food parks. The Cronbach's alpha if the item is deleted is probably the most important in the table; it is the Cronbach’s
alpha reliability coefficient scale for internal consistency if the individual item is removed from the scale. In analyzing the data, only the removal of question 10 would cause the Cronbach's α to increase from 0.639 to 0.666.
Table 12: Item-total Statistics
Questions
Average scale if the item was
deleted
Scale variance if the item was
deleted
Corrected item correlation
Multiple correlation
squared
Cronbach's alpha if the item was deleted
Q1 41.56 15.586 0.293 0.159 0.617
Q2 41.12 15.972 0.347 0.248 0.608
Q3 41.07 16.194 0.245 0.123 0.625
Q4 41.44 15.660 0.367 0.237 0.604
Q5 41.00 16.353 0.336 0.239 0.612
Q6 40.95 16.799 0.221 0.143 0.628
Q7 41.45 15.970 0.304 0.158 0.615
Q8 41.39 16.092 0.289 0.195 0.617
Q9 41.27 15.522 0.370 0.271 0.603
Q10 41.28 17.529 0.023 0.119 0.666
Q11 41.46 15.824 0.218 0.156 0.634
Q12 41.34 14.239 0.444 0.304 0.583
Source: Research Data
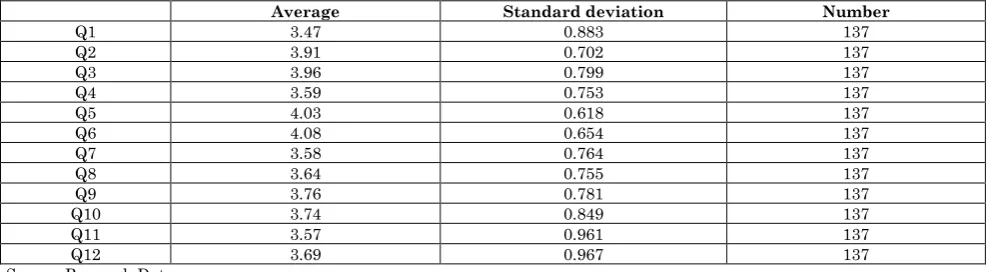
Table 12 provides the mean and standard deviation question by question where question 6 had the highest average (4.08)
Table 13: Items of Statistics
Average Standard deviation Number
Q1 3.47 0.883 137
Q2 3.91 0.702 137
Q3 3.96 0.799 137
Q4 3.59 0.753 137
Q5 4.03 0.618 137
Q6 4.08 0.654 137
Q7 3.58 0.764 137
Q8 3.64 0.755 137
Q9 3.76 0.781 137
Q10 3.74 0.849 137
Q11 3.57 0.961 137
Q12 3.69 0.967 137
Source: Research Data
As shown in Table 13, the interviews revealed that question 1 had highest correlation with issue 11, question two with question 6, question 3 with question 5,
question 4 with question 12, question 7 with question 6, question 8 with question 9 and question 10 with question 12.
Table 14: Matrix of Correlations between Items
Q1 Q2 Q3 Q4 Q5 Q6 Q7 Q8 Q9 Q10 Q11 Q12
Q1 1.00 .197 .076 .234 .150 .126 .186 .197 .068 -.036 .204 .100
Q2 .197 1.00 .125 .113 .125 .256 .177 .010 .109 -.001 .184 .394
Q3 .076 .125 1.00 .183 .270 .090 .059 .112 .127 -.068 .066 .242
Q4 .234 .113 .183 1.00 .310 .202 .144 .155 .219 -.050 .039 .311
Q5 .150 .125 .270 .310 1.00 103 .151 .054 .060 -.098 .294 .224
Q6 .126 .256 .090 .202 .103 1.00 .245 .074 .024 -.082 -.015 .156
Q7 .186 .177 .059 .144 .151 .245 1.00 .233 .210 .002 .040 .141
Q8 .197 .010 .112 .155 .054 .074 .233 1.00 .339 .028 .019 .211
Q9 .068 .109 .127 .219 .060 .024 .210 .339 1.00 .283 .076 .281
Q10 -.036 -.001 -.068 -.050 -.098 -.082 .002 .028 .283 1.00 .071 .020
Q11 .204 .184 .066 .039 .294 -.015 .040 .019 .076 .071 1.00 .142
Q12 .100 .394 .242 .311 .224 .156 .141 .211 .281 .020 .142 1.00
Source: Research Data
Conclusion
The growth of food production and consumption outside the home and changes in commensality certainly were drivers of the advent of the food truck and consequently of food parks in São Paulo, though other factors contributed such as economic fluctuations in 2014 and 2015, the high values of rents, the low investment value for the opening of a food truck, and the decree defining the rules for the sale of street food in São Paulo.
The inability of trucks foods to circulate around town and to park in public places encouraged the creation of food parks and on the other hand, misread the original concept of food trucks and increased the value of foods. Food parks move the power market, opening up hundreds of jobs and new opportunities so that diners can have quality food in places with a great flow of people and food security, as these establishments are checked for sanitary conditions and have a license to operate.
Based on the analysis of the results, hypothesis 1 was not confirmed, considering that only 7% of students considered price a
motivation to attend the food parks, and 29.9% considered it a limitation. Hypotheses 2 and 3 were confirmed since 54% of students responded that the greatest motivation to visit a food park is the variety of foods and 76.6% consider these spaces a good alternative supply of food. To 48.1% the location is a factor limiting the frequency of visits to food parks.
It is noteworthy that to use Likert scales, it is essential to calculate and display the Cronbach's alpha to verify the reliability of the internal consistency of the scales used. Data analysis then should be based on a full scale, and not on individual items; otherwise, the reliability is low or based on assumptions as Cronbach's alpha does not provide reliable estimates for individual items.
managers to adjust the supply of services, thus attracting more people.
There are limitations to this study in what concerns the generalization of the results obtained since the students represent the universe of only two colleges in the state of São Paulo. It is thus recommended to expand the search to other colleges in the state and to other.
A conclusion section must be included and should indicate clearly the advantages, limitations, and possible applications of the paper. Although a conclusion may review the main points of the paper, do not replicate the abstract as the conclusion. A conclusion might elaborate on the importance of the work or suggest applications and extensions.
References
1. Flandrin JL,Montanari M (1998) História da alimentação. São Paulo: Estação Liberdade, P.667.
2. Garcia RWD (2003) Reflexos da globalização na cultura alimentar: considerações sobre as mudanças na alimentação urbana. Verdade e Nutrição. Campinas 16(4):483-492.
3. Burns CJM, Gibbons C, Stoney RM (2005) Foods prepared outside the home: association with selected nutrient and body mass index in adult Australians. Public Health Nutrition. 5(3):442-448.
4. Bazzani C, Canavari M (2017) Is local a matter of food miles or food traditions? Italian Journal of Food Science, 29(705-717.
5. Solmucci P (2015) Associação Brasileira de Bares e Restaurantes. Http://www.abrasel.com.br/. Accessed in 10/12/2015.
6. Maciel C (2004) Faturamento médio do setor de alimentação fora de casa registra queda de
8,39%. EBC. In
http://www.ebc.com.br/noticias/economia/2015/
06/faturamento-medio-do-setor-de-alimentacao-fora-de-casa-registra-queda-de. Accessed in 08/11/2015.
7. SEC-Secretaria Executiva de Comunicação (2014) Decreto de regras para comida de ruas da cidade de São Paulo. In: http://www.capital.p.gov.br/portal/noticia/2218 #ad-image. Accessed in 16/11/2015.
8. Cullen P (1994) Time, Tastes and Technology: The Economic Evolution of Eating out. British Food Journal, 96(10):4-9.
9. Silva MAR (2011) Alimentação Fora do Lar como um fenômeno de consumo pós-moderno: um estudo etnográfico. Tese (Mestrado)- Universidade Federal de Lavras, Lavras. 10. Carvalho AN (2015) Hospitalidade Sob a
Vertente Rural: uma reflexão acerca de sua reconstituição simbólica. Revista Turismo em Análise. 26(2):308-333.
11. Boff L (2008) Comensalidade: refazer a humanidade. América Latina em movimento.
In: <http://alainet.org/active/23567&lang=es>. Accessed in 11/11/2015.
12. Proença RPC (2000) Inovação tecnológica na produção de alimentação coletiva. Florianópolis: Editora Insular.
13. Gorgulho BM (2012) Alimentação fora do lar e sua relação com a qualidade da dieta de moradores do município de São Paulo: Estudo ISA-Capital. Tese de Doutorado. Universidade de São Paulo.
14. IBGE (2010) Pesquisa de Orçamentos Familiares 2008/2009: análise do consumo alimentar pessoal no Brasil. Rio de Janeiro: Instituto Brasileiro de Geografia e Estatística. 15. ABERC (2015) Associação Brasileira das
Empresas de Refeições Coletivas. Mercado real de refeições. São Paulo.
16. Lashley C, Morrison A (2004) Em busca da hospitalidade: perspectivas para um mundo globalizado -SP: Manole.
17. Amon D (2014) Psicologia social da comida.
Petrópolis: Editora Vozes Ltda.
18. Gimenes MHSG (2011) Viagens, sabores e cultura: reflexões sobre pratos típicos no contexto do turismo gastronômico. In: Possamai, A. M. P; Peccini, R. (org). Turismo História e Gastronomia: uma viagem pelos sabores. Caxias do Sul, RS: Educs.
19. Buarque LMS, Barroco HE (2008) A importância da gastronomia como patrimônio cultural, no turismo baiano. Turydes, 1(3). 20. Franco A (2001) De caçador a gourmet: uma
história da gastronomia. São Paulo: Senac. 21. Paula NM (2005) Apresentação à edição
brasileira. In: Sloan, D. Gastronomia, restaurantes e comportamento consumidor.1ed. São Paulo: Manole.
22. Lévi-Straus SC (2004) O cru e o cozido. Mitológicas. V.1. São Paulo: Cosac & Naify.
buffet. Revista Turismo em Análise. 26(3):668-694.
24. Carneiro HS (2005) Comida e sociedade: significados sociais na história da alimentação. Questões & Debates, Curitiba, 42:71-80.
25. Paula NM (2002) Introdução ao Conceito de Hospitalidade em Serviços de Alimentação. In: Dias, C. M.M. (org). Hospitalidade: reflexões e perspectivas. São Paulo: Manole.
26. Boutaud JJ (2011) Comensalidade: compartilhar a mesa. In: Montandon, A. O Livro da Hospitalidade. (1213-1230) São Paulo: Senac.
27. Létoublon F (2011) Grécia arcaica. Os deuses à mesa dos homens. In: Montandon. A. (Dir.). O livro da hospitalidade. Acolhida do estrangeiro na história e nas culturas. São Paulo: Senac São Paulo, 353-372.
28. Dias CM (2002) (org.). Hospitalidade, Reflexões e Perspectivas. São Paulo: Manole.
29. Garcia RWD (20-03).Reflexos da globalização na cultura alimentar: considerações sobre as mudanças na alimentação urbana. Revista de Nutrição. Campinas, out./dez.
30. Madureira D (2015) Comida de rua busca faturar na copa. Valor Econômico. São Paulo. In
<http://www.valor.com.br/empresas/3587288/co mida-de-rua-busca-faturar-na-copa> Acesso em 17/11/2015.
31. Bezerra ACD (2008) (org). Alimentos de rua no Brasil e saúde pública. São Paulo: Annablume, Cuiabá: Fapemat / UFMT. P.223.
32. Draper A (1996) Street foods in developing countries: the potential for micronutrient fortification. London School of Hygiene and Tropical Medicine.
33. Leme M, Campana M (2004).Comida de rua em São Paulo: sua diversidade e seu consumo. São Paulo. SENAC.
34. Fonseca MT, Leme MB, Pregnolato J,Kulcsar J (2013) Comida de Rua na Cidade de São Paulo, SP: Uma Breve Descrição. Rosa dos Ventos, 5(2).
35. Cardoso R, De C V, Santos SMC, Silva EO (2009) Comida de rua e intervenção: estratégias e propostas para o mundo em desenvolvimento. Ciência & Saúde Coletiva, 14(4):1215-1224.
36. Senac-SP (2015) In: <http://www.sp.senac.br/jsp/default.jsp?Newsid =a718.htm&testeira=457> Accessed in: 26/10/2015.
37. GR-Gestão de Restaurantes (2015) A invasão dos food trucks. In: <http://gestaoderestaurantes.com.br/blog/index .php/tag/food-trucks/>. Accessed in 17/11/2015. 38. Araújo R (2015) Como Montar um Food truck:
Lei de Food Truck no Brasil. In: http://orbitale.com.br/lei-de-food-truck-no-brasil. Accessd in 02/11/2015.
39. Neto JS, Crivano R (2015) As polêmicas que envolvem o mercado paulistano de food trucks: preços altos e concorrência com restaurantes tradicionais estão entre as críticas ao novo segmento. o Globo. Rio de Janeiro.
40. Oliveira CR (2013) Hospitalidade: Um local de encontro da gastronomia com a bioética. Encontros Científicos-Tourism & Management Studies, 1:77-86.
41. Werdini MM, Rejowsk M, Stefanini CJ (2014) Formação superior em gastronomia na cidade de São Paulo: expectativas e satisfação de alunos de uma instituição privada. Revista de Cultura e Turismo-CULTUR. 8(1).
42. Miyazaki MH (2006) Ensinando e Aprendendo Gastronomia: Percursos de Formação de Professores. Tese de Doutorado. Dissertação de mestrado: Universidade Metodista de Piracicaba.
43. Jhun S, Neri M, Rodrigues H (2009) Tecnologia em Gastronomia em São Paulo: Docentes Práticos em Atuação na Universidade Anhembi Morumbi. Anais do VI Seminário ANPTUR, 1-12.
44. Rubim RE, Rejowski M (2013) O ensino superior da gastronomia no brasil: análise da regulamentação, da distribuição e do perfil geral de formação (2010-2012). Turismo-Visão e Ação, 15(2):166-184.
45. Selltiz C, Wrightsman L, Cook S, Kidder L (1975) Métodos de pesquisa nas relações sociais. São Paulo: Edusp.
46. Gil AC (2008) Como elaborar projetos de pesquisa. São Paulo: Atlas.
47. Charoux OMG (2006) Metodologia: processo de produção, registro e relato do conhecimento.
São Paulo: DVS.
48. Vergara SC (2009) Projetos e relatórios de pesquisa em Administração. São Paulo: Atlas. 49. Maroco J, Garcia-Marques T (2013) Qual a