ED 433 732 AUTHOR TITLE INSTITUTION REPORT NO PUB DATE NOTE AVAILABLE FROM PUB TYPE EDRS PRICE DESCRIPTORS ABSTRACT DOCUMENT RESUME HE 032 264 Berlin, Linda E.; Bednash, Geraldine D.; Hosier, Katherine L
Enrollment and Graduations in Baccalaureate and Graduate Programs in Nursing, 1998-1999.
American Association of Colleges of Nursing, Washington, DC.; National Organization of Nurse Practitioner Faculties, Washington, DC.
AACN-98-99-1 1999-00-00 70p.
American Association of Colleges of Nursing, One Dupont Circle, NW, Suite 530, Washington, DC 20036-1120. Tel: 202-463-6930; Web site: <http://www.aacn.nche.edu>.
Numerical/Quantitative Data (110) Reports Descriptive
(141)
MF01/PC03 Plus Postage.
Bachelors Degrees; Doctoral Degrees; Educational Attainment; *Enrollment Rate; Enrollment Trends; Graduate Study;
Graduation; Higher Education; Masters Degrees; National Surveys; *Nursing Education; Tables (Data); Trend Analysis; Undergraduate Study
This document presents data on enrollment and graduation rates in U.S. undergraduate and graduate nursing programs in 34 tables. Data are based on a 1998 survey of 531 public and private universities and
four-year colleges. Introductory information includes definitions of terms used in the survey, Carnegie classification definitions, and a description of the survey methodology. Highlights of the data are then identified for the
following areas: (1) fall 1998 enrollment and graduations; two-year
comparisons in enrollment and graduations; (3) five-year trends in enrollment and graduations; (4) nurse practitioner enrollment and graduations; (5)
master's programs; (6) master's enrollment and graduations by major area of
study; (7) two-year comparisons of master's enrollment and graduations by
major area of study; (8) master's nurse practitioner enrollment and
graduations by specialty area; (9) post-base registered nurse (certificate) enrollment and completions by specialty area; (10) post-master's nurse
practitioner enrollment and completions; (11) employment status of graduates; and (12) fall 1998 applicants not accommodated by generic (entry-level)
baccalaureate and master's nurse practitioner programs. Appended are a list of schools with baccalaureate and graduate programs who provided data for the report and a list of entities other than schools of nursing that provided data on nurse practitioners for the report. (DB)
******************************************************************************** Reproductions supplied by EDRS are the best that can be made
from the original document.
AMERICAN ASSOCIATION
OF COLLEGES OF NURSING
OIL
M7N
AND GRADUK:IONS
in Baccalaureate and Graduate
Programs in Nursing
BEST cOPY AVAILABLE
U.S. DEPARTMENT OF EDUCATION
Off ice of Educational Research and Improvement
EDUCATIONAL RESOURCES INFORMATION CENTER (ERIC)
ke'This document has been reproduced as received from the person or organization originating it.
PERMISSION TO REPRODUCE AND DISSEMINATE THIS MATERIAL HAS
BEEN GRANTED BY American Assoc of
VIII
American Association
of Colleges of Nursing
1998-1999
ENROLLMENT AND GRADUATIONS
IN
Baccalaureate and Graduate Programs in Nursing
Linda E. Berlin, DrPH, RNC, Director of Research and Data Services
Geraldine D. Bednash, PhD, RN, FAAN, Executive Director
Katherine L. Hosier, Data Coordinator
AMERICAN ASSOCIATION OF COLLEGES OF NURSING
One Dupont Circle, Suite 530, Washington, DC 20036-1120
(202) 463-6930
Facsimile (202) 785-8320
http: \ \ www.aacn.nche.edu
Please note that all data in this publication pertaining to nurse practitioner educational
programs are the result of a collaborative effort between the
AMERICAN ASSOCIATION OF COLLEGES OF NURSING
and the
NATIONAL ORGANIZATION OF NURSE PRACTITIONER FACULTIES
(NONIP7)
National Organization of
Nurse Practitioner Faculties
(202) 452-1405
http: \ \ www.noripf.com
Special gratitude goes to all individuals who responded to this survey. We are
acutely aware of the effort required for this task. However, their willingness to
complete the survey and to meet our deadlines is critical to produce a timely report.
Consultation on collection and analysis of the nurse practitioner data presented
in this report was provided by the National Organization of Nurse Practitioner
Faculties (NONPF). Special acknowledgement goes to Doreen Harper, PhD, RN, CS,
ANP, FAAN for her efforts. This joint collection and reporting of the nurse
practitioner enrollment and graduation data signifies the collaboration between AACN
and NONPF to produce a single and most complete repository of data on nurse
practitioner educational programs.
Copyright © 1999 by
American. Association of Colleges of Nursing
All rights reserved. No part of this book may be reproduced in print, by photostatic
means, or in any other manner, without the expressed written permission of the
Association.
American Association of Colleges of Nursing is not responsible for errors in reporting
by responding institutions.
Table of Contents
Page
Definition of Terms
viiCarnegie Classification Definitions
xIntroduction
xiSurvey Methodology
xiCharacteristics of Participating Institutions
xiHighlights
1Fall 1998 Enrollment and Graduations
1Two-Year Comparisons in Enrollment and Graduations
1Five-Year Trends in Enrollment and Graduations
2Nurse Practitioner Enrollment and Graduations
2Master's Programs
3Master's Enrollment and Graduations by Major Area of Study
3Two-Year Comparisons of Master's Enrollment and Graduations by Major Area of Study
3Master's Nurse Practitioner Enrollment and Graduations by Specialty Area
3Post-Basic RN (Certificate) Enrollment and Completions by Specialty Area
4Post-Master's Nurse Practitioner Enrollment and Completions
4Employment Status of Graduates
4Fall 1998 Applicants Not Accommodated by Generic (Entry-Level) Baccalaureate and
4List of Tables
Page
Table la. Response Rates for Institutional, Enrollment, and Graduations Surveys 5
for 665 Schools (535 Member and 130 Nonmember)
Table lb. Total Schools in the United States and Its Territories Offering Baccalaureate 5
and/or Graduate Programs in Nursing by Type of Program and Coverage Rates for the Enrollment Database
Table lc. Entities Other Than Schools of Nursing Offering Post-Master's and/or Post-Basic RN (Certificate) Nurse Practitioner Programs and Coverage Rates for the Enrollment Database
5
Table 2. Institutional Characteristics of Member and Nonmember Respondents 6
Table 3. Types of Programs Offered 7
Table 4. Degrees Conferred by Schools Offering Doctoral Programs in Nursing 8
Table 5. Program Changes in Member and Nonmember Respondent Schools 9
Table 6. Fall 1998 Enrollment by Type of Degree and Student Status 10
(N=531 Respondent Schools)
Table 7. Graduations from August 1, 1997 to July 31, 1998 by Type of Degree 11
(N=530 Respondent Schools)
Table 8. 'Enrollment Changes in the Same Schools Reporting in Both 12
1997 and 1998 by Program Type (N=495)
Table 9. Graduation Changes in the Same Schools Reporting in Both 13
1997 and 1998 by Program Type (N=493)
Table 10. Enrollment and Graduation Changes in the Same Schools Reporting 14
in 1997 and 1998 by Program Type and Region
Table 11. Five-Year Generic (Entry-Level) Baccalaureate Enrollment and Graduation 17
Changes in the Same 326 Schools by Region, School Designation, and Student Status
Table 12. Five-Year RN to Baccalaureate Enrollment and Graduation Changes in the 18
Same 362 Schools by Region, School Designation, and Student Status
Table 13. Five-Year Master's Enrollment and Graduation Changes in the 19
Same 259 Schools by Region, School Designation, and Student Status
Table 14. Five-Year Doctoral Enrollment and Graduation Changes in the 20
Same 66 Schools by Region, School Designation, and Student Status
List of Tables, continued
Page
Table 15. Type of Program by Gender of Students Enrolled, Fall 1998 21
Table 16. Type of Program by Gender of Graduates, August 1, 1997 to July 31, 1998 22
Table 17. Type of Program by Race/Ethnicity of Students Enrolled and Number of 23
Non-Resident Alien Students Enrolled, Fall 1998
Table 18. Type of Program by Race/Ethnicity of Graduates and Number of 24
Non-Resident Alien Graduates, August 1, 1997 to July 31, 1998
Table 19. Enrollment in the Same Schools Reporting in 1997 and 1998 by Type of 25
Program and Race/Ethnicity and the Number of Non-Resident Alien Students
Table 20. Graduations in the Same Schools Reporting in 1997 and 1998 by Type of 27
Program and Race/Ethnicity and the Number of Non-Resident Alien Graduates
Table 21. Fall 1998 Enrollment and Graduations from August 1, 1997 to July 31, 1998 29
of Master's-Level Nursing Students by Major Area of Study (N=317 Respondent Schools)
Table 22. Enrollment and Graduation changes of Master's-Level Nursing Students by
Major Area of Study in the Same Schools Reporting in Both 1997 and 1998 (N=306 Schools [Enrollment], N=304 Schools [Graduations])
Table 23a. Fall 1998 Enrollment and Graduations from August 1, 1997 to July 31, 1998
of Master's-Level Nurse Practitioner and Combined Nurse Practitioner/Clinical Nurse Specialists by Specialty Area
30
33
Table 23b. Fall 1998 Enrollment and Completions from August 1, 1997 to July 31, 1998 33
of Post-Basic RN (Certificate) Nurse Practitioner Students by Specialty Area
Table 24. Fall 1998 Enrollment of Post-Master's Nurse Practitioner Students and 34
Post-Master's Completions from August 1, 1997 to July 31, 1998 by Specialty Area
Table 25. Type of Specialty Area by Race/Ethnicity of Master's Level Nurse Practitioner 36
Graduates, August 1, 1997 to July 31, 1998 (N=280 Respondent Schools)
Table 26. Type of Specialty Area by Race/Ethnicity of Post-Basic RN (Certificate) Nurse 37
Practitioner Completions, August 1, 1997 to July 31, 1998 (N=11 Respondent Schools)
Table 27. Type of Specialty Area by Race/Ethnicity of Post-Master's Nurse Practitioner 38
Completions, August 1, 1997 to July 31, 1998 (N=244 Respondent Schools)
List of Tables, continued
Page
Table 29. Approximate Percentage of Graduates with Employment Commitments 40
Upon Graduation by Type of Program(s) and Region
Table 30. Employment Commitment of Graduates Upon Graduation from 41
Doctoral Programs in Nursing (N=362 Graduates)
Table 31. Qualified Applications (not Applicants) Accepted and Enrolled, and Number 42
of Vacant Seats by Type of Program, Fall 1998
Table 32. Reasons for Not Accepting All Qualified Applicants by Type of Program, 43
Fall 1998
Table 33. Reasons for Insufficient Number of Faculty by Type of Program, Fall 1998 44
Table 34. Most Important Reason for Not Accepting All Qualified Applicants by Type 45
of Program, Fall 1998
List of Figures
Figure 1. Fall 1998 Enrollment in Master's-Level, Post-Master's, and Post-Basic 32
RN (Certificate) Programs (N=22,072)
Figure 2. Graduations from Master's-Level, Post-Master's, and Post-Basic RN 32
(Certificate) Nurse Practitioner Programs (N=8,144)
Figure 3. Race/Ethnicity of Master's Graduates; and Post-Master's and Post-Basic 35
RN (Certificate) Completions (N=8,144; Valid N=7,847)
List of Appendices
Appendix A List of Schools with Baccalaureate and Graduate Programs in Nursing That Provided 46
Enrollment and Graduations Data for the 1998-1999 Report
Appendix B List of Entities Other Than Schools of Nursing That Provided Data on Nurse 52
Practitioners for the 1998-1999 Report
Definition of Terms
ACADEMIC HEALTH CENTER:
As defined by the Association of Academic Health Centers, an academic health center is "an institution that includes a school of medicine, a teaching hospital, and at least one additional health education program"in our case, nursing. Each health school generally maintains separate identity and autonomy.
NON-BACCALAUREATE PROGRAMS: LPN (LVN)
A program requiring at least one year of full-time equivalent coursework, the completion of which results in a diploma or certificate of completion and eligibility to apply for licensure as a Licensed Practical/Vocational Nurse.
LPN to Associate Degree in Nursing (ADN)
A program that admits licensed practical nurses and, at completion, awards an associate degree in nursing (e.g., ADN, ASN, AAN, etc.).
RN Diploma
A program requiring two to three years of full-time equivalent coursework, usually within a hospital-based structural unit, the completion of which results in a diploma or certificate of completion and eligibility to apply for licensure as a Registered Nurse.
Associate Degree in Nursing (ADN)
A program requiring at least two academic years of full-time equivalent college academic work, the completion of which results in an associate degree in nursing (e.g., ADN, ASN, AAN, etc.).
BACCALAUREATE PROGRAMS:
Generic (Basic or Entry-Level) Baccalaureate
A program of instruction that admits students with no previous nursing education and requires at least four but not more than five academic years of full-time equivalent college academic work, the completion of which results in a
baccalaureate nursing degree (e.g., BSN, BS, BA, etc.).
Accelerated BSN for nonnursing college graduates
A program that admits students with baccalaureate degrees and with no previous nursing education and, at completion, awards a baccalaureate degree in nursing. "Accelerated" programs accomplish the programmatic objectives in a shorter time frame than the traditional program, usually through a combination of "bridge"/transition courses and core courses. LPN (LVN) to BSN
A program that admits licensed practical nurses and, at completion, awards a baccalaureate degree in nursing (e.g., BSN, BS, BA, etc.).
RN to BSN (RN Baccalaureate; RN Completion)
A program that admits registered nurses with associate degrees or diplomas in nursing and awards a baccalaureate degree in nursing (e.g., BSN, BS, BA, etc.).
Accelerated RN to BSN
A program that admits registered nurses with associate degrees or diplomas in nursing and awards a baccalaureate degree in nursing (e.g., BSN, BS, BA, etc.). "Accelerated" programs accomplish the programmatic objectives in a shorter time frame than the traditional program, usually through a combination of "bridge"/trarisition courses and core courses.
RN to BSN External Degree
A program that admits registered nurses and awards a baccalaureate degree in nursing (e.g., BSN, BS, BA, etc.) by transcript evaluation or academically acceptable cognitive and performance examinations. The entire degree can be earned through examination; however, manostudents combine college coursework and examination.
MASTER'S PROGRAMS:
Master of Science in Nursing (MSN)
A program of instruction that admits students with baccalaureate degrees in nursing (e.g., BSN, BS, BA, etc.) and,at
completion, awards a master of science in nursing. Accelerated BSN to MSN
A program of instruction that admits students with baccalaureate degrees in nursing (e.g., BSN, BS, BA, etc.) and,at
completion, awards a master of science in nursing. "Accelerated" programs accomplish the programmatic objectives ina
shorter time frame than the traditional program, usually through a combination of "bridge"/transition courses and core
courses.
MA in Nursing
A program of instruction that admits students with baccalaureate degrees in nursing (e.g., BSN, BS, BA, etc.) and,at
completion, awards a master of arts in nursing.
MS with a Major in Nursing
A program of instruction that admits students with baccalaureate degrees in nursing (e.g., BSN, BS, BA, etc.) and,at
completion, awards a master of science with a major in nursing.
Master of Nursing (MN)
A program of instruction that admits students with baccalaureate degrees in nursing (e.g., BSN, BS, BA, etc.) and,at
completion, awards a master of nursing.
Master of Education (Nursing) (MEd)
A program of instruction that admits students with baccalaureate degrees in nursing (e.g., BSN, BS, BA, etc.) and,at
completion, awards a master of education in nursing. LPN (LVN) to MSN
A program that admits licensed practical nurses and, at completion, awards a master of science in nursing. RN to MSN or MN
A program that admits registered nurses without a baccalaureate degree in nursing, and, at completion, awards a master's degree in nursing.
MSN for nurses with nonnursing college degrees
A program that admits registered nurses with baccalaureate degrees in fields other than nursing and, at completion, awards a master's degree in nursing.
MSN for nonnursing college graduates (Generic Master's)
A program that admits students with baccalaureate degrees and with no previous nursing education and, at completion, prepares them for entry into the profession and awards a master's degree in nursing. Although these programs generally require a baccalaureate degree, a few of these programs admit students without baccalaureate degrees.
Accelerated MSN for nonnursing college graduates
A program that admits students with baccalaureate degrees and with no previous nursing education and, at completion,
prepares them for entry into the profession and awards a master's degree in nursing. Although these programs generally require a baccalaureate degree, a few of these programs admit students without baccalaureate degrees. "Accelerated" programs accomplish the programmatic objectives in a shorter time frame than the MSN for nonnursing college graduates traditional program, usually through a combination of "bridge"/transition courses and core courses.
Dual Degree Master's Programs (MSN, MS, or MN/MBA, MPH, MPA, MHA, MDiv, or JD)
Programs that admit registered nurses with baccalaureate degrees in nursing (e.g., BSN, BS, BA, etc.) and awarda
master's degree in nursing and a Master of Business Administration, Master of Public Health, Master of Public Administration, Master of Hospital Administration, Master of Divinity, or Juris Doctor.
DOCTORAL PROGRAMS: Doctoral
A program of instruction requiring at least three academic years of full-time equivalent academic work beyond the baccalaureate in nursing, the completion of which results in a doctoral degree in nursing (e.g., PhD, DSN, DNS, DNSc,
or DN).
Doctor of Nursing (ND)
A generic doctoral program with a clinical focus primarily designed for nonnursing baccalaureate-prepared college
graduates.
Dual Degree Doctoral Programs
A program of instruction beyond the baccalaureate in nursing, the completion of which results in a doctoral degree in nursing (e.g., PhD, DSN, DNS, DNSc, DN) and a Master of Business Administration.
OTHER PROGRAMS:
Postdoctoral
A program environment for multidisciplinary research training involving more than one unit of a university, and a recruitment plan that will attract the most highly qualified candidates from throughout the nation. Postdoctoral fellows must hold a doctoral degree in nursing and the nursing unit has the ability to demonstrate that graduates of the program
remain active in research.
Post-Master's Nurse Practitioner
A formal post-graduate program for the preparation of nurse practitioners that admits registered nurses with master's degrees in nursing, and, at completion, awards either a certificate or other evidence of completion, such as a letter from
the program director.
Post-Basic RN (Certificate) Nurse Practitioner
A program for the preparation of nurse practitioners that admits registered nurses without master's degrees in nursing, and, at completion, awards a certificate.
NURSING STUDENTS:
Students who have been formally accepted into the nursing program whether or not they have taken any nursing courses. PRENURSING STUDENTS:
Students who have not been formally accepted into the nursing program. ENROLLMENT:
The number of full- and part-time students enrolled according to the official fall enrollment figures of the institution, including transfers and readmissions and excluding prenursing students. Full- and part-time status is based on institutional
definitions.
GRADUATIONS:
The number of students that met graduation criteria and graduated from August 1, 1997 through July 31, 1998.
CLINICAL NURSE SPECIALIST:
A registered nurse, who, through a graduate degree program in nursing, has developed expertise within a specialty area of nursing practice. In addition to the delivery of direct patient/direct client care, the role may include consultative,
educational, research, and/or administrative components.
NURSE PRACTITIONER:
A registered nurse, who, through a graduate degree program in nursing, functions in an independent health care provider role addressing the full range of patient's/client's health problems and needs within an area of specialization.
Carnegie Classification Definitions
Baccalaureate (Liberal Arts) Colleges I: These institutions are primarily undergraduate colleges with major emphasis on baccalaureate degrees programs. They are selective in admissions and award 40 percent or more of
their baccalaureate degrees in liberal arts fields.
Baccalaureate (Liberal Arts) Colleges II: These institutions are primarily undergraduate colleges with major emphasis on baccalaureate degrees programs. They are less selective in admissions or they award less than 40
percent of their baccalaureate degrees in liberal arts fields.
Doctoral Universities I: In addition to offering a full range of baccalaureate programs, the mission of these institutions includes a commitment to graduate education through the doctorate. They award at least 40 doctoral
degrees annually in five or more academic disciplines.
Doctoral Universities II: In addition to offering a full range of baccalaureate programs, the mission of these institutions includes a commitment to graduate education through the doctorate degree. They award annually at least
10 doctoral degrees-in three or more disciplines-or 20 or more doctoral degrees in one or more disciplines. Master's (Comprehensive) Universities and Colleges I: These institutions offer a full range of
baccalaureate programs and are committed to graduate education through the master's degree. They award 40 or
more master's degrees annually in three or more disciplines.
Master's (Comprehensive) Universities and Colleges H: These institutions offer a full range of baccalaureate programs and are committed to graduate education through the master's degree. They award 20 or
more master's degrees annually in one or more disciplines.
Research Universities I: These institutions offer a full range of baccalaureate programs, are committed to graduate education through the doctorate degree, and give high priority to research. They award 50 or more doctoral degrees each year. In addition, they receive annually at least $40-million or more in federal support.
Research Universities II: These institutions offer a full range of baccalaureate programs, are committed to graduate education through the doctorate degree, and give high priority to research. They award 50 or more doctoral degrees each year. In addition, they receive annually between $15.5-million and $40-million in federal support. Professional Schools and Other Specialized Institutions: These institutions offer degrees ranging from the bachelor's to the doctorate. At least 50 percent of the degrees awarded by these institutions are in a specialized field. Medical schools and medical centers: These institutions award most of their professional degrees in medicine. In
some instances, their programs include other health professional schools, such as dentistry, pharmacy, or nursing.
Other separate health profession schools: Institutions in this category award most of their degrees in such fields as
chiropractic, nursing, pharmacy, or podiatry.
Other specialized institutions: Institutions in this category include graduate centers, maritime academies, military institutes, and institutions that do not fit any other classification category.
Source: The Carnegie Foundation for the Advancement of Teaching, A Classification of Institutions of Higher Education, 1994 Edition, 1994, Princeton University Press, Lawrenceville, New Jersey.
INTRODUCTION
The American Association of Colleges of Nursing (AACN) was established in 1969 to
answer the need for a national organization dedicated exclusively to furthering nursing education
in America's universities and four-year colleges. Representing nursing education programs at
535 public and private universities and four-year colleges, AACN assists deans and directors to
improve and advance nursing education, research, and practice.
The Institutional Data Systems (IDS) and Research Center is the nucleus of the
Association's authoritative national databank. Annually, IDS reports the most current statistics
available on student enrollment, graduations, and faculty and staff salaries.
This is the 18th IDS report on enrollment and graduations, and the first to include
information about nurse practitioner (NP) programs which is the result of joint efforts between
AACN and the National Organization of Nurse Practitioner Faculties (NONPF). The first step in
this collaborative initiative is the joint collection and reporting of data on NP programs,
enrollment, and graduations. This unprecedented cooperative agreement of joint ownership of
NP data is aimed at creating a single source for the authoritative data available on NP programs.
SURVEY METHODOLOGY
The definition of terms used in the questionnaires can be found on page vii. Survey
forms were mailed to 665 baccalaureate and higher degree programs in nursing on September 4,
1998. Responses were received from 531 institutions by December 18, 1998.
To ensure the quality of the data, rigorous data cleaning procedures were applied prior to
data analysis. Each questionnaire was edited for accuracy and completeness upon receipt.
Frequency distributions were obtained on all variables and inspected for outliers. In addition,
multiple internal consistency checks were conducted and key variables were compared to 1997
data in order to detect discrepancies and misclassifications. Institutions were contacted in order
to resolve inconsistencies and discrepancies. If the problems could not be resolved, these data
were excluded from the analysis.
CHARACTERISTICS OF PARTICIPATING INSTITUTIONS
The overall response rates were 80.9 percent for the institutional survey, 79.8 for the
enrollment survey, and 79.7 percent for graduations survey (Table 1). The list of institutions that
provided enrollment and graduation data may be found in Appendices A and B, and Table 2
summarizes the characteristics of these schools.
Questions about the survey in general, or requests for more specific data to meet the
needs of individual institutions through AACN's customized report service, should be directed to
Dr. Linda E. Berlin at (202) 463-6930 x225, or via e-mail to [email protected].
HIGHLIGHTS
Fall 1998 Enrollment and Graduations'
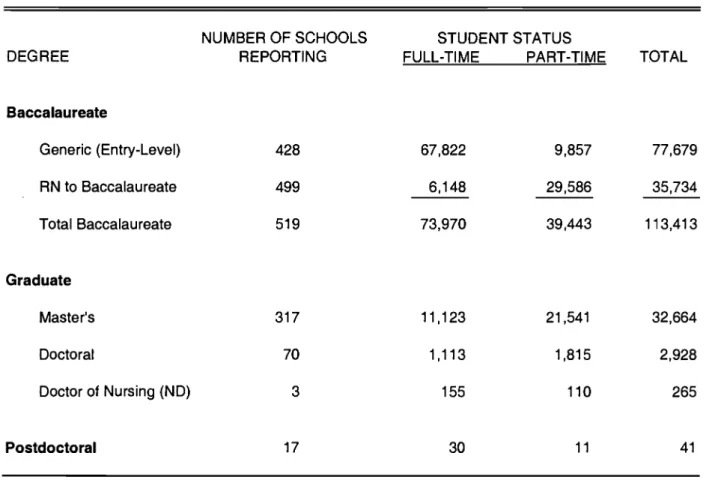
Fall 1998 enrollment and graduations data are summarized in Tables 6 and 7. Students
enrolled in baccalaureate nursing education programs totaled 113,413. The ratio of full-time to
part-time generic (entry-level) baccalaureate students is 6.9:1; the ratio for RN to baccalaureate
students is 0.2:1. On the graduate level, master's and doctoral enrollment totaled 32,664 and
2,928, respectively. Almost sixty-six percent (65.9%) of master's students were enrolled
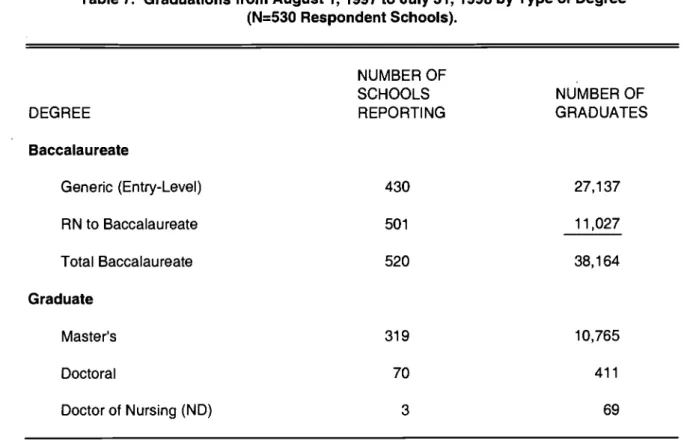
part-time. Baccalaureate degree graduates totaled 38,164 and master's degree graduates totaled
10,765. Doctoral programs graduated 411 individuals.
Two-Year Comparisons in Enrollment and Graduations
Two-year changes in enrollment and graduations are based on data from the same schools
reporting in both 1997 and 1998.
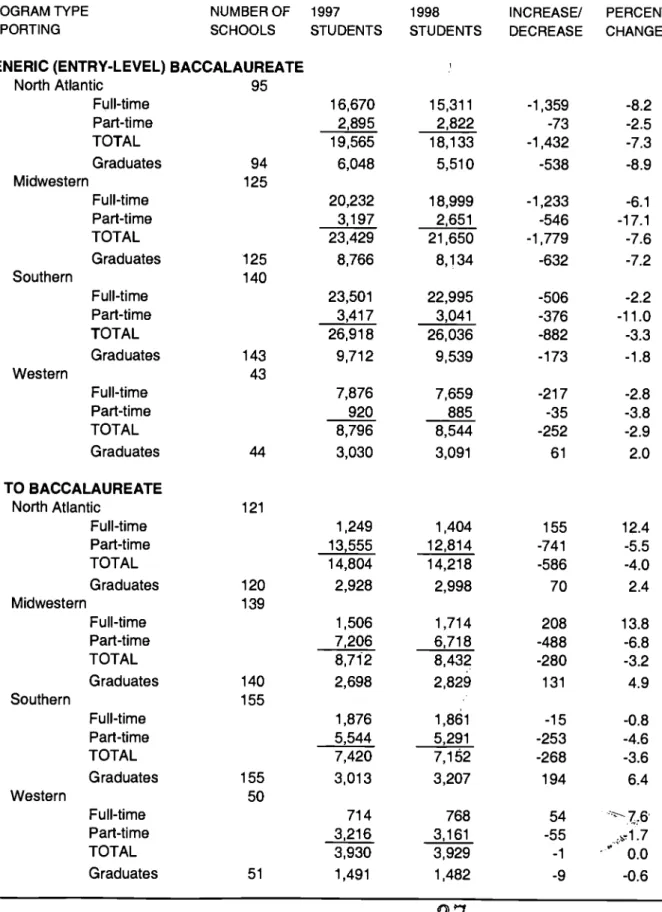
Fall 1998 enrollment of generic (entry-level) nursing students in baccalaureate programs
decreased by 5.5 percent (N=4,345) (Table 8). This decrease was evident regardless of
region (Table 10).
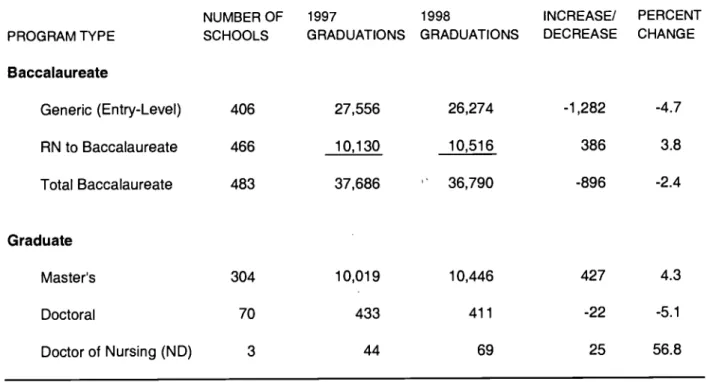
Graduations from generic (entry-level) baccalaureate programs fell by 4.7 percent (N=1,282)
(Table 9).
RN to baccalaureate degree enrollment decreased by 3.3 percent compared to last year, but
graduations increased by 3.8 percent (N=386 individuals) (Tables 8 and 9).
Full-time master's degree enrollees increased slightly by 3.2 percent (336 individuals),
whereas part-time enrollees decreased by 4.7 percent. Overall, total master's degree students
decreased by 2.1 percent (N=680) (Table 8). Master's graduations increased by 427
individuals (4.3 %) (Table 9).
Doctoral enrollment was essentially unchanged (increase of 22 individuals) (Table 8), and
graduations decreased by 5.1 percent (22 individuals) compared to last year (Table 9).
Males constituted 10.5 percent of generic baccalaureate students. The percentage of men
in master's and doctoral programs was 8.0 and 5.5, respectively (Table 15).
Representation from racial or ethnic minority groups, when compared to a matched group of
schools reporting in both 1997 and 1998, showed only slight increases for generic
baccalaureate, master's, and doctoral programs (0.7, 0.9, and 0.6%, respectively).
Five-Year Trends in Enrollment and Graduations
Five-year trends in enrollment and graduations are based on data from the same schools
reporting every year since 1994.
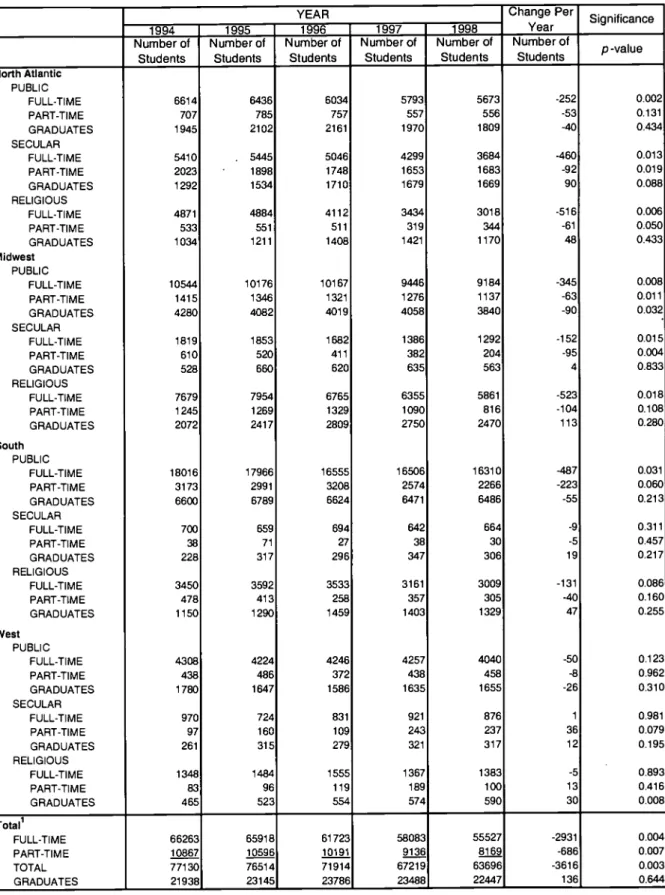
Trend analysis of enrollment in generic (entry-level) baccalaureate programs in the same 326
schools showed steady decreases (average of 3,616 students
per year; p=0.003). Graduates
increased by only 136 individuals per year, but
no trend was evident (p=0.644) (Table 11):
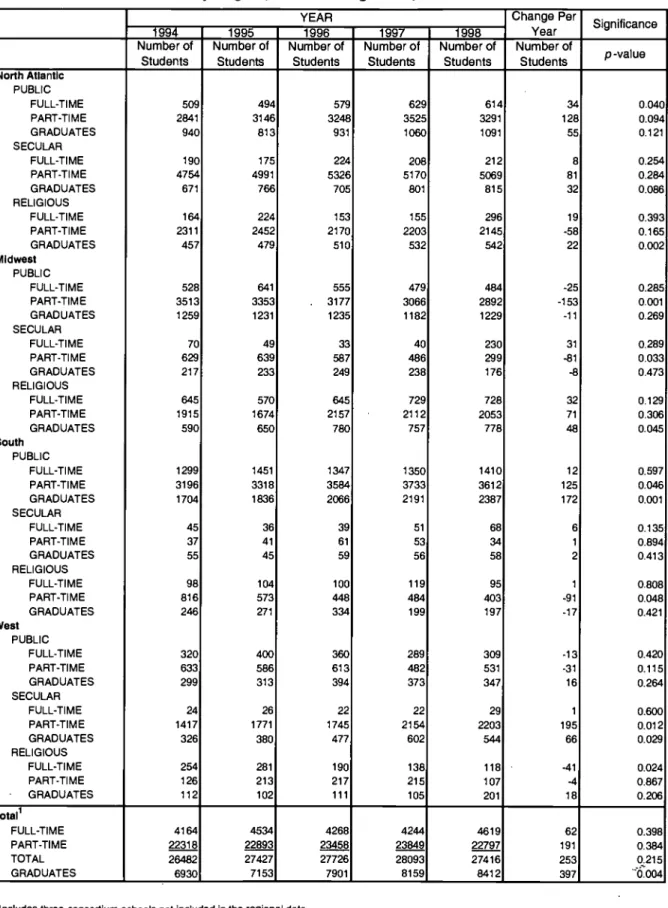
RN to baccalaureate enrollment showed no upward or downward trend and changes in the
average number of enrollees per year were statistically insignificant. However, RN to
baccalaureate graduations showed an upward trend of 397 individuals per year (p=0.004)
(Table 12).
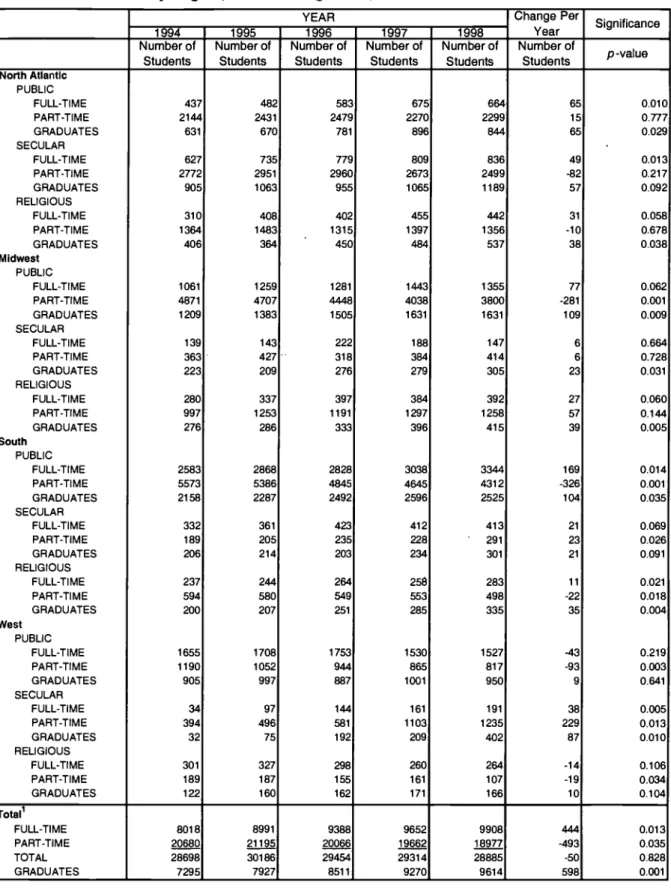
Five-year trends in master's enrollment demonstrated significant increases of
444 students
per year in full-time enrollment (p=0.013) and significant decreases of 493 students per year
in part-time enrollment (p=0.035). Graduates from master's programs have increased
steadily every year, yielding an average increase of 598 individuals annually (p=0.001) (Table
13).
The pattern in doctoral enrollment and graduations continues to be erratic or random, thereby
showing no trend. After considering increases in
some years and decreases in other years, the
number of enrollees increased by 9 per year, whereas graduates increased by 17 per year
(Table 14).
Nurse Practitioner Enrollment and Graduations2
Enrollments in master's-level, post-master's, and post-basic RN (Certificate)
nurse
practitioner (NP) programs totaled 22,072. Master's-level programs accounted for the
majority of enrollees (89%), followed by post-master's (10%), and post-basic RN (1%)
programs (Figure 1).
There were 8,144 NP graduations from August 1, 1997 to July 31, 1998; and master's-level
programs accounted for 80 percent of graduates (Figure 2).
Representation from racial and ethnic minorities accounted for 11.2 percent of NP graduates.
2 Information in this
report pertaining to nurse practitioners is the result of a collaborative effort
between the American Association of Colleges of Nursing and the National Organization of Nurse
Practitioner Faculties. All nurse practitioner data are owned jointly by
the two organizations.
Master's Programs (Table lb)
In fall 1998, there were 665 institutions with baccalaureate and/or graduate programs in
nursing in the United States and its territories. Nationwide, 358 (53.8%) institutions offered
master's programs; of these, 312 (87.1%) offered master's-level NP and/or post-master's NP
programs. The AACN database contains information on 317 (88.5%) institutions with
master's programs and 279 (89.4%) schools with master's-level NP and/or post-master's NP
programs.
Master's Enrollment and Graduations by Major Area of Study (Table 21)
NP majors accounted for 56.1 percent (N=18,312) of master's enrollees, and 57.5 percent of
master's graduates were NP majors. In addition, there were 1,530 enrollees in master's
programs where the NP and Clinical Nurse Specialist (CNS) roles were merged in the
curriculum. The 353 graduates from these programs are eligible to sit for both NP and CNS
certification examinations.
CNS, administration, and education majors comprised 10.8, 6.2, and 3.8 percent of master's
enrollees, respectively. CNSs accounted for 13.6 percent of master's graduates, followed by
administration (6.6%) and nurse-midwifery (3.7%) majors.
Two-Year Comparisons of Master's Enrollment and Graduations by Major Area of Study
(Table 22)
Two-year changes in master's enrollment and graduations are based on data from the same
schools reporting in both 1997 and 1998.
Fall 1998 enrollment in master's NP programs showed only a slight increase (1.0%), whereas
graduations were up by 15.8% compared to last year.
Enrollment and graduations in CNS programs fell by 19.4 and 11.7 percent, respectively.
Likewise, enrollment in nursing education programs decreased by 6.5 percent and graduates
declined by 27.5 percent.
Case management, health policy/management, and informatics majors also showed increases
in both enrollment and graduations compared to 1997.
Master's Nurse Practitioner Enrollment (89% of all NP enrollees) and Graduations by
Specialty Area (Table 23a)
Like previous years, family, adult, and pediatric NP majors accounted for the largest
percentages of the 19,607 NP and combined NP/CNS enrollees; 52.0, 17.8, and 8.9 percent,
respectively. Not surprisingly, these three specialty areas also comprised the largest
Post-Basic RN (Certificate) Enrollment (1% of all NP enrollees) and Completions by
Specialty Area (Table 23b)
Women's health accounted for the largest number of post-basic RN (Certificate) enrollees
(N=121, 52.2%), followed by family NP majors (N=110, 47.4%). However, family NP
majors accounted for more graduates (N=98, 59.8%) than did women's health majors (N=66,
40.2%).
Post-Master's Nurse Practitioner Enrollment (10% of all NP enrollees) and Completions
(Table 24)
Of the 2,233 post-master's NP students, 48.9 percent (N=1,091)
were enrolled in family NP
programs, followed by adult (22.5%; N=503) and pediatric programs (7.1%; N=156). The
proportions for completions were similar.
Employment Status of Graduates (Table 29)
Nationwide, the approximate mean percentage of generic baccalaureate graduates with
employment commitments upon graduation was 76.8 percent (median=85.0%), while
anaverage of 93.5 percent (median=100%) of master's graduates had employment
commitments. For the respondents with master's and/or post-master's nurse practitioner
programs, the mean and median percentage employed was 82.3 percent and 90.0 percent,
respectively. By region, schools in the North Atlantic reported the lowest percentage (52.8%)
and schools in the South reported the highest percentage (71.9%) of employment
commitments for three-quarters or more of their generic baccalaureate graduates. Western
schools reported the lowest percentage (65.4%) and Midwestern programs reported the
highest percentage (76.6%) of employment for three-quarters or more of master's and/or
post-master's NP graduates.
Fall 1998 Applicants Not Accommodated by Generic (Entry-Level) Baccalaureate and
Master's Nurse Practitioner Programs
Of the 107 schools that reported reasons for not accepting all qualified applicants
to generic
baccalaureate nursing programs, 66.4 percent cited that all admission seats
were filled,
followed by insufficient numbers of faculty (37.4%), a shortage of clinical training sites
(26.2%), and/or insufficient classroom space (13.1%) (Table 32). Forty-one institutions with
master's-level NP programs named lack of seats as the primary reason for not accepting all
applicants (63.4%), followed by insufficient numbers of clinical sites (53.7%); and
anTable 1 a. Response Rates for Institutional, Enrollment, and Graduations Surveys for 665 Schools (535 Member and 130 Nonmember).
SURVEY
INSTITUTIONAL ENROLLMENT GRADUATIONS
SCHOOL NUMBER (%) NUMBER ( %) NUMBER (%)
Member 458 (85.6) 454 (84.9) 453 (84.7) Nonmember 80 (61.5) 77 (59.2) 77 (59.2)
Total 538 (80.9) 531 (79.8) 530 (79.7)
Table 1 b. Total Schools in the United States and its Territories Offering Baccalaureate and/or Graduate Programs in Nursing by Type of Program and Coverage Rates
for the Enrollment Database.
NUMBER OF DATABASE
TYPE OF PROGRAM SCHOOLS NUMBER ( %)
Generic (Entry-Level) Baccalaureate 520 428 (82.3) RN to Baccalaureate 613 499 (81.4) Total Baccalaureate 654 519 (79.4) Master's 358 317 (88.5) Master's-Level NP and/or Post-Master's NP Programs 312 279 (89.4) Total Schools 665 531 (79.8)
Table 1 c. Entities Other Than Schools of Nursing Offering Post-Master's and/or Post-Basic RN (Certificate) Nurse Practitioner Programs and Coverage Rates for the Enrollment Database.
NUMBER OF DATABASE
TYPE OF PROGRAM SCHOOLS NUMBER ( %)
Post-Master's NP 8 8 (100.0)
Post-Basic RN (Certificate) 11 11 (100.0)
Table 2. Institutional Characteristics of Member and Nonmember Respondents. CHARACTERISTIC MEMBER (N=458) NUMBER (%) NONMEMBER (N=80) NUMBER ( %) TOTAL (N=538) NUMBER ( %) Type of Institution Public 236 (51.5) 37 (46.2) 273 (50.7) Private Secular 77 (16.8) 11 (13.8) 88 (16.4) Private Religious 140 (30.6) 32 (40.0) 172 (32.0) Consortium 5 (1.1) 0 5 (0.9) Parent Institution University 318 (69.4) 41 (51.2) 359 (66.8) Four-Year College 136 (29.7) 38 (47.5) 174 (32.3) Other 4 (0.9) 1 (1.3) 5 (0.9) Description of Program Department/Division 219 (47.8) 67 (83.7) 286 (53.1) Autonomous 221 (48.2) 10 (12.5) 231 (42.8) Freestanding 14 (3.1) 1 (1.3) 15 (2.7) Other 4 (0.9) 2 (2.5) 6 (1.4)
Part of Academic Health Center
Yes 85 (18.6) 0 85 (15.8) No 373 (81.4) 80 (100.0) 453 (84.2) Carnegie Classification Masters I 175 (38.2) 36 (45.0) 211 (39.2) Master's II 36 (7.9) 6 (7.5) 42 (7.8) Doctoral I 22 (4.8) 0 22 (4.1) Doctoral II 31 (6.8) 0 31 (5.7) Baccalaureate I 8 (1.7) 2 (2.5) 10 (1.9) Baccalaureate II 70 (15.3) 30 (37.5) 100 (18.6) Research I 49 (10.7) 0 49 (9.1) Research II 19 (4.1) 0 19 (3.5) Specialized: Medical Schools/ 24 (5.2) 0 24 (4.5) Medical Centers
Other Health Professions 17 (3.7) 0 17 (3.2)
Schools
Other 3 (0.7) 2 (2.5) 5 (0.9)
Table 3. Types of Programs Offered. PROGRAM NON-BACCALAUREATE MEMBER (N=456) NUMBER (%) NONMEMBER (N=79) NUMBER (%) TOTAL (N=535) NUMBER (%)
Licensed Practical Nursing 3 (0.7) 2 (2.5) 5 (0.9)
LPN to Associate Degree in Nursing 28 (6.1) 9 (11.4) 37 (6.9)
Associate Degree in Nursing 53 (11.6) 23 (29.1) 76 (14.2)
BACCALAUREATE
Generic (Entry-Level) Baccalaureate 387 (84.9) 42 (53.2) 429 (80.2)
Accelerated BSN for nonnursing
college graduates 69 (15.1) 0 69 (12.9) LPN to BSN 77 (16.9) 12 (15.2) 89 (16.6) RN to BSN 382 (83.8) 66 (83.5) 448 (83.7) Accelerated RN to BSN 108 (23.7) 15 (19.0) 123 (23.0) RN to BSN External Degree 3 (0.7) 1 (1.3) 4 (0.7) MASTER'S
Master of Science in Nursing (MSN) 217 (47.6) 7 (8.9) 224 (41.9)
Accelerated BSN to MSN 31 (6.8) 0 31 (5.8)
MA in Nursing 6 (1.3) 0 6 (1.1)
Master of Education (Nursing) (MEd) 1 (0.2) 0 1 (0.2)
MS with a Major in Nursing 92 (20.2) 2 (2.5) 94 (17.6)
Master of Nursing (MN) 7 (1.5) 0 7 (1.3)
RN to MSN, MN, or MS 95 (20.8) 1 (1.3) 96 (17.9)
MSN for nurses with nonnursing
college degrees 53 (11.6) 1 (1.3) 54 (10.1)
MSN for nonnursing college
graduates (Generic Master's) 12 (2.6) 0 12 (2.2)
Accelerated Generic Master's 5 (1.1) 0 5 (0.9)
MSN, MS, or MN/MBA 47 (10.3) 0 47 (8.8) MSN, MS, or MN/MPH 17 (3.7) 0 17 (3.2) MSN, MS, or MN/MPA 6 (1.3) 0 6 (1.1) MSN, MS, or MN/MHA 7 (1.5) 0 7 (1.3) MSN, MS, or MN/MDiv 2 (0.4) 0 2 (0.4) MSN/JD 2 (0.4) 0 2 (0.4) Other 6 (1.3) 0 6 (1.1) DOCTORAL Doctoral' 70 (15.4) 0 70 (13.1) Doctor of Nursing (ND) 3 (0.7) 0 3 (0.6) PhD/MBA 3 (0.7) 0 3 (0.6) BSN to PhD 1 (0.2) 0 1 (0.2) POSTDOCTORAL 17 (3.7) 0 17 (3.2)
'Five institutions have collaborative, cooperative, or joint programs with other institutions. These programs are counted as one program.
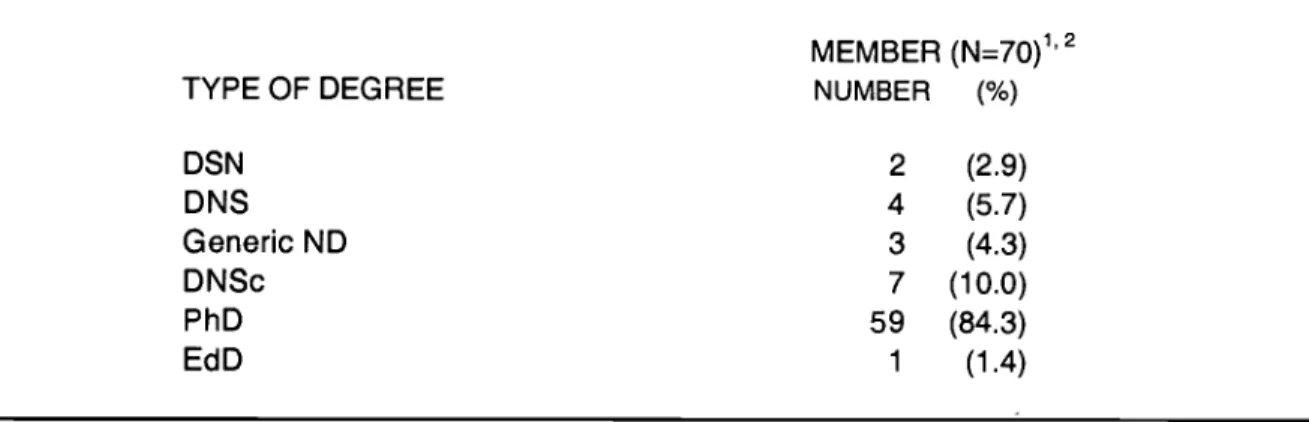
Table 4. Degrees Conferred by Schools Offering Doctoral Programs in Nursing. TYPE OF DEGREE MEMBER (N=70)1'2 NUMBER (%) DSN 2 (2.9) DNS 4 (5.7) Generic ND 3 (4.3) DNSc 7 (10.0) PhD 59 (84.3) EdD 1 (1.4)
Six schools award two types of doctoral degrees.
2
Collaborative, cooperative, or joint doctoral programs are counted as one program.
Table 5. Program Changes in Member and Nonmember Respondent Schools.
PROGRAM CHANGES MEMBER NONMEMBER TOTAL
Programs Planned: N=122 N=16 N=138
LPN to Associate Degree in Nursing 1 1 2
Generic (Entry-Level) Baccalaureate 5 2 7
Accelerated BSN for nonnursing
college graduates 4 0 4
LPN to BSN 9 0 9
RN to BSN 2 0 2
Accelerated RN to BSN 7 1 8
RN to BSN External Degree 1 0 1
Master of Science in Nursing 17 7 24
Accelerated BSN to MSN 7 0 7
MA in Nursing 0 1 1
MS with a Major in Nursing 6 1 7
Master of Nursing (MN) 1 1 2
RN to MSN or MN 21 1 22
MSN for nurses with nonnursing college degrees 4 0 4
MSN for nonnursing college
graduates (Generic Master's) 3 0 3
Accelerated Generic Master's 2 0 2
MSN, MS, or MN/MBA 7 1 8 MSN, MS, or MN/MHA 2 0 2 MSN, MS, or MN/MPH 2 0 2 MSN/JD 1 0 1 Doctoral 16 0 16 MSN to PhD 1 0 1 PhD/MBA 1 0 1 Postdoctoral 1 0 1 Doctor of Nursing (ND) 1 0 1
Programs Planning Closure: N=20 N=2 N=22
LPN to Associate Degree in Nursing 2 0 2
Associate Degree in Nursing 7 2 9
RN to BSN (RN to Baccalaureate; RN Completion) 6 0 6
Master of Science in Nursing 2 0 2
MS with a Major in Nursing 1 0 1
Master of Nursing (MN) 1 0 1
Doctoral 1 0 1
Program Closures Since Fall 1997: N=6 N=0 N=6
LPN to Associate Degree in Nursing 1 0 1
Associate Degree in Nursing 2 0 2
Generic (Basic) Baccalaureate 2 0 2
Table 6. Fall 1998 Enrollment by Type of Degree and Student Status (N=531 Respondent Schools).
NUMBER OF SCHOOLS STUDENT STATUS
DEGREE REPORTING FULL-TIME PART-TIME TOTAL
Baccalaureate Generic (Entry-Level) 428 67,822 9,857 77,679 RN to Baccalaureate 499 6,148 29,586 35,734 Total Baccalaureate 519 73,970 39,443 113,413 Graduate Master's 317 11,123 21,541 32,664 Doctoral 70 1,113 1,815 2,928 Doctor of Nursing (ND) 3 155 110 265 Postdoctoral 17 30 11 41
23
Table 7. Graduations from August 1, 1997 to July 31, 1998 by Type of Degree (N=530 Respondent Schools). DEGREE Baccalaureate NUMBER OF SCHOOLS REPORTING NUMBER OF GRADUATES Generic (Entry-Level) 430 27,137 RN to Baccalaureate 501 11,027 Total Baccalaureate 520 38,164 Graduate Master's 319 10,765 Doctoral 70 411 Doctor of Nursing (ND) 3 69
Table 8. Enrollment Changes in the Same Schools Reporting in Both 1997 and 1998 by Program Type (N=495).
PROGRAM TYPE BACCALAUREATE Generic (Entry-Level) NUMBER OF SCHOOLS 403 1997 STUDENTS 1998 STUDENTS INCREASE/ DECREASE PERCENT CHANGE Full-time 68,279 64,964 -3,315 -4.9 Part-time 10,429 9,399 -1,030 -9.9 SUBTOTAL 78,708 74,363 -4,345 -5.5 RN to Baccalaureate 465 Full-time 5,345 5,747 402 7.5 Part-time 29,521 27,984 -1,537 -5.2 SUBTOTAL 34,866 33,731 -1,135 -3.3 Total Baccalaureate 483 Full-time 73,624 70,711 -2,913 -4.0 Part-time 39,950 37,383 -2,567 -6.4 TOTAL 113,574 108,094 -5,480 -4.8 GRADUATE Master's 306 Full-time 10,551 10,887 336 3.2 Part-time 21,849 20,833 -1,016 -4.7 TOTAL 32,400 31,720 -680 -2.1 Doctoral 70 Full-time 1,120 1,113 -7 -0.6 Part-time 1,786 1,815 29 1.6 TOTAL 2,906 2,928 22 0.8 Doctor of Nursing (ND) 3 Full-time 214 155 -59 -27.6 Part-time 123 110 -13 -10.6 TOTAL 337 265 -72 -21.4 POSTDOCTORAL 16 Full-time 29 28 -1 -3.4 Part-time 10 9 -1 -10.0 TOTAL 39 37 -2 -5.1
a5
Table 9. Graduation Changes in the Same Schools Reporting in Both 1997 and 1998 by Program Type (N=493).1
PROGRAM TYPE Baccalaureate NUMBER OF SCHOOLS 1997 GRADUATIONS 1998 GRADUATIONS INCREASE/ DECREASE PERCENT CHANGE Generic (Entry-Level) 406 27,556 26,274 -1,282 -4.7 RN to Baccalaureate 466 10,130 10,516 386 3.8 Total Baccalaureate 483 37,686 36,790 -896 -2.4 Graduate Master's 304 10,019 10,446 427 4.3 Doctoral 70 433 411 -22 -5.1 Doctor of Nursing (ND) 3 44 69 25 56.8
1 The 1997 graduations were from August 1, 1996 to July 31,1997. The 1998 graduations were from August 1, 1997 to July 31, 1998.
Table 10. Enrollment and Graduation Changes in the Same Schools Reporting in 1997 and 1998 by Program Type and Region.
PROGRAM TYPE NUMBER OF
REPORTING SCHOOLS
GENERIC (ENTRY-LEVEL) BACCALAUREATE
North Atlantic 95 1997 STUDENTS 1998 STUDENTS INCREASE/ DECREASE PERCENT CHANGE Full-time 16,670 15,311 -1,359 -8.2 Part-time 2,895 2,822 -73 -2.5 TOTAL 19,565 18,133 -1,432 -7.3 Graduates 94 6,048 5,510 -538 -8.9 Midwestern 125 Full-time 20,232 18,999 -1,233 -6.1 Part-time 3,197 2,651 -546 -17.1 TOTAL 23,429 21,650 -1,779 -7.6 Graduates 125 8,766 8,134 -632 -7.2 Southern 140 Full-time 23,501 22,995 -506 -2.2 Part-time 3,417 3,041 -376 -11.0 TOTAL 26,918 26,036 -882 -3.3 Graduates 143 9,712 9,539 -173 -1.8 Western 43 Full-time 7,876 7,659 -217 -2.8 Part-time 920 885 -35 -3.8 TOTAL 8,796 8,544 -252 -2.9 Graduates 44 3,030 3,091 61 2.0 RN TO BACCALAUREATE North Atlantic 121 Full-time 1,249 1,404 155 12.4 Part-time 13,555 12,814 -741 -5.5 TOTAL 14,804 14,218 -586 -4.0 Graduates 120 2,928 2,998 70 2.4 Midwestern 139 Full-time 1,506 1,714 208 13.8 Part-time 7,206 6,718 -488 -6.8 TOTAL 8,712 8,432 -280 -3.2 Graduates 140 2,698 2,829 131 4.9 Southern 155 Full-time 1,876 1,861 -15 -0.8 Part-time 5,544 5,291 -253 -4.6 TOTAL 7,420 7,152 -268 -3.6 Graduates 155 3,013 3,207 194 6.4 Western 50 Full-time 714 768 54 7.6 Part-time 3,216 3,161 -55 r1.7 TOTAL 3,930 3,929 -1 0.0 Graduates 51 1,491 1,482 -9 -0.6
Table 10, continued. Enrollment and Graduation Changes in the Same Schools Reporting in 1997 and 1998 by Program Type and Region.
PROGRAM TYPE REPORTING TOTAL BACCALAUREATE North Atlantic NUMBER OF SCHOOLS 124 1997 STUDENTS 1998 STUDENTS INCREASE/ DECREASE PERCENT CHANGE Full-time 17,919 16,715 -1,204 -6.7 Part-time 16,450 15,636 -814 -4.9 TOTAL 34,369 32,351 -2,018 -5.9 Graduates 122 8,976 8,508 -468 -5.2 Midwestern 146 Full-time 21,738 20,713 -1,025 -4.7 Part-time 10,403 9,369 -1,034 -9.9 TOTAL 32,141 30,082 -2,059 -6.4 Graduates 146 11,464 10,963 -501 -4.4 Southern 162 Full-time 25,377 24,856 -521 -2.1 Part-time 8,961 8,332 -629 -7.0 TOTAL 34,338 33,188 -1,150 -3.3 Graduates 163 12,725 12,746 21 0.2 Western 51 Full-time 8,590 8,427 -163 -1.9 Part-time 4,136 4,046 -90 -2.2 TOTAL 12,726 12,473 -253 -2.0 Graduates 52 4,521 4,573 52 1.2
Table 10; continued. Enrollment and Graduation Changes in the Same Schools Reporting in 1997 and 1998 by Program Type and Region.
PROGRAM TYPE REPORTING MASTER'S North Atlantic NUMBER OF SCHOOLS 92 1997 STUDENTS 1998 STUDENTS INCREASE/ DECREASE PERCENT CHANGE Full-time 2,375 2,344 -31 -1.3 Part-time 7,350 6,891 -459 -6.2 TOTAL 9,725 9,235 -490 -5.0 Graduates 90 2,741 2,988 247 9.0 Midwestern 81 Full-time 2,129 2,071 -58 -2.7 Part-time 6,327 6,035 -292 -4.6 TOTAL 8,456 8,106 -350 -4.1 Graduates 81 2,475 2,479 4 0.2 Southern 95 Full-time 3,972 4,352 380 9.6 Part-time 5,903 5,562 -341 -5.8 TOTAL 9,875 9,914 39 0.4 Graduates 94 3,345 3,361 16 0.5 Western 38 Full-time 2,075 2,120 45 2.2 Part-time 2,269 2,345 76 3.3 TOTAL 4,344 4,465 121 2.8 Graduates 39 1,458 1,618 160 11.0 DOCTORAL North Atlantic 18 Full-time 250 245 -5 -2.0 Part-time 497 506 9 1.8 TOTAL 747 751 4 0.5 Graduates 18 68 91 23 33.8 Midwestern 17 Full-time 297 273 -24 -8.1 Part-time 589 562 -27 -4.6 TOTAL 886 835 -51 -5.8 Graduates 17 123 130 7 5.7 Southern 26 Full-time 297 303 6 2.0 Part-time 584 606 22 3.8 TOTAL 881 909 28 3.2 Graduates 26 153 138 -15 -9.8 Western 9 Full-time 276 292 16 5.8 Part-time 116 141 25 21.6 TOTAL 392 433 41 10.5 Graduates 9 89 52 -37 -41.6
Table 11. Five-Year Generic (Entry-Level) Baccalaureate Enrollment and Graduation Changes in the Same 326 Schools by Region, School Designation, and Student Status.
YEAR Change Per
Year Significance 1994 1995 1996 1997 1998 Number of Students Number of Students Number of Students Number of Students Number of Students Number of Students p-value North Atlantic PUBLIC FULL-TIME 6614 6436 6034 5793 5673 -252 0.002 PART-TIME 707 785 757 557 556 -53 0.131 GRADUATES 1945 2102 2161 1970 1809 -40 0.434 SECULAR FULL-TIME 5410 . 5445 5046 4299 3684 -460 0.013 PART-TIME 2023 1898 1748 1653 1683 -92 0.019 GRADUATES 1292 1534 1710 1679 1669 90 0.088 RELIGIOUS FULL-TIME 4871 4884 4112 3434 3018 -516 0.006 PART-TIME 533 551 511 319 344 -61 0.050 GRADUATES 1034 1211 1408 1421 1170 48 0.433 Midwest PUBLIC FULL-TIME 10544 10176 10167 9446 9184 -345 0.008 PART-TIME 1415 1346 1321 1276 1137 -63 0.011 GRADUATES 4280 4082 4019 4058 3840 -90 0.032 SECULAR FULL-TIME 1819 1853 1682 1386 1292 -152 0.015 PART-TIME 610 520 411 382 204 -95 0.004 GRADUATES 528 660 620 635 563 4 0.833 RELIGIOUS FULL-TIME 7679 7954 6765 6355 5861 -523 0.018 PART-TIME 1245 1269 1329 1090 816 -104 0.108 GRADUATES 2072 2417 2809 2750 2470 113 0.280 South PUBLIC FULL-TIME 18016 17966 16555 16506 16310 -487 0.031 PART-TIME 3173 2991 3208 2574 2266 -223 0.060 GRADUATES 6600 6789 6624 6471 6486 -55 0.213 SECULAR FULL-TIME 700 659 694 642 664 -9 0.311 PART-TIME 38 71 27 38 30 -5 0.457 GRADUATES 228 317 296 347 306 19 0.217 RELIGIOUS FULL-TIME 3450 3592 3533 3161 3009 -131 0.086 PART-TIME 478 413 258 357 305 -40 0.160 GRADUATES 1150 1290 1459 1403 1329 47 0.255 West PUBLIC FULL-TIME 4308 4224 4246 4257 4040 -50 0.123 PART-TIME 438 486 372 438 458 -8 0.962 GRADUATES 1780 1647 1586 1635 1655 -26 0.310 SECULAR FULL-TIME 970 724 831 921 876 1 0.981 PART-TIME 97 160 109 243 237 36 0.079 GRADUATES 261 315 279 321 317 12 0.195 RELIGIOUS FULL-TIME 1348 1484 1555 1367 1383 -5 0.893 PART-TIME 83 96 119 189 100 13 0.416 GRADUATES 465 523 554 574 590 30 0.008 Total FULL-TIME 66263 65918 61723 58083 55527 -2931 0.004 PART-TIME 10867 10596 10191 9136 8169 -686 0.007 TOTAL 77130 76514 71914 67219 63696 -3616 0.003 GRADUATES 21938 23145 23786 23488 22447 136 0.644
Table 12. Five-Year RN to Baccalaureate Enrollment and Graduation Changes in the Same 362 Schools by Region, School Designation, and Student Status.
YEAR Change Per
Year Significance 1994 1995 1996 1997 1998 Number of Students Number of Students Number of Students Number of Students Number of Students Number of Students p-value North Atlantic PUBLIC FULL-TIME 509 494 579 629 614 34 0.040 PART-TIME 2841 3146 3248 3525 3291 128 0.094 GRADUATES 940 813 931 1060 1091 55 0.121 SECULAR FULL-TIME 190 175 224 208 212 8 0.254 PART-TIME 4754 4991 5326 5170 5069 81 0.284 GRADUATES 671 766 705 801 815 32 0.086 RELIGIOUS FULL-TIME 164 224 153 155 296 19 0.393 PART-TIME 2311 2452 2170 2203 2145 -58 0.165 GRADUATES 457 479 510 532 542 22 0.002 Midwest PUBLIC FULL-TIME 528 641 555 479 484 -25 0.285 PART-TIME 3513 3353 . 3177 3066 2892 -153 0.001 GRADUATES 1259 1231 1235 1182 1229 -11 0.269 SECULAR FULL-TIME 70 49 33 40 230 31 0.289 PART-TIME 629 639 587 486 299 -81 0.033 GRADUATES 217 233 249 238 176 -8 0.473 RELIGIOUS FULL-TIME 645 570 645 729 728 32 0.129 PART-TIME 1915 1674 2157 2112 2053 71 0.306 GRADUATES 590 650 780 757 778 48 0.045 South PUBLIC FULL-TIME 1299 1451 1347 1350 1410 12 0.597 PART-TIME 3196 3318 3584 3733 3612 125 0.046 GRADUATES 1704 1836 2066 2191 2387 172 0.001 SECULAR FULL-TIME 45 36 39 51 68 6 0.135 PART-TIME 37 41 61 53 34 1 0.894 GRADUATES 55 45 59 56 58 2 0.413 RELIGIOUS FULL-TIME 98 104 100 119 95 1 0.808 PART-TIME 816 573 448 484 403 -91 0.048 GRADUATES 246 271 334 199 197 -17 0.421 West PUBLIC FULL-TIME 320 400 360 289 309 -13 0.420 PART-TIME 633 586 613 482 531 -31 0.115 GRADUATES 299 313 394 373 347 16 0.264 SECULAR FULL-TIME 24 26 22 22 29 1 0.600 PART-TIME 1417 1771 1745 2154 2203 195 0.012 GRADUATES 326 380 477 602 544 66 0.029 RELIGIOUS FULL-TIME 254 281 190 138 118 -41 0.024 PART-TIME 126 213 217 215 107 -4 0.867 GRADUATES 112 102 111 105 201 18 0.206 Total FULL-TIME 4164 4534 4268 4244 4619 62 0.398 PART-TIME 22318 22893 23458 23849 22797 191 0.384 TOTAL 26482 27427 27726 28093 27416 253 _.-0.215 GRADUATES 6930 7153 7901 8159 8412 397 -0.004
Includes three consortium schools not included in the regional data.
Table 13. Five-Year Master's Enrollment and Graduation Changes in the Same 259 Schools by Region, School Designation, and Student Status.
YEAR Change Per
Year Significance 1994 1995 1996 1997 1998 Number of Students Number of Students Number of Students Number of Students Number of Students Number of Students p-value North Atlantic PUBLIC
-FULL-TIME 437 482 583 675 664 65 0.010 PART-TIME 2144 2431 2479 2270 2299 15 0.777 GRADUATES 631 670 781 896 844 65 0.029 SECULAR FULL-TIME 627 735 779 809 836 49 0.013 PART-TIME 2772 2951 2960 2673 2499 -82 0.217 GRADUATES 905 1063 955 1065 1189 57 0.092 RELIGIOUS FULL-TIME 310 408 402 455 442 31 0.058 PART-TIME 1364 1483 1315 1397 1356 -10 0.678 GRADUATES 406 364 450 484 537 38 0.038 Midwest PUBLIC FULL-TIME 1061 1259 1281 1443 1355 77 0.062 PART-TIME 4871 4707 4448 4038 3800 -281 0.001 GRADUATES 1209 1383 1505 1631 1631 109 0.009 SECULAR FULL-TIME 139 143 222 188 147 6 0.664 PART-TIME 363 427 318 384 414 6 0.728 GRADUATES 223 209 276 279 305 23 0.031 RELIGIOUS FULL-TIME 280 337 397 384 392 27 0.060 PART-TIME 997 1253 1191 1297 1258 57 0.144 GRADUATES 276 286 333 396 415 39 0.005 South PUBLIC FULL-TIME 2583 2868 2828 3038 3344 169 0.014 PART-TIME 5573 5386 4845 4645 4312 -326 0.001 GRADUATES 2158 2287 2492 2596 2525 104 0.035 SECULAR FULL-TIME 332 361 423 412 413 21 0.069 PART-TIME 189 205 235 228 291 23 0.026 GRADUATES 206 214 203 234 301 21 0.091 RELIGIOUS FULL-TIME 237 244 264 258 283 11 0.021 PART-TIME 594 580 549 553 498 -22 0.018 GRADUATES 200 207 251 285 335 35 0.004 West PUBLIC FULL-TIME 1655 1708 1753 1530 1527 -43 0.219 PART-TIME 1190 1052 944 865 817 -93 0.003 GRADUATES 905 997 887 1001 950 9 0.641 SECULAR FULL-TIME 34 97 144 161 191 38 0.005 PART-TIME 394 496 581 1103 1235 229 0.013 GRADUATES 32 75 192 209 402 87 0.010 RELIGIOUS FULL-TIME 301 327 298 260 264 -14 0.106 PART-TIME 189 187 155 161 107 -19 0.034 GRADUATES 122 160 162 171 166 10 0.104 Total1 FULL-TIME 8018 8991 9388 9652 9908 444 0.013 PART-TIME 20680 21195 20066 19662 18977 -493 0.035 TOTAL 28698 30186 29454 29314 28885 -50 0.828 GRADUATES 7295 7927 8511 9270 9614 598 0.001Table 14. Five-Year Doctoral Enrollment and Graduation Changes in the Same 66 Schools by Region, School Designation, and Student Status.
YEAR Change Per
. Year Significance 1994 1995 1996 1997 1998 Number of Students Number of Students Number of Students Number of Students Number of Students Number of Students p-value North Atlantic PUBLIC FULL-TIME 26 39 69 53 58 8 0.157 PART-TIME 94 97 102 141 148 15 0.023 GRADUATES 6 12 6 14 12 1 0.293 SECULAR FULL-TIME 109 127 85 111 110 -1 0.813 PART-TIME 372 311 334 291 287 -19 0.063 GRADUATES 49 52 44 43 55 0 0.882 RELIGIOUS FULL-TIME 58 65 75 86 77 6 0.064 PART-TIME 42 58 57 46 59 2 0.454 GRADUATES 14 15 13 11 19 1 0.600 Midwest PUBLIC FULL-TIME 242 264 216 253 237 -2 0.767 PART-TIME 336 328 389 358 355 7 0.442 GRADUATES 60 75 68 87 87 7 0.048 SECULAR FULL-TIME 17 31 23 26 25 1 0.573 PART-TIME 101 119 138 155 140 11 0.060 GRADUATES 16 23 16 24 26 2 0.181 RELIGIOUS FULL-TIME 14 20 26 18 11 -8 0.723 PART-TIME 66 63 71 76 67 1 0.423 GRADUATES 2 4 5 12 17 4 0.011 South PUBLIC FULL-TIME 281 258 236 262 267 -2 0.707 PART-TIME 644 615 626 553 575 -20 0.073 GRADUATES 123 137 122 143 131 2 0.521 SECULAR FULL-TIME 35 33 11 31 32 -8 0.837 PART -TIME. 10 8 34 18 14 2 0.654 GRADUATES 3 0 1 10 7 2 0.210 RELIGIOUS FULL-TIME 1 4 4 PART-TIME 13 13 17 GRADUATES 0 0 0 West PUBLIC FULL-TIME 261 277 309 253 276 1 0.944 PART-TIME 129 104 95 99 116 -3 0.560 GRADUATES 72 59 87 77 45 -4 0.566 SECULAR FULL-TIME 4. PART-TIME GRADUATES RELIGIOUS FULL-TIME 26 4 21 23 16 <1 0.977 PART-TIME 24 37 23 17 25 -2 0.516 GRADUATES 1 10 4 12 7 1 0.392 -Total FULL-TIME 1069 1118 1072 1120 1113 9 0.331 PART-TIME 1818 1740 1882 1767 1803 0 0.989 TOTAL 2887 2858 2954 2887 2916 9 0.529 GRADUATES 346 387 366 433 406 17 0.124
Table 15. Type of Program by Gender of Students Enrolled, Fall 1998.
SCHOOLS
UNDERGRADUATE GRADUATE
GEN. RN
TOTAL
BACC. MAST. DOCT.
POST DOCT. ND REPORTING = 426 485 514 313 70 14 3 GENDER Female 69,246 31,768 101,014 29,593 2,766 28 233 (%) (89.5) (91.7) (90.1) (92.0) (94.5) (90.3) (87.9) Male 8,160 2,893 11,053 2,566 162 3 32 (0/0) (10.5) (8.3) (9.9) (8.0) (5.5) (9.7) (12.1) TOTAL 77,406 34,661 112,067 32,159 2,928 31 265 Not Reported {273} {1073} {1346} {505} {0} {10} {0}
Table 16. Type of Program by Gender of Graduates, August 1, 1997 to July 31, 1998.
SCHOOLS
UNDERGRADUATE GRADUATE
GEN. RN
TOTAL
BACC. MAST. DOCT. ND
REPORTING = 429 494 518 314 70 3 GENDER Female 23,930 9,989 33,919 9,974 395 59 ( %) (88.3) (91.7) (89.2) (93.6) (96.1) (85.5) Male 3,179 907 4,086 686 16 10 (%) (11.7) (8.3) (10.8) (6.4) (3.9) (14.5) TOTAL 27,109 10,896 38,005 10,660 411 69 Not Reported {28} {131} {159} {105} {0} {0}
35
Table 17. Type of Program by Race/Ethnicity of Students Enrolled and Number of Non-Resident Alien Students Enrolled, Fall 1998.
SCHOOLS
UNDERGRADUATE GRADUATE
GEN. RN
TOTAL
BACC. MAST. DOCT.
POST DOCT. ND REPORTING = 421 489 508 311 69 17 3 RACE/ETHNICITY Asian 4,116 931 5,047 1,277 97 2 11 (0/0) (5.4) (2.7) (4.5) (4.0) (3.3) (4.9) (4.2) Black 8,596 3,391 11,987 2,259 167 1 11 (%) (11.2) (9.8) (10.8) (7.0) (5.8) (2.4) (4.2) American Indian or Alaskan Native 477 220 697 191 11' 0 1 (0/0) (0.6) (0.6) (0.6) (0.6) (0.4) (0.4) Hispanic 3,510 1,141 4,651 1,025 42 3 10 (0/0) (4.6) (3.3) (4.2) (3.2) (1.5) (7.3) (3.7) White 56,618 27,081 83,699 25,868 2,279 30 229 (0/0) (73.8) (77.8) (75.1) (80.6) (78.5) (73.2) (86.4) Non-Resident Alien 1,054 209 1,263 285 267 0 3 (%) (1.4) (0.6) (1.1) (0.9) (9.2) (1.1) Unknown 2,276 1,816 4,092 1,174 39 5 0 ( %) (3.0) (5.2) (3.7) (3.7) (1.3) (12.2) TOTAL 76,647 34,789 111,436 32,079 2,902 41 265 Not Reported {1032} {945} {1977} {585} {26} {0} {0}
Table 18. Type of Program by Race/Ethnicity of Graduates and Number of Non-Resident Alien Graduates, August 1, 1997 to July 31, 1998.
SCHOOLS
UNDERGRADUATE GRADUATE
GEN. RN
TOTAL
BACC. MAST. DOCT. ND
REPORTING = 426 492 514 313 70 3 RACE/ETHNICITY Asian 1,357 261 1,618 312 10 3 ( %) (5.0) (2.4) (4.3) (2.9) (2.4) (4.4) Black 2,134 952 3,086 629 26 2 (%) (7.9) (8.8) (8.1) (6.0) (6.3) (2.9) American Indian or Alaskan Native 145 71 216 59 2 1 ( %) (0.5) (0.7) (0.6) (0.6) (0.5) Hispanic 1,047 319 1,366 257 8 2 (0/0) (3.9) (2.9) (3.6) (2.4) (2.0) (2.9) White 21,646 8,970 30,616 8,991 325 59 ( %) (80.3) (82.6) (81.0) (85.3) (79.1) (85.5) Non-Resident Alien 154 50 204 135 33 2 (0/0) (0.6) (0.5) (0.5) (1.3) (8.0) (2.9) Unknown 476 230 706 156 7 0 (%) (1.8) (2.1) (1.9) (1.5) (1.7) TOTAL 26,959 10,853 37,812 10,539 411 69 Not Reported {178} {174} {352} {226} {0} {0}
37
Table 19. Enrollment in the Same Schools Reporting in 1997 and 1998 by Type of Program and Race/Ethnicity and the Number of Non-Resident Alien Students.
PROGRAM TYPE/ ETHNICITY BACCALAUREATE SCHOOLS REPORTING 1997 STUDENTS (%) 1998 STUDENTS ( %) Generic (Entry-Level) 391 Asian 4,376 (5.7) 3,994 (5.5) Black 8,240 (10.7) 8,336 (11.4) American Indian or Alaskan Native 505 (0.7) 460 (0.6) Hispanic 3,217 (4.2) 3,254 (4.5) White 57,632 (75.2) 53,788 (73.7) Non-Resident Alien 823 (1.1) 1,004 (1.4) Unknown 1,805 (2.4) 2,091 (2.9) SUBTOTAL 76,598 72,927 RN to Baccalaureate 451 Asian 846 (2.5) 914 (2.8) Black 3,286 (9.9) 3,199 (9.8) American Indian or Alaskan Native 162 (0.5) 187 (0.6) Hispanic 1,008 (3.0) 1,030 (3.2) White 26,126 (78.7) 25,256 (77.7) Non-Resident Alien 194 (0.6) 199 (0.6) Unknown 1,579 (4.8) 1,715 (5.3) SUBTOTAL 33,201 32,500 Total Baccalaureate 471 Asian 5,222 (4.8) 4,908 (4.7) Black 11,526 (10.5) 11,535 (10.9) American Indian or Alaskan Native 667 (0.6) 647 (0.6) Hispanic 4,225 (3.8) 4,284 (4.1) White 83,758 (76.3) 79,044 (75.0) Non-Resident Alien 1,017 (0.9) 1,203 (1.1) Unknown 3,384 (3.1) 3,806 (3.6) TOTAL 109,799 105,427
Table 19, continued. Enrollment in the Same Schools Reporting in 1997 and 1998 by Type of Program and Race/Ethnicity and the Number of Non-Resident Alien Students.
PROGRAM TYPE/ ETHNICITY GRADUATE SCHOOLS REPORTING 1997 STUDENTS (%) 1998 STUDENTS ( %) Master's 299 Asian 1,211 (3.8) 1,263 (4.1) Black 2,206 (7.0) 2,219 (7.2) American Indian or Alaskan Native 151 (0.5) 185 (0.6) Hispanic 956 (3.0) 1,010 (3.3) White 26,164 (82.7) 24,922 (80.7) Non-Resident Alien 291 (0.9) 270 (0.9) Unknown 676 (2.1) 987 (3.2) TOTAL 31,655 30,856 Doctoral 69 Asian 91 (3.1) 97 (3.3) Black 150 (5.2) 167 (5.8) American Indian or Alaskan Native 13 (0.5) 11 (0.4) Hispanic 46 (1.6) 42 (1.5) White 2,313 (80.1) 2,279 (78.5) Non-Resident Alien 232 (8.0) 267 (9.2) Unknown 42 (1.5) 39 (1.3) TOTAL 2,887 2,902 Nursing Doctorate 3 Asian 18 (5.3) 11 (4.2) Black 14 (4.2) 11 (4.2) American Indian or Alaskan Native 2 (0.6) 1 (0.4) Hispanic 3 (0.9) 10 (3.7) White 296 (87.8) 229 (86.4) Non-Resident Alien 4 (1.2) 3 (1.1) Unknown 0 0 TOTAL 337 265 POSTDOCTORAL 15 Asian 0 2 (5.4) Black 6 (16.2) 1 (2.7) American Indian or Alaskan Native 0 0 Hispanic 1 (2.7) 2 (5.4) White 29 (78.4) 27 (73.0) Non-Resident Alien 1 (2.7) 0 Unknown 0 5 (13.5) TOTAL 37 37
Table 20. Graduations in the Same Schools Reporting in 1997 and 1998 by Type of Program and Race/Ethnicity and the Number of Non-Resident Alien Graduates.
PROGRAM TYPE/ ETHNICITY BACCALAUREATE SCHOOLS REPORTING 1997 GRADUATES (%) 1998 GRADUATES ( %) Generic (Entry-Level) 400 Asian 1,215 (4.5) 1,329 (5.1) Black 1,889 (6.9) 2,067 (8.0) American Indian or Alaskan Native 147 (0.5) 141 (0.5) Hispanic 927 (3.4) 998 (3.8) White 22,438 (82.3) 20,924 (80.5) Non-Resident Alien 129 (0.5) 129 (0.5) Unknown 510 (1.9) 424 (1.6) SUBTOTAL 27,255 26,012 RN to Baccalaureate 453 Asian 219 (2.4) 213 (2.3) Black 740 (8.2) 811 (8.5) American Indian or Alaskan Native 52 (0.6) 59 (0.6) Hispanic 242 (2.7) 250 (2.6) White 7,462 (82.3) 7,938 (83.4) Non-Resident Alien 50 (0.5) 50 (0.5) Unknown 296 (3.3) 194 (2.1) SUBTOTAL 9,061 9,515 Total Baccalaureate 475 Asian 1,434 (4.0) 1,542 (4.3) Black 2,629 (7.2) 2,878 (8.1) American Indian or Alaskan Native 199 (0.6) 200 (0.6) Hispanic 1,169 (3.2) 1,248 (3.5) White 29,900 (82.3) 28,862 (81.3) Non-Resident Alien 179 (0.5) 179 (0.5) Unknown 806 (2.2) 618 (1.7) TOTAL 36,316 35,527
Table 20, continued. Graduations in the Same Schools Reporting in 1997 and 1998 by Type of Program and Race/Ethnicity and the Number of Non-Resident Alien Graduates.
PROGRAM TYPE/ ETHNICITY GRADUATE SCHOOLS REPORTING 1997 GRADUATES (%) 1998 GRADUATES (%) Master's 297 Asian 282 (2.9) 293 (3.0) Black 484 (5.0) 565 (5.7) American Indian or Alaskan Native 56 (0.6) 55 (0.6) Hispanic 199 (2.1) 231 (2.3) White 8,395 (86.9) 8,444 (85.6) Non-Resident Alien 123 (1.2) 134 (1.3) Unknown 125 (1.3) 145 (1.5) TOTAL 9,664 9,867 Doctoral 70 Asian 21 (4.8) 10 (2.4) Black 21 (4.8) 26 (6.3) American Indian or Alaskan Native 1 (0.3) 2 (0.5) Hispanic 5 (1.2) 8 (2.0) White 338 (78.1) 325 (79.1) Non-Resident Alien 43 (9.9) 33 (8.0) Unknown 4 (0.9) 7 (1.7) TOTAL 433 411 Nursing Doctorate 3 Asian 2 (4.3) 3 (4.3) Black 2 (4.3) 2 (2.9) American Indian or Alaskan Native 1 (2.2) 1 (1.5) Hispanic 0 2 (2.9) White 39 (84.9) 59 (85.5) Non-Resident Alien 2 (4.3) 2 (2.9) Unknown 0 0 TOTAL 46 69
41
Table 21. Fall 1998 Enrollment and Graduations from August 1, 1997 to July 31, 1998 of Master's-Level Nursing Students by Major Area of Study
(N=317 Respondent Schools).
MAJOR AREA OF STUDY'
ENROLLMENT GRADUATIONS NUMBER OF PROGRAMS FULL-TIME NUMBER (%) PART-TIME NUMBER (%) TOTAL NUMBER (%) NUMBER (%) Administration2 168 412 (3.7) 1,610 (7.5) 2,022 (6.2) 712 (6.6) Case Management3 16 173 (1.6) 161 (0.7) 334 (1.0) 50 (0.5) Informatics 3 28 (0.2) 64 (0.3) 92 (0.3) 21 (0.2) Health Policy/Mgt 8 20 (0.2) 1,087 (5.1) 1,107 (3.4) 301 (2.8) Education 88 222 (2.0) 1,016 (4.7) 1,238 (3.8) 355 (3.3)
Clinical Nurse Specialist 165 858 (7.7) 2,677 (12.5) 3,535 (10.8) 1,463 (13.6)
Practitioner 270 6,993 (62.9) 11,319 (52.6) 18,312 (56.1) 6,190 (57.5)
{Nurse
Combined Nurse Practitioner/
Clinical Nurse Specialist°. 5 30 489 (4.4) 1,041 (4.8) 1,530 (4.7) 353 (3.3)
Nurse-Midwifery 33 465 (4.2) 273 (1.3) 738 (2.3) 395 (3.7)
Nurse Anesthesia 30 786 (7.1) 260 (1.2) 1,046 (3.2) 327 (3.0)
Community Health 63 321 (2.9) 604 (2.8) 925 (2.8) 328 (3.0)
Undeclared Major Area 54 173 (1.5) 799 (3.7) 972
Other Clinical Majors 39 86 (0.8) 234 (1.1) 320 (1.0) 150 (1.4)
Area Not Specified 15 35 (0.3) 127 (0.6) 162 (0.5) 63 (0.6)
Dual Majors 8 24 (0.2) 125 (0.6) 149 (0.5) 8 (0.1)
Dual Degrees 18 17 (0.1) 85 (0.4) 102 (0.3) 40 (0.4)
Other 5 21 (0.2) 21 (0.1) 42 (0.1) 4 0.037
TOTAL 11,123 21,503 32,626 10,760
Not Reported {38 }6 {5}7
1 Functional or professional role. 2 Includes Nursing Leadership.
3 Includes Managed Care and Continuity of Care.
4 Combined NP/CNS refers to those programs where the NP and CNS roles are merged in the curriculum. Generally, graduates are eligible to sit for both NP and CNS certification examinations.
5 Information in this report pertaining to nurse practitioners is the result of a collaborative effort between the American Association of Colleges of Nursing and the National Organization of Nurse Practitioner Faculties. All nurse practitioner data are owned jointly
by the two organizations.
6 Fall 1998 master's enrollment (32,664) from Table 6 minus total. Master's graduations (10,765) from Table 7 minus total.
Table 22. Enrollment and Graduation Changes of Master's-Level Nursing Students by Major Area of Study in the Same Schools Reporting in Both 1997 and 1998
(N=306 Schools [Enrollment], N=304 Schools [Graduations]).
MAJOR AREA OF STUDY
1997 1998 INCREASE/ DECREASE PERCENT CHANGE NUMBER OF PROGRAMS STUDENTS 166 NUMBER OF PROGRAMS STUDENTS 161 Administration Full-time 410 406 -4 -1.0 Part-time 1,837 1,565 -272 -14.8 TOTAL 2,247 1,971 -276 -12.3 Graduates 850 697 -153 -18.0 Case Management2 12 17 Full-time 160 175 15 9.4 Part-time 135 159 24 17.8 TOTAL 295 334 39 13.2 Graduates 44 45 1 2.3 Informatics 2 3 Full-time 22 28 6 27.3 Part-time 50 64 14 28.0 TOTAL 72 92 20 27.8 Graduates 13 21 8 61.5 Health Policy/Mgt 4 8 Full-time 8 20 12 >100.0 Part-time 29 1,087 1,058 >100.0 TOTAL 37 1,107 1,070 >100.0 Graduates 26 301 275 >100.0 Education 86 85 Full-time 184 211 27 14.7 Part-time 1,087 977 -110 -10.1 TOTAL 1,271 1,188 -83 -6.5 Graduates 480 348 -132 -27.5
Clinical Nurse Specialist 153 160
Full-time 895 831 -64 -7.2 Part-time 3,398 2,631 -767 -22.6 TOTAL 4,293 3,462 -831 -19.4 Graduates 1,604 1,416 -188 -11.7 Nurse Practitioner3' 4 257 287 Full-time 7,300 7,306 6 <1.0 Part-time 11,695 11,884 189 1.6 TOTAL 18,995 19,190 195 1.0 Graduates 5,443 6,304 861 15.8 Nurse-Midwifery 33 33 Full-time 471 465 -6 -1.3 Part-time 239 273 34 14.2 TOTAL 710 738 28 3.9 Graduates 375 395 20 5.3 Nurse Anesthesia 30 30 Full-time 719 786 67 9.3 Part-time 253 260 7 2.8 TOTAL 972 1,046 74 7.6 Graduates 355 327 -28 -7.9 Community Health 57 61 Full-time 276 321 45 16.3 Part-time 620 580 -40 -6.5 TOTAL 896 901 5 <1.0 Graduates 247 325 78 31.6
Table 22, continued. Enrollment and Graduation Changes of Master's-Level Nursing Students by Major Area of Study in the Same Schools Reporting in Both 1997 and 1998
(N=306 Schools [Enrollment], N=304 Schools [Graduations]).
MAJOR AREA OF STUDY'
1997 1998 INCREASE/ DECREASE PERCENT CHANGE NUMBER OF PROGRAMS STUDENTS 57 NUMBER OF PROGRAMS STUDENTS 50 Undeclared Full-time 73 163 90 >100.0 Part-time 976 753 -223 -22.8 TOTAL 1,049 916 -133 -12.7 Graduates
Other Clinical Majors 26 37
Full-time 85 82 -3 -3.5
Part-time 276 229 -47 -17.0
TOTAL 361 311 -50 -13.9
Graduates 140 149 9 6.4
Area Not Specified 10 15
Full-time 4 35 31 >100.0 Part-time 1,066 127 -939 -88.1 TOTAL 1,070 162 -908 -84.9 Graduates 167 63 -104 -62.3 Dual Majors 5 8 Full-time 7 24 17 >100.0 Part-time 34 125 91 >100.0 TOTAL 41 149 108 >100.0 Graduates 2 8 6 >100.0 Dual Degrees 13 16 Full-time 25 14 -11 -44.0 Part-time 55 64 9 16.4 TOTAL 80 78 -2 -2.5 Graduates 20 40 20 100.0 Other 3 4 Full-time 8 12 4 50.0 Part-time 1 17 16 >100.0 TOTAL 9 29 20 >100.0 Graduates 8 0 -8 -100.0 TOTAL Full-time 10,647 10,879 232 2.2 Part-time 21,751 20,795 -956 -4.4 TOTAL 32,398 31,674 -724 -2.2 Graduates 9,774 10,439 665 6.8 Not Reported TOTAL {522} {46} Graduates {245} {5}
1 Functional or professional role.
2
Includes Managed Care and Continuity of Care.
3
Nurse Practitioner or Combined Nurse Practitioner/Clinical Nurse Specialist. Combined NP/CNS refers to those programs where the NP and CNS roles are merged in the curriculum. Generally, graduates are eligible to sit for both NP and CNS certification
examinations.
4
Information in this report pertaining to nurse practitioners is the result of a collaborative effort between the American Association of Colleges of Nursing and the National Organization of Nurse Practitioner Faculties. All nurse practitioner data are owned jointly