Dynegy Midwest Generation, LLC
January 31, 2018
2017 Annual Groundwater Monitoring
and Corrective Action Report
Baldwin Fly
Ash Pond
System –
CCR Unit
ID 605
Baldwin Energy Complex
10901 Baldwin Road
Baldwin
, Illinois
62217
O B G T H E R E ’ S A W A Y
BALDWIN FLY ASH POND SYSTEM
2017 ANNUAL GROUNDWATER MONITORING AND CORRECTIVE ACTION REPORT
ERIC J. TLACHAC, PE
Senior Engineer
KRISTEN L. THEESFELD
Hydrogeologist
JANUARY 31, 2018 | PROJECT #67719
2017 Annual Groundwater
Monitoring and Corrective Action
Report
Prepared for:
Dynegy Midwest Generation, LLC
Baldwin Fly Ash Pond System – CCR Unit ID 605
Baldwin Energy Complex
Baldwin, Illinois
OBG
| JA NUARY 31, 201 8
FINAL |
I
Baldwin Fly Ash Pond System 2017 Annual Report FINAL.docx
BALDWIN FLY ASH POND SYSTEM
2017 ANNUAL GROUNDWATER MONITORING AND CORRECTIVE ACTION REPORT
TABLE OF CONTENTS
LIST OF TABLES ... i
LIST OF FIGURES ... i
ACRONYMS AND ABBREVIATIONS ... ii
1
INTRODUCTION ... 1
1.1
Overview ... 1
1.2
Monitoring and Corrective Action Program Status ... 1
2
KEY ACTIONS COMPLETED IN 2017 ... 2
2.1
Summary ... 2
2.2
Problems Encountered and Actions to Resolve the Problems ... 2
3
KEY ACTIVITIES PLANNED FOR 2018 ... 3
3.1
Summary ... 3
REFERENCES ... 4
LIST OF TABLES
Table 1
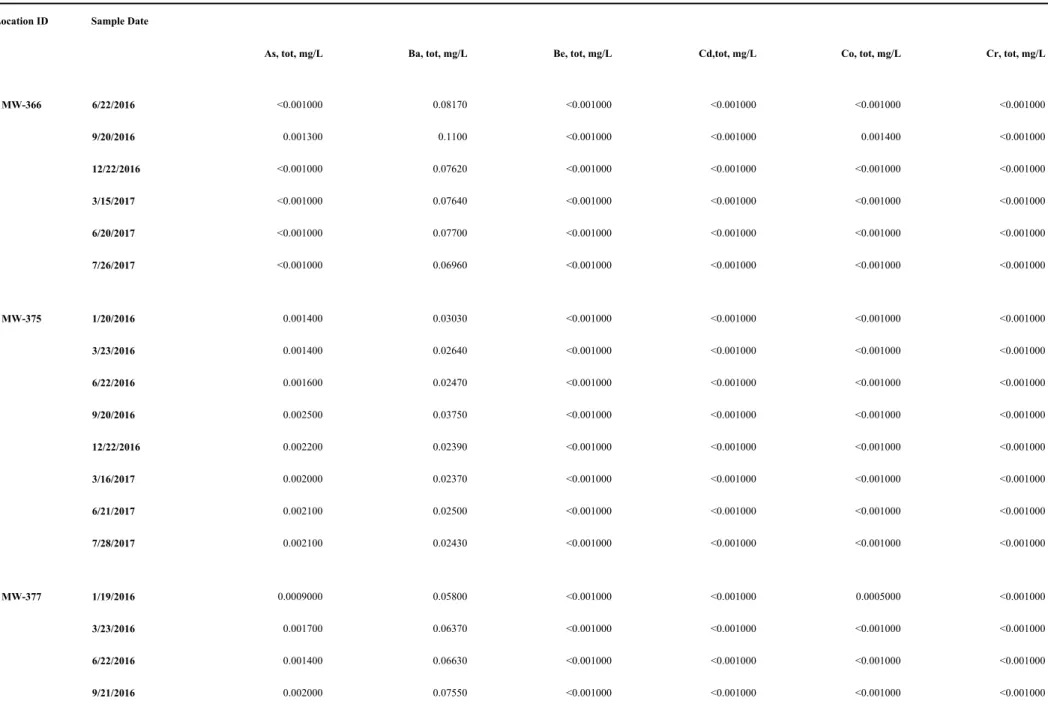
Baldwin Fly Ash Pond System: Appendix III Analytical Results
Table 2
Baldwin Fly Ash Pond System: Appendix IV Analytical Results
LIST OF FIGURES
BALDWIN FLY ASH POND SYSTEM
2017 ANNUAL GROUNDWATER MONITORING AND CORRECTIVE ACTION REPORT
OBG
| JA NUARY 31, 201 8
FINAL |
II
Baldwin Fly Ash Pond System 2017 Annual Report FINAL.docx
ACRONYMS AND ABBREVIATIONS
CCR
Coal Combustion Residuals
CFR
Code of Federal Regulations
mg/L
milligrams per liter
NRT/OBG
Natural Resource Technology, an OBG Company
OBG
O’Brien & Gere Engineers, Inc.
SSI
statistically significant increase
OBG
| JA NUARY 31, 201 8
FINAL |
1 OF 4
Baldwin Fly Ash Pond System 2017 Annual Report FINAL.docx
BALDWIN FLY ASH POND SYSTEM
2017 ANNUAL GROUNDWATER MONITORING AND CORRECTIVE ACTION REPORT
1
INTRODUCTION
1.1
OVERVIEW
This report has been prepared on behalf of Dynegy Midwest Generation, LLC by O’Brien & Gere Engineers, Inc.
(OBG), to provide the information required by 40 CFR 257.90(e) for the Baldwin Fly Ash Pond System located at
Baldwin Energy Complex near Baldwin, Illinois.
In accordance with 40 CFR 257.90(e), the owner or operator of an existing CCR unit must prepare an annual
groundwater monitoring and corrective action report, for the preceding calendar year, that documents the
status of the groundwater monitoring and corrective action program for the CCR unit, summarizes key actions
completed, describes any problems encountered, discusses actions to resolve the problems, and projects key
activities for the upcoming year. At a minimum, the annual report must contain the following information, to the
extent available:
1. A map, aerial image, or diagram showing the CCR unit and all background (or upgradient) and downgradient
monitoring wells, to include the well identification numbers, that are part of the groundwater monitoring
program for the CCR unit.
2. Identification of any monitoring wells that were installed or decommissioned during the preceding year,
along with a narrative description of why those actions were taken.
3. In addition to all the monitoring data obtained under §§ 257.90 through 257.98, a summary including the
number of groundwater samples that were collected for analysis for each background and downgradient
well, the dates the samples were collected, and whether the sample was required by the detection monitoring
or assessment monitoring programs.
4. A narrative discussion of any transition between monitoring programs (
e.g.,
the date and circumstances for
transitioning from detection monitoring to assessment monitoring in addition to identifying the
constituent(s) detected at a statistically significant increase over background levels).
5. Other information required to be included in the annual report as specified in §§ 257.90 through 257.98.
1This report provides the required information for the Baldwin Fly Ash Pond System for calendar year 2017.
1.2
MONITORING AND CORRECTIVE ACTION PROGRAM STATUS
The final three independent samples of the minimum eight required by 40 CFR 257.94(b) were collected and
analyzed from each background and downgradient well in 2017 before October 17. The other five independent
samples were collected and analyzed in 2015 and 2016.
The first semi-annual monitoring sample for the Detection Monitoring Program was collected in November 2017
from each well.
Using the last of the minimum eight samples required to be collected by October 17, 2017 to determine whether
a statistically significant increase (SSI) of Appendix III parameters over background concentrations has
occurred, evaluation of analytical data from the downgradient wells was initiated beginning no later than
October 17, 2017 for the initial eight samples. SSI determinations will be completed within 90 days (January 15,
2018). In addition, SSI determinations will be completed within 90 days of completion of analysis for the first
semi-annual detection monitoring sample collected on November 27-28, 2017, for which analytical data was
received on December 13, 2017.
1
For calendar year 2017, corrective action and other information required to be included in the annual report as specified in §§ 257.90
through 257.98 is inapplicable.
OBG
| JA NUARY 31, 201 8
FINAL |
2 OF 4
Baldwin Fly Ash Pond System 2017 Annual Report FINAL.docx
BALDWIN FLY ASH POND SYSTEM
2017 ANNUAL GROUNDWATER MONITORING AND CORRECTIVE ACTION REPORT
2
KEY ACTIONS COMPLETED IN 2017
2.1
SUMMARY
Three groundwater sampling events were completed in 2017 as part of an effort initiated in 2015 to collect eight
independent samples from background and downgradient monitoring wells in accordance with 40 CFR
257.94(b).
Subsequent to collection of the eight independent samples, an additional sampling event was completed in
November 2017 for parameters listed in Appendix III, 40 CFR Part 257, to supplement the background data set
and as the first semi-annual monitoring sampling event for the Detection Monitoring Program.
A map showing the groundwater monitoring system, including the CCR unit and all background and
downgradient monitoring wells with well identification numbers, for the Baldwin Fly Ash Pond System is
presented in Figure 1. No monitoring wells were installed or decommissioned from the monitoring system in
2017.
Samples were collected and analyzed in accordance with the Sampling and Analysis Plan (NRT/OBG, 2017a)
prepared for the Baldwin Fly Ash Pond System.
All monitoring data obtained under 40 CFR §§ 257.90 through 257.98 (as applicable) in 2017, as well as
monitoring data for the previously collected five independent samples are presented in Tables 1 and 2. Sample
collection dates in 2017 were March 15-16, June 19-21, July 25-28, and November 27-28. Sample collection
dates for previously collected five independent samples are identified in Tables 1 and 2. One ground water
sample was collected from each background and downgradient well in each sampling event. MW391 did not
have a sufficient quantity of groundwater to facilitate sample collection during the March, June, August, and
September 2016 sampling events, as well as those in July and November 2017.
Statistical evaluation of analytical data from the eight independent samples required to be collected by October
17, 2017 and the first semi-annual detection monitoring event on November 27-28, 2017 was initiated and will
be completed within 90 days of October 17, 2017 (January 15, 2018) or 90 days from receipt of the data from
the first semi-annual detection monitoring event (March 13, 2018), respectively. Statistical evaluation of
analytical data is being performed in accordance with the Statistical Analysis Plan, Baldwin Energy Complex,
Dynegy Midwest Generation, LLC (NRT/OBG, 2017b).
2.2
PROBLEMS ENCOUNTERED AND ACTIONS TO RESOLVE THE PROBLEMS
No problems were encountered with the groundwater monitoring program during 2017. Groundwater samples
were collected and analyzed in accordance with the Sampling and Analysis Plan, and all data was accepted.
OBG
| JA NUARY 31, 201 8
FINAL |
3 OF 4
Baldwin Fly Ash Pond System 2017 Annual Report FINAL.docx
BALDWIN FLY ASH POND SYSTEM
2017 ANNUAL GROUNDWATER MONITORING AND CORRECTIVE ACTION REPORT
3
KEY ACTIVITIES PLANNED FOR 2018
3.1
SUMMARY
The following key activities are planned for 2018:
Continuation of the Detection Monitoring Program with semi-annual sampling scheduled for the 2nd and 4th
quarters of 2018.
Complete evaluation of analytical data from the downgradient wells, using both the eight samples required to
be collected by October 17, 2017 and the first semi-annual detection monitoring sample taken in November
2017 to determine whether a SSI of Appendix III parameters over background concentrations has occurred.
If an SSI is identified, potential alternate sources (
i.e.
, a source other than the CCR unit caused the SSI or that
that SSI resulted from error in sampling, analysis, statistical evaluation, or natural variation in groundwater
quality) will be evaluated. If an alternate source is demonstrated to be the cause of the SSI, a written
demonstration will be completed within 90 days of SSI detection and included in the annual groundwater
monitoring and corrective action report for 2018.
»
If an alternate source(s) is not identified to be the cause of the SSI, the applicable requirements of 40 CFR
§§ 257.94 through 257.98 (
e.g.
, assessment monitoring) as may apply in 2018 will be met, including
BALDWIN FLY ASH POND SYSTEM
2017 ANNUAL GROUNDWATER MONITORING AND CORRECTIVE ACTION REPORT
OBG
| JA NUARY 31, 201 8
FINAL |
4 OF 4
Baldwin Fly Ash Pond System 2017 Annual Report FINAL.docx
REFERENCES
Natural Resource Technology, an OBG Company, 2017a, Sampling and Analysis Plan, Baldwin Fly Ash Pond
System, Baldwin Energy Complex, Baldwin, Illinois, Project No. 2285, Revision 0, October 17, 2017.
Natural Resource Technology, an OBG Company, 2017b, Statistical Analysis Plan, Baldwin Energy Complex,
Havana Power Station, Hennepin Power Station, Wood River Power Station, Dynegy Midwest Generation, LLC,
October 17, 2017.
O B G T H E R E ’ S A W A Y
BALDWIN FLY ASH POND SYSTEM
2017 ANNUAL GROUNDWATER MONITORING AND CORRECTIVE ACTION REPORT
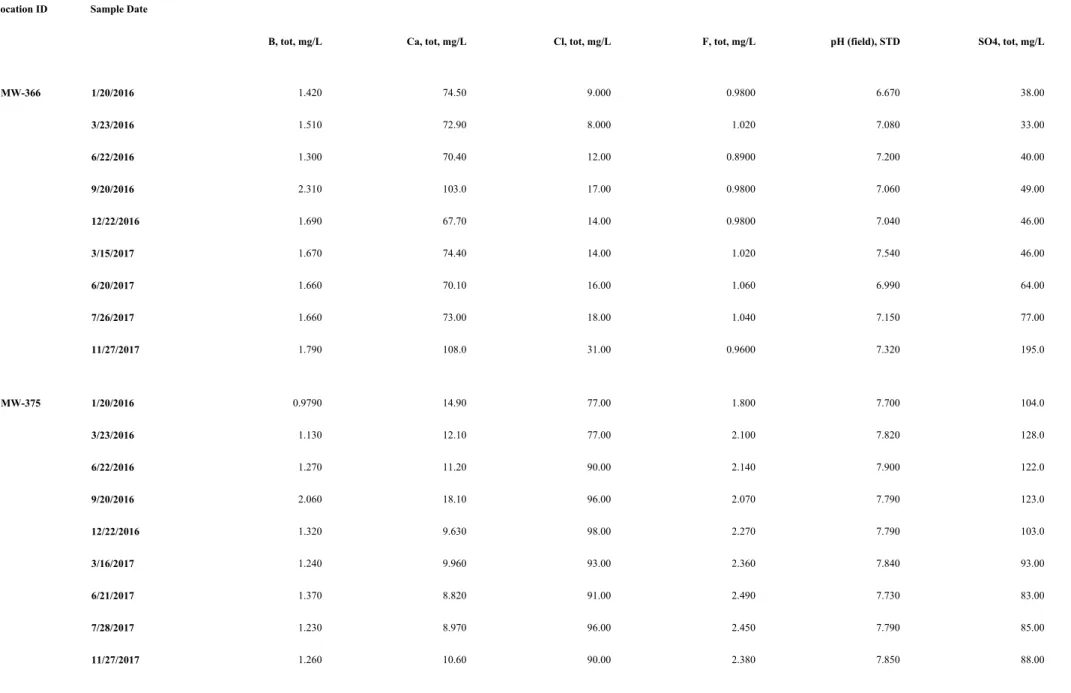
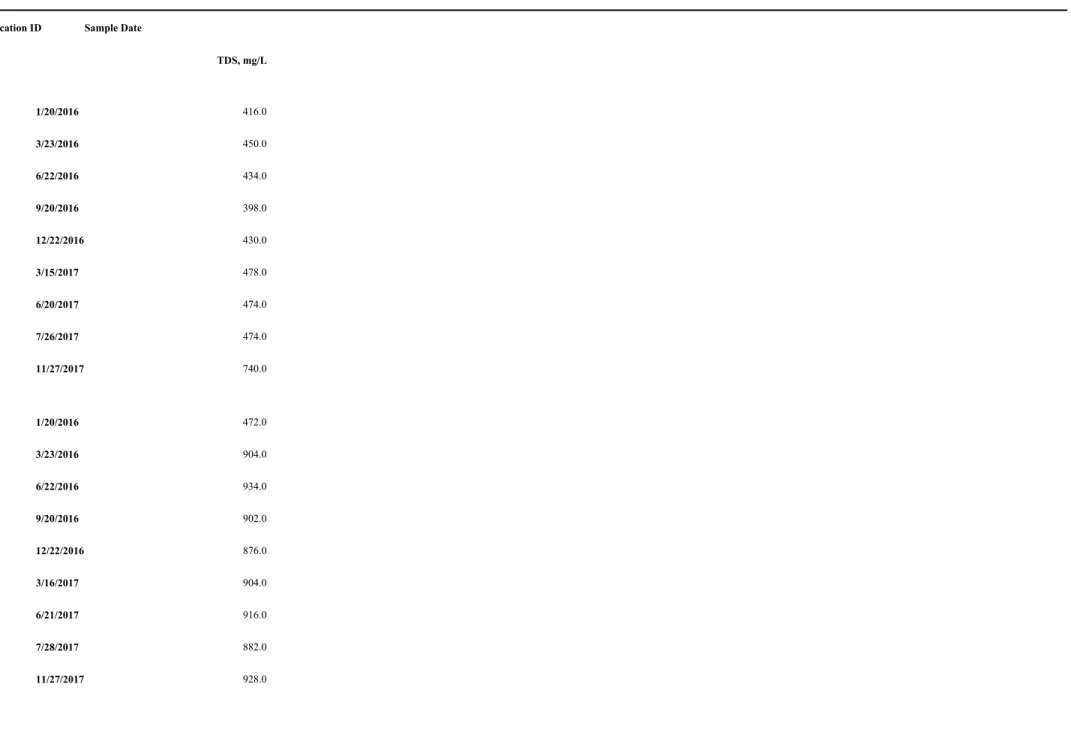
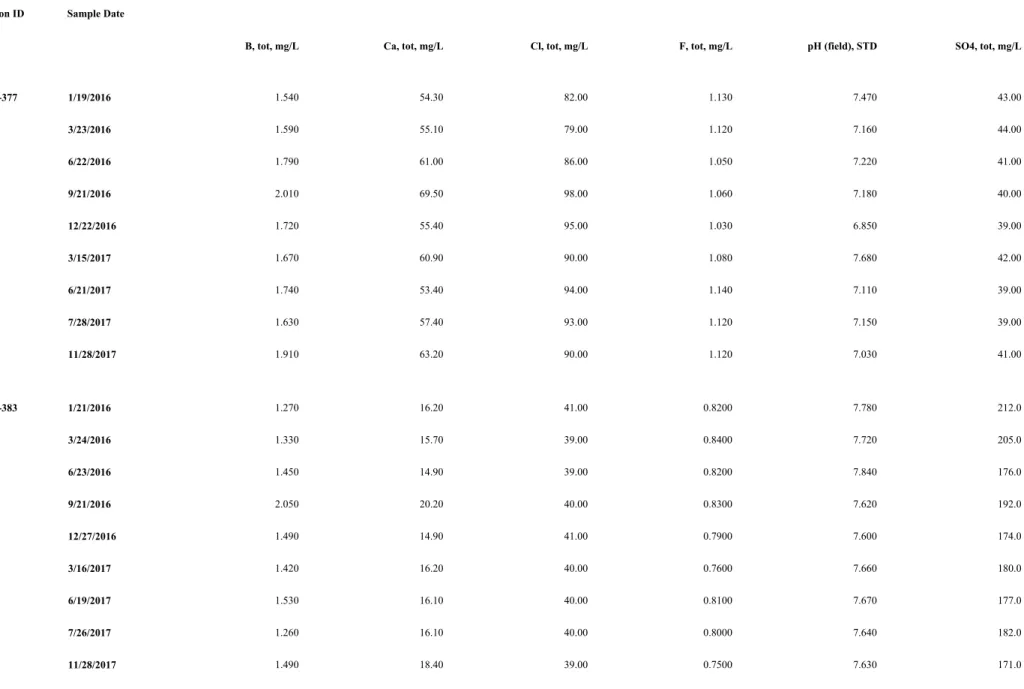
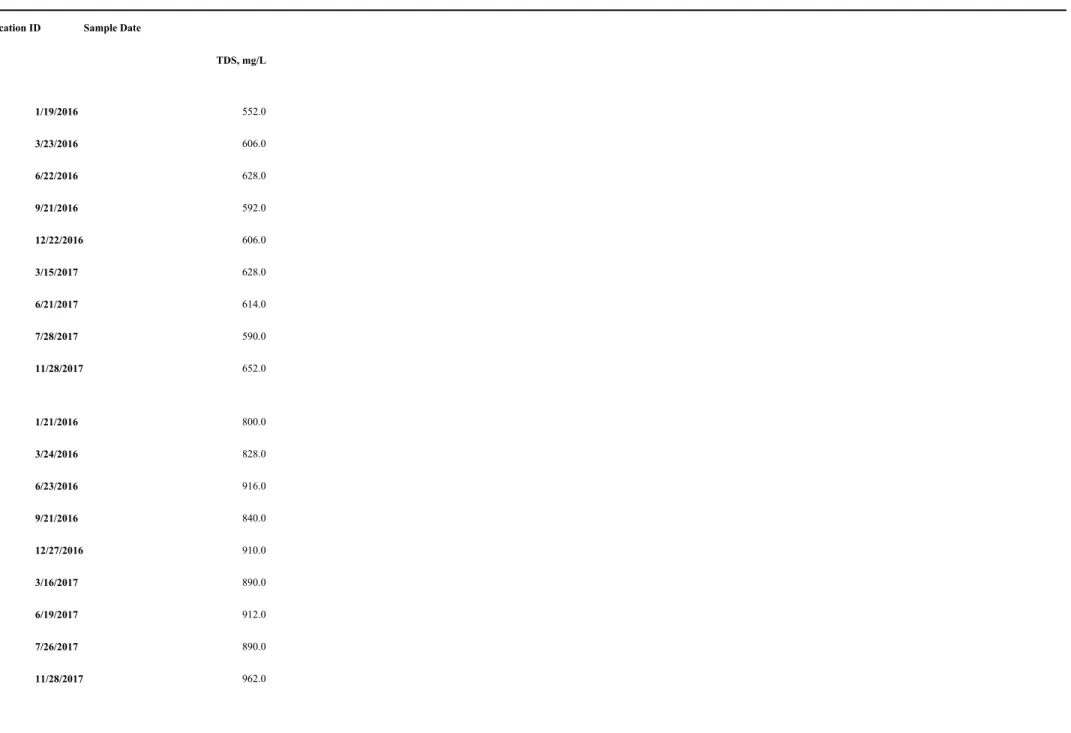
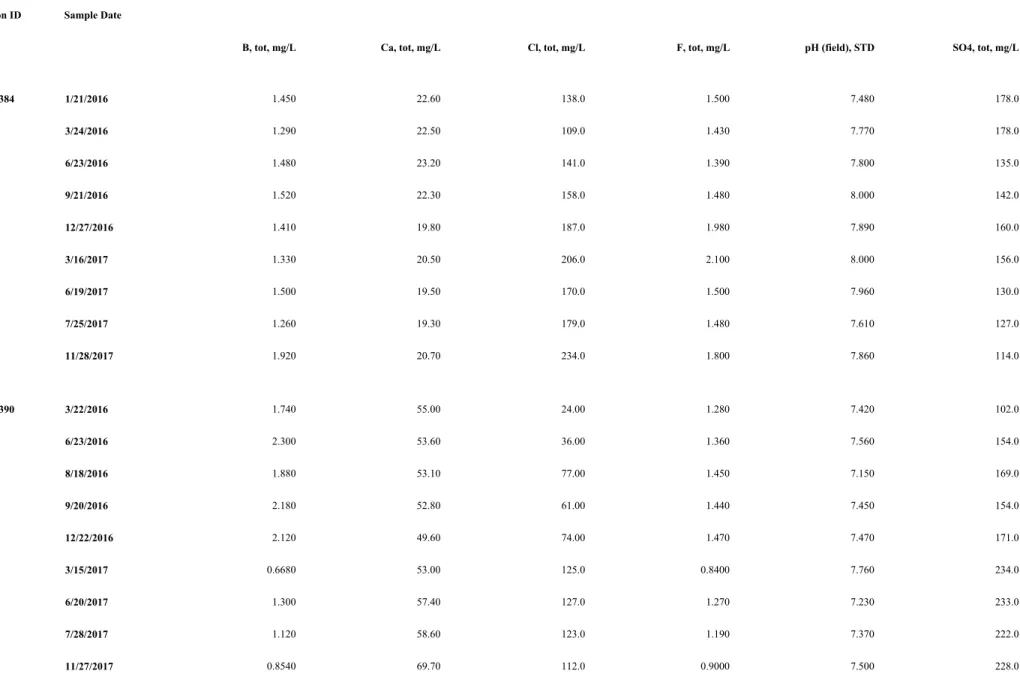
Table 1. Baldwin Fly Ash Pond System: Appendix III Analytical Results
Baldwin
11:27:27 AM
January 12, 2018
Sample Date Location IDB, tot, mg/L Ca, tot, mg/L Cl, tot, mg/L F, tot, mg/L pH (field), STD SO4, tot, mg/L
MW-304 12/29/2015 1.280 9.640 124.0 1.980 8.040 157.0 3/21/2016 1.270 9.860 131.0 1.860 8.180 163.0 6/21/2016 1.330 14.30 140.0 1.590 8.100 200.0 9/19/2016 1.950 16.50 138.0 1.660 7.850 176.0 12/27/2016 1.510 15.40 141.0 1.610 7.870 177.0 3/16/2017 1.490 6.910 144.0 1.660 7.940 166.0 6/21/2017 1.550 17.80 152.0 1.840 7.910 177.0 7/28/2017 1.420 13.20 155.0 1.750 7.830 187.0 11/28/2017 1.450 11.40 138.0 1.720 7.950 178.0 MW-306 3/22/2016 0.6340 6.100 34.00 0.8300 9.860 19.00 6/21/2016 0.4780 5.370 33.00 0.6900 10.30 21.00 8/18/2016 0.3220 22.40 41.00 0.5400 10.30 25.00 9/19/2016 0.2400 35.30 47.00 0.5500 11.02 28.00 12/27/2016 0.2200 30.70 47.00 0.5800 10.83 26.00 3/16/2017 0.3060 19.70 51.00 0.6100 11.22 27.00 6/21/2017 0.2250 26.30 53.00 0.6200 11.13 30.00 7/28/2017 0.2590 15.30 54.00 0.6000 10.89 31.00 11/28/2017 0.4070 3.400 55.00 0.6500 10.66 39.00
1
MANAGES V 4.0.15691
Table 1. Baldwin Fly Ash Pond System: Appendix III Analytical Results
Baldwin
11:27:27 AM
January 12, 2018
Sample Date Location ID TDS, mg/L MW-304 12/29/2015 1090. 3/21/2016 1200. 6/21/2016 1220. 9/19/2016 1220. 12/27/2016 1230. 3/16/2017 1280. 6/21/2017 1360. 7/28/2017 1330. 11/28/2017 1330. MW-306 3/22/2016 482.0 6/21/2016 408.0 8/18/2016 314.0 9/19/2016 235.0 12/27/2016 360.0 3/16/2017 328.0 6/21/2017 335.0 7/28/2017 256.0 11/28/2017 328.01
Table 1. Baldwin Fly Ash Pond System: Appendix III Analytical Results
Baldwin
11:27:27 AM
January 12, 2018
Sample Date Location IDB, tot, mg/L Ca, tot, mg/L Cl, tot, mg/L F, tot, mg/L pH (field), STD SO4, tot, mg/L
MW-366 1/20/2016 1.420 74.50 9.000 0.9800 6.670 38.00 3/23/2016 1.510 72.90 8.000 1.020 7.080 33.00 6/22/2016 1.300 70.40 12.00 0.8900 7.200 40.00 9/20/2016 2.310 103.0 17.00 0.9800 7.060 49.00 12/22/2016 1.690 67.70 14.00 0.9800 7.040 46.00 3/15/2017 1.670 74.40 14.00 1.020 7.540 46.00 6/20/2017 1.660 70.10 16.00 1.060 6.990 64.00 7/26/2017 1.660 73.00 18.00 1.040 7.150 77.00 11/27/2017 1.790 108.0 31.00 0.9600 7.320 195.0 MW-375 1/20/2016 0.9790 14.90 77.00 1.800 7.700 104.0 3/23/2016 1.130 12.10 77.00 2.100 7.820 128.0 6/22/2016 1.270 11.20 90.00 2.140 7.900 122.0 9/20/2016 2.060 18.10 96.00 2.070 7.790 123.0 12/22/2016 1.320 9.630 98.00 2.270 7.790 103.0 3/16/2017 1.240 9.960 93.00 2.360 7.840 93.00 6/21/2017 1.370 8.820 91.00 2.490 7.730 83.00 7/28/2017 1.230 8.970 96.00 2.450 7.790 85.00 11/27/2017 1.260 10.60 90.00 2.380 7.850 88.00
2
MANAGES V 4.0.15691
Table 1. Baldwin Fly Ash Pond System: Appendix III Analytical Results
Baldwin
11:27:27 AM
January 12, 2018
Sample Date Location ID TDS, mg/L MW-366 1/20/2016 416.0 3/23/2016 450.0 6/22/2016 434.0 9/20/2016 398.0 12/22/2016 430.0 3/15/2017 478.0 6/20/2017 474.0 7/26/2017 474.0 11/27/2017 740.0 MW-375 1/20/2016 472.0 3/23/2016 904.0 6/22/2016 934.0 9/20/2016 902.0 12/22/2016 876.0 3/16/2017 904.0 6/21/2017 916.0 7/28/2017 882.0 11/27/2017 928.02
Table 1. Baldwin Fly Ash Pond System: Appendix III Analytical Results
Baldwin
11:27:27 AM
January 12, 2018
Sample Date Location IDB, tot, mg/L Ca, tot, mg/L Cl, tot, mg/L F, tot, mg/L pH (field), STD SO4, tot, mg/L
MW-377 1/19/2016 1.540 54.30 82.00 1.130 7.470 43.00 3/23/2016 1.590 55.10 79.00 1.120 7.160 44.00 6/22/2016 1.790 61.00 86.00 1.050 7.220 41.00 9/21/2016 2.010 69.50 98.00 1.060 7.180 40.00 12/22/2016 1.720 55.40 95.00 1.030 6.850 39.00 3/15/2017 1.670 60.90 90.00 1.080 7.680 42.00 6/21/2017 1.740 53.40 94.00 1.140 7.110 39.00 7/28/2017 1.630 57.40 93.00 1.120 7.150 39.00 11/28/2017 1.910 63.20 90.00 1.120 7.030 41.00 MW-383 1/21/2016 1.270 16.20 41.00 0.8200 7.780 212.0 3/24/2016 1.330 15.70 39.00 0.8400 7.720 205.0 6/23/2016 1.450 14.90 39.00 0.8200 7.840 176.0 9/21/2016 2.050 20.20 40.00 0.8300 7.620 192.0 12/27/2016 1.490 14.90 41.00 0.7900 7.600 174.0 3/16/2017 1.420 16.20 40.00 0.7600 7.660 180.0 6/19/2017 1.530 16.10 40.00 0.8100 7.670 177.0 7/26/2017 1.260 16.10 40.00 0.8000 7.640 182.0 11/28/2017 1.490 18.40 39.00 0.7500 7.630 171.0
3
MANAGES V 4.0.15691
Table 1. Baldwin Fly Ash Pond System: Appendix III Analytical Results
Baldwin
11:27:27 AM
January 12, 2018
Sample Date Location ID TDS, mg/L MW-377 1/19/2016 552.0 3/23/2016 606.0 6/22/2016 628.0 9/21/2016 592.0 12/22/2016 606.0 3/15/2017 628.0 6/21/2017 614.0 7/28/2017 590.0 11/28/2017 652.0 MW-383 1/21/2016 800.0 3/24/2016 828.0 6/23/2016 916.0 9/21/2016 840.0 12/27/2016 910.0 3/16/2017 890.0 6/19/2017 912.0 7/26/2017 890.0 11/28/2017 962.03
Table 1. Baldwin Fly Ash Pond System: Appendix III Analytical Results
Baldwin
11:27:27 AM
January 12, 2018
Sample Date Location IDB, tot, mg/L Ca, tot, mg/L Cl, tot, mg/L F, tot, mg/L pH (field), STD SO4, tot, mg/L
MW-384 1/21/2016 1.450 22.60 138.0 1.500 7.480 178.0 3/24/2016 1.290 22.50 109.0 1.430 7.770 178.0 6/23/2016 1.480 23.20 141.0 1.390 7.800 135.0 9/21/2016 1.520 22.30 158.0 1.480 8.000 142.0 12/27/2016 1.410 19.80 187.0 1.980 7.890 160.0 3/16/2017 1.330 20.50 206.0 2.100 8.000 156.0 6/19/2017 1.500 19.50 170.0 1.500 7.960 130.0 7/25/2017 1.260 19.30 179.0 1.480 7.610 127.0 11/28/2017 1.920 20.70 234.0 1.800 7.860 114.0 MW-390 3/22/2016 1.740 55.00 24.00 1.280 7.420 102.0 6/23/2016 2.300 53.60 36.00 1.360 7.560 154.0 8/18/2016 1.880 53.10 77.00 1.450 7.150 169.0 9/20/2016 2.180 52.80 61.00 1.440 7.450 154.0 12/22/2016 2.120 49.60 74.00 1.470 7.470 171.0 3/15/2017 0.6680 53.00 125.0 0.8400 7.760 234.0 6/20/2017 1.300 57.40 127.0 1.270 7.230 233.0 7/28/2017 1.120 58.60 123.0 1.190 7.370 222.0 11/27/2017 0.8540 69.70 112.0 0.9000 7.500 228.0
4
MANAGES V 4.0.15691
Table 1. Baldwin Fly Ash Pond System: Appendix III Analytical Results
Baldwin
11:27:27 AM
January 12, 2018
Sample Date Location ID TDS, mg/L MW-384 1/21/2016 992.0 3/24/2016 1080. 6/23/2016 1110. 9/21/2016 1080. 12/27/2016 1220. 3/16/2017 1230. 6/19/2017 1120. 7/25/2017 1090. 11/28/2017 1230. MW-390 3/22/2016 590.0 6/23/2016 722.0 8/18/2016 778.0 9/20/2016 704.0 12/22/2016 780.0 3/15/2017 898.0 6/20/2017 894.0 7/28/2017 842.0 11/27/2017 898.04
Table 1. Baldwin Fly Ash Pond System: Appendix III Analytical Results
Baldwin
11:27:27 AM
January 12, 2018
Sample Date Location IDB, tot, mg/L Ca, tot, mg/L Cl, tot, mg/L F, tot, mg/L pH (field), STD SO4, tot, mg/L
MW-391 12/22/2016 1.300 22.40 258.0 2.560 7.630 679.0
3/15/2017 1.430 24.50 274.0 2.650 7.950 726.0
6/20/2017 1.880 23.60 300.0 2.780 7.510 758.0
5
MANAGES V 4.0.15691
Table 1. Baldwin Fly Ash Pond System: Appendix III Analytical Results
Baldwin
11:27:27 AM
January 12, 2018
Sample Date Location ID TDS, mg/L MW-391 12/22/2016 1980. 3/15/2017 2260. 6/20/2017 2460.5
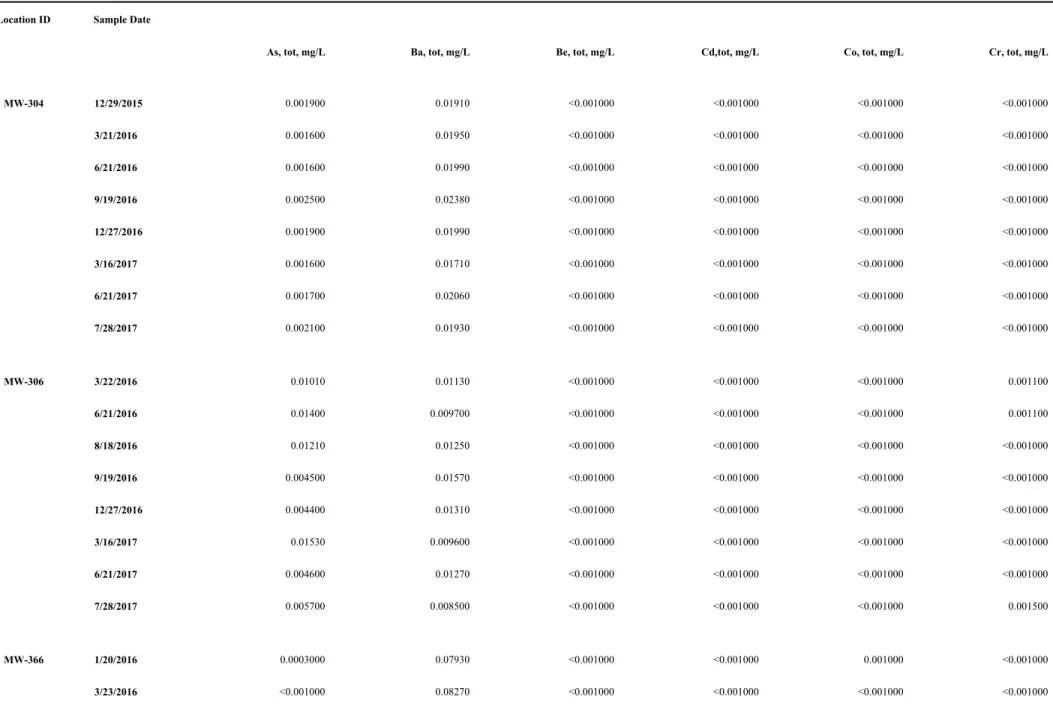
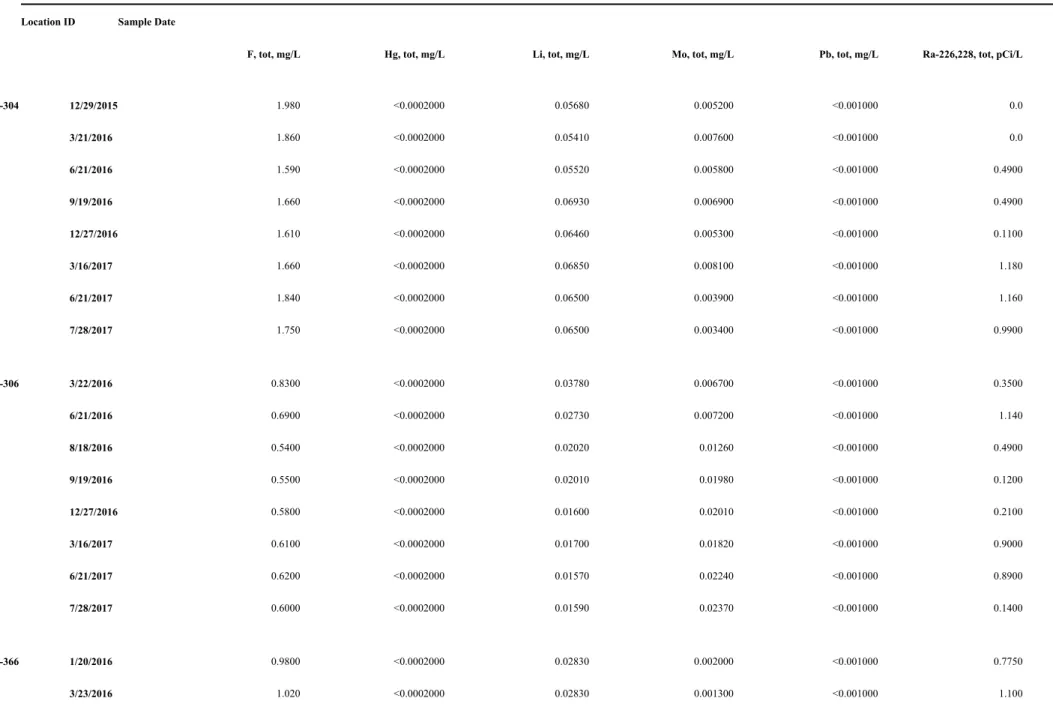
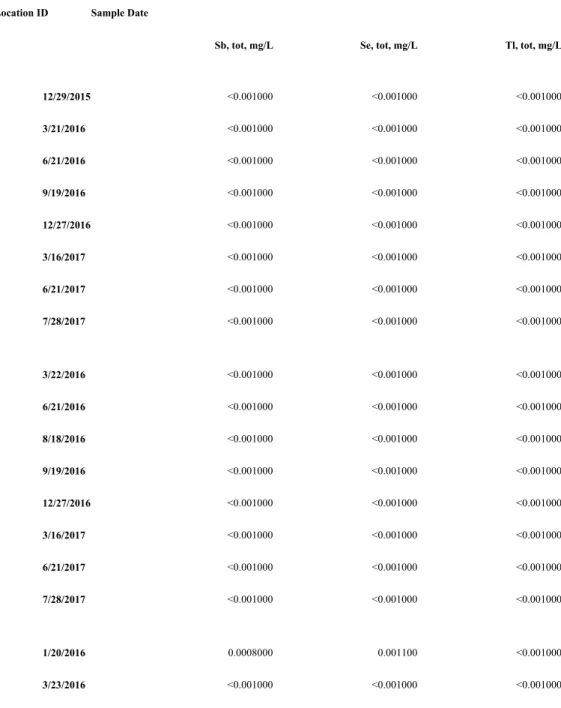
Table 2. Baldwin Fly Ash Pond System: Appendix IV Analytical Results
Baldwin
11:27:44 AM
January 12, 2018
Sample Date Location IDAs, tot, mg/L Ba, tot, mg/L Be, tot, mg/L Cd,tot, mg/L Co, tot, mg/L Cr, tot, mg/L
MW-304 12/29/2015 0.001900 0.01910 <0.001000 <0.001000 <0.001000 <0.001000 3/21/2016 0.001600 0.01950 <0.001000 <0.001000 <0.001000 <0.001000 6/21/2016 0.001600 0.01990 <0.001000 <0.001000 <0.001000 <0.001000 9/19/2016 0.002500 0.02380 <0.001000 <0.001000 <0.001000 <0.001000 12/27/2016 0.001900 0.01990 <0.001000 <0.001000 <0.001000 <0.001000 3/16/2017 0.001600 0.01710 <0.001000 <0.001000 <0.001000 <0.001000 6/21/2017 0.001700 0.02060 <0.001000 <0.001000 <0.001000 <0.001000 7/28/2017 0.002100 0.01930 <0.001000 <0.001000 <0.001000 <0.001000 MW-306 3/22/2016 0.01010 0.01130 <0.001000 <0.001000 <0.001000 0.001100 6/21/2016 0.01400 0.009700 <0.001000 <0.001000 <0.001000 0.001100 8/18/2016 0.01210 0.01250 <0.001000 <0.001000 <0.001000 <0.001000 9/19/2016 0.004500 0.01570 <0.001000 <0.001000 <0.001000 <0.001000 12/27/2016 0.004400 0.01310 <0.001000 <0.001000 <0.001000 <0.001000 3/16/2017 0.01530 0.009600 <0.001000 <0.001000 <0.001000 <0.001000 6/21/2017 0.004600 0.01270 <0.001000 <0.001000 <0.001000 <0.001000 7/28/2017 0.005700 0.008500 <0.001000 <0.001000 <0.001000 0.001500 MW-366 1/20/2016 0.0003000 0.07930 <0.001000 <0.001000 0.001000 <0.001000 3/23/2016 <0.001000 0.08270 <0.001000 <0.001000 <0.001000 <0.001000
1
MANAGES V 4.0.15691
Table 2. Baldwin Fly Ash Pond System: Appendix IV Analytical Results
Baldwin
11:27:44 AM
January 12, 2018
Sample Date Location IDF, tot, mg/L Hg, tot, mg/L Li, tot, mg/L Mo, tot, mg/L Pb, tot, mg/L Ra-226,228, tot, pCi/L
MW-304 12/29/2015 1.980 <0.0002000 0.05680 0.005200 <0.001000 0.0 3/21/2016 1.860 <0.0002000 0.05410 0.007600 <0.001000 0.0 6/21/2016 1.590 <0.0002000 0.05520 0.005800 <0.001000 0.4900 9/19/2016 1.660 <0.0002000 0.06930 0.006900 <0.001000 0.4900 12/27/2016 1.610 <0.0002000 0.06460 0.005300 <0.001000 0.1100 3/16/2017 1.660 <0.0002000 0.06850 0.008100 <0.001000 1.180 6/21/2017 1.840 <0.0002000 0.06500 0.003900 <0.001000 1.160 7/28/2017 1.750 <0.0002000 0.06500 0.003400 <0.001000 0.9900 MW-306 3/22/2016 0.8300 <0.0002000 0.03780 0.006700 <0.001000 0.3500 6/21/2016 0.6900 <0.0002000 0.02730 0.007200 <0.001000 1.140 8/18/2016 0.5400 <0.0002000 0.02020 0.01260 <0.001000 0.4900 9/19/2016 0.5500 <0.0002000 0.02010 0.01980 <0.001000 0.1200 12/27/2016 0.5800 <0.0002000 0.01600 0.02010 <0.001000 0.2100 3/16/2017 0.6100 <0.0002000 0.01700 0.01820 <0.001000 0.9000 6/21/2017 0.6200 <0.0002000 0.01570 0.02240 <0.001000 0.8900 7/28/2017 0.6000 <0.0002000 0.01590 0.02370 <0.001000 0.1400 MW-366 1/20/2016 0.9800 <0.0002000 0.02830 0.002000 <0.001000 0.7750 3/23/2016 1.020 <0.0002000 0.02830 0.001300 <0.001000 1.100
1
Table 2. Baldwin Fly Ash Pond System: Appendix IV Analytical Results
Baldwin
11:27:44 AM
January 12, 2018
Sample Date Location IDSb, tot, mg/L Se, tot, mg/L Tl, tot, mg/L
MW-304 12/29/2015 <0.001000 <0.001000 <0.001000 3/21/2016 <0.001000 <0.001000 <0.001000 6/21/2016 <0.001000 <0.001000 <0.001000 9/19/2016 <0.001000 <0.001000 <0.001000 12/27/2016 <0.001000 <0.001000 <0.001000 3/16/2017 <0.001000 <0.001000 <0.001000 6/21/2017 <0.001000 <0.001000 <0.001000 7/28/2017 <0.001000 <0.001000 <0.001000 MW-306 3/22/2016 <0.001000 <0.001000 <0.001000 6/21/2016 <0.001000 <0.001000 <0.001000 8/18/2016 <0.001000 <0.001000 <0.001000 9/19/2016 <0.001000 <0.001000 <0.001000 12/27/2016 <0.001000 <0.001000 <0.001000 3/16/2017 <0.001000 <0.001000 <0.001000 6/21/2017 <0.001000 <0.001000 <0.001000 7/28/2017 <0.001000 <0.001000 <0.001000 MW-366 1/20/2016 0.0008000 0.001100 <0.001000 3/23/2016 <0.001000 <0.001000 <0.001000
1
Table 2. Baldwin Fly Ash Pond System: Appendix IV Analytical Results
Baldwin
11:27:44 AM
January 12, 2018
Sample Date Location IDAs, tot, mg/L Ba, tot, mg/L Be, tot, mg/L Cd,tot, mg/L Co, tot, mg/L Cr, tot, mg/L
MW-366 6/22/2016 <0.001000 0.08170 <0.001000 <0.001000 <0.001000 <0.001000 9/20/2016 0.001300 0.1100 <0.001000 <0.001000 0.001400 <0.001000 12/22/2016 <0.001000 0.07620 <0.001000 <0.001000 <0.001000 <0.001000 3/15/2017 <0.001000 0.07640 <0.001000 <0.001000 <0.001000 <0.001000 6/20/2017 <0.001000 0.07700 <0.001000 <0.001000 <0.001000 <0.001000 7/26/2017 <0.001000 0.06960 <0.001000 <0.001000 <0.001000 <0.001000 MW-375 1/20/2016 0.001400 0.03030 <0.001000 <0.001000 <0.001000 <0.001000 3/23/2016 0.001400 0.02640 <0.001000 <0.001000 <0.001000 <0.001000 6/22/2016 0.001600 0.02470 <0.001000 <0.001000 <0.001000 <0.001000 9/20/2016 0.002500 0.03750 <0.001000 <0.001000 <0.001000 <0.001000 12/22/2016 0.002200 0.02390 <0.001000 <0.001000 <0.001000 <0.001000 3/16/2017 0.002000 0.02370 <0.001000 <0.001000 <0.001000 <0.001000 6/21/2017 0.002100 0.02500 <0.001000 <0.001000 <0.001000 <0.001000 7/28/2017 0.002100 0.02430 <0.001000 <0.001000 <0.001000 <0.001000 MW-377 1/19/2016 0.0009000 0.05800 <0.001000 <0.001000 0.0005000 <0.001000 3/23/2016 0.001700 0.06370 <0.001000 <0.001000 <0.001000 <0.001000 6/22/2016 0.001400 0.06630 <0.001000 <0.001000 <0.001000 <0.001000 9/21/2016 0.002000 0.07550 <0.001000 <0.001000 <0.001000 <0.001000
2
MANAGES V 4.0.15691
Table 2. Baldwin Fly Ash Pond System: Appendix IV Analytical Results
Baldwin
11:27:44 AM
January 12, 2018
Sample Date Location IDF, tot, mg/L Hg, tot, mg/L Li, tot, mg/L Mo, tot, mg/L Pb, tot, mg/L Ra-226,228, tot, pCi/L
MW-366 6/22/2016 0.8900 <0.0002000 0.02800 0.003700 <0.001000 0.1200 9/20/2016 0.9800 <0.0002000 0.03220 0.004300 <0.001000 0.4300 12/22/2016 0.9800 <0.0002000 0.03330 0.001400 <0.001000 1.330 3/15/2017 1.020 <0.0002000 0.03050 0.001100 <0.001000 1.170 6/20/2017 1.060 <0.0002000 0.03330 0.001600 <0.001000 0.8000 7/26/2017 1.040 <0.0002000 0.03270 0.001800 <0.001000 1.080 MW-375 1/20/2016 1.800 <0.0002000 0.04790 0.01560 <0.001000 0.4300 3/23/2016 2.100 <0.0002000 0.04200 0.01970 <0.001000 0.09000 6/22/2016 2.140 <0.0002000 0.04950 0.02210 <0.001000 0.0 9/20/2016 2.070 <0.0002000 0.06200 0.03430 <0.001000 0.7300 12/22/2016 2.270 <0.0002000 0.06190 0.03210 <0.001000 1.170 3/16/2017 2.360 <0.0002000 0.06000 0.03590 <0.001000 0.4600 6/21/2017 2.490 <0.0002000 0.06790 0.03370 <0.001000 1.350 7/28/2017 2.450 <0.0002000 0.06790 0.03240 <0.001000 0.3000 MW-377 1/19/2016 1.130 <0.0002000 0.04850 0.002300 <0.001000 0.09300 3/23/2016 1.120 <0.0002000 0.04500 0.002500 <0.001000 0.1500 6/22/2016 1.050 <0.0002000 0.05330 0.002100 <0.001000 0.3530 9/21/2016 1.060 <0.0002000 0.05780 0.003300 <0.001000 0.8600
2
Table 2. Baldwin Fly Ash Pond System: Appendix IV Analytical Results
Baldwin
11:27:44 AM
January 12, 2018
Sample Date Location IDSb, tot, mg/L Se, tot, mg/L Tl, tot, mg/L
MW-366 6/22/2016 <0.001000 <0.001000 <0.001000 9/20/2016 <0.001000 <0.001000 <0.001000 12/22/2016 <0.001000 <0.001000 <0.001000 3/15/2017 <0.001000 <0.001000 <0.001000 6/20/2017 <0.001000 <0.001000 <0.001000 7/26/2017 <0.001000 <0.001000 <0.001000 MW-375 1/20/2016 0.003100 0.002900 <0.001000 3/23/2016 0.001500 0.001600 <0.001000 6/22/2016 0.001500 <0.001000 <0.001000 9/20/2016 0.005000 <0.001000 <0.001000 12/22/2016 0.001500 <0.001000 <0.001000 3/16/2017 0.001300 <0.001000 <0.001000 6/21/2017 0.001300 <0.001000 <0.001000 7/28/2017 0.001200 <0.001000 <0.001000 MW-377 1/19/2016 0.0006000 <0.001000 <0.001000 3/23/2016 <0.001000 <0.001000 <0.001000 6/22/2016 <0.001000 <0.001000 <0.001000 9/21/2016 <0.001000 <0.001000 <0.001000
2
Table 2. Baldwin Fly Ash Pond System: Appendix IV Analytical Results
Baldwin
11:27:44 AM
January 12, 2018
Sample Date Location IDAs, tot, mg/L Ba, tot, mg/L Be, tot, mg/L Cd,tot, mg/L Co, tot, mg/L Cr, tot, mg/L
MW-377 12/22/2016 0.001500 0.06250 <0.001000 <0.001000 <0.001000 <0.001000 3/15/2017 <0.001000 0.06460 <0.001000 <0.001000 <0.001000 <0.001000 6/21/2017 <0.001000 0.06020 <0.001000 <0.001000 <0.001000 <0.001000 7/28/2017 <0.001000 0.06310 <0.001000 <0.001000 <0.001000 <0.001000 MW-383 1/21/2016 0.001400 0.03390 <0.001000 <0.001000 <0.001000 0.0006000 3/24/2016 0.001000 0.03200 <0.001000 <0.001000 <0.001000 <0.001000 6/23/2016 0.001100 0.03070 <0.001000 <0.001000 <0.001000 <0.001000 9/21/2016 0.001600 0.03600 <0.001000 <0.001000 <0.001000 <0.001000 12/27/2016 <0.001000 0.03100 <0.001000 <0.001000 <0.001000 <0.001000 3/16/2017 <0.001000 0.03240 <0.001000 <0.001000 <0.001000 <0.001000 6/19/2017 <0.001000 0.03610 <0.001000 <0.001000 <0.001000 <0.001000 7/26/2017 0.001300 0.03460 <0.001000 <0.001000 <0.001000 <0.001000 MW-384 1/21/2016 <0.001000 0.02210 <0.001000 <0.001000 <0.001000 0.0003000 3/24/2016 <0.001000 0.02450 <0.001000 <0.001000 <0.001000 <0.001000 6/23/2016 <0.001000 0.02820 <0.001000 <0.001000 <0.001000 <0.001000 9/21/2016 <0.001000 0.02580 <0.001000 <0.001000 <0.001000 <0.001000 12/27/2016 <0.001000 0.02750 <0.001000 <0.001000 <0.001000 <0.001000 3/16/2017 <0.001000 0.02830 <0.001000 <0.001000 <0.001000 <0.001000
3
MANAGES V 4.0.15691
Table 2. Baldwin Fly Ash Pond System: Appendix IV Analytical Results
Baldwin
11:27:44 AM
January 12, 2018
Sample Date Location IDF, tot, mg/L Hg, tot, mg/L Li, tot, mg/L Mo, tot, mg/L Pb, tot, mg/L Ra-226,228, tot, pCi/L
MW-377 12/22/2016 1.030 <0.0002000 0.05090 0.002200 <0.001000 0.6800 3/15/2017 1.080 <0.0002000 0.04880 0.001800 <0.001000 0.02000 6/21/2017 1.140 <0.0002000 0.05310 0.001400 <0.001000 0.3800 7/28/2017 1.120 <0.0002000 0.05320 0.001600 <0.001000 0.9600 MW-383 1/21/2016 0.8200 <0.0002000 0.03240 0.01280 0.0003000 0.08500 3/24/2016 0.8400 <0.0002000 0.03200 0.01350 <0.001000 0.1700 6/23/2016 0.8200 <0.0002000 0.03500 0.01310 <0.001000 0.1700 9/21/2016 0.8300 <0.0002000 0.04150 0.01760 <0.001000 1.460 12/27/2016 0.7900 <0.0002000 0.03640 0.01250 <0.001000 0.7100 3/16/2017 0.7600 <0.0002000 0.03400 0.01210 <0.001000 1.070 6/19/2017 0.8100 <0.0002000 0.03780 0.01090 <0.001000 0.1100 7/26/2017 0.8000 <0.0002000 0.03180 0.01770 <0.001000 0.9100 MW-384 1/21/2016 1.500 <0.0002000 0.03750 0.009000 <0.001000 0.6950 3/24/2016 1.430 <0.0002000 0.03670 0.01000 <0.001000 0.6300 6/23/2016 1.390 <0.0002000 0.04100 0.009300 <0.001000 0.9200 9/21/2016 1.480 <0.0002000 0.04400 0.01690 <0.001000 0.2500 12/27/2016 1.980 <0.0002000 0.03460 0.03280 <0.001000 0.3400 3/16/2017 2.100 <0.0002000 0.03490 0.01910 <0.001000 0.4400
3
Table 2. Baldwin Fly Ash Pond System: Appendix IV Analytical Results
Baldwin
11:27:44 AM
January 12, 2018
Sample Date Location IDSb, tot, mg/L Se, tot, mg/L Tl, tot, mg/L
MW-377 12/22/2016 <0.001000 <0.001000 <0.001000 3/15/2017 <0.001000 <0.001000 <0.001000 6/21/2017 <0.001000 <0.001000 <0.001000 7/28/2017 <0.001000 <0.001000 <0.001000 MW-383 1/21/2016 0.001400 0.001700 <0.001000 3/24/2016 0.001400 <0.001000 <0.001000 6/23/2016 0.001200 <0.001000 <0.001000 9/21/2016 <0.001000 <0.001000 <0.001000 12/27/2016 <0.001000 <0.001000 <0.001000 3/16/2017 <0.001000 <0.001000 <0.001000 6/19/2017 <0.001000 <0.001000 <0.001000 7/26/2017 <0.001000 <0.001000 <0.001000 MW-384 1/21/2016 0.0004000 <0.001000 <0.001000 3/24/2016 <0.001000 <0.001000 <0.001000 6/23/2016 <0.001000 <0.001000 <0.001000 9/21/2016 <0.001000 <0.001000 <0.001000 12/27/2016 <0.001000 <0.001000 <0.001000 3/16/2017 <0.001000 <0.001000 <0.001000
3
Table 2. Baldwin Fly Ash Pond System: Appendix IV Analytical Results
Baldwin
11:27:44 AM
January 12, 2018
Sample Date Location IDAs, tot, mg/L Ba, tot, mg/L Be, tot, mg/L Cd,tot, mg/L Co, tot, mg/L Cr, tot, mg/L
MW-384 6/19/2017 <0.001000 0.02770 <0.001000 <0.001000 <0.001000 <0.001000 7/25/2017 <0.001000 0.02640 <0.001000 <0.001000 <0.001000 <0.001000 MW-390 3/22/2016 <0.001000 0.03300 <0.001000 <0.001000 0.001900 <0.001000 6/23/2016 0.001300 0.02990 <0.001000 <0.001000 0.002300 <0.001000 8/18/2016 0.001900 0.02890 <0.001000 <0.001000 0.001300 <0.001000 9/20/2016 0.002000 0.02580 <0.001000 <0.001000 0.001200 <0.001000 12/22/2016 0.002100 0.02280 <0.001000 <0.001000 0.001100 <0.001000 3/15/2017 0.002000 0.05200 <0.001000 <0.001000 <0.001000 <0.001000 6/20/2017 0.001600 0.04000 <0.001000 <0.001000 <0.001000 <0.001000 7/28/2017 0.001400 0.03850 <0.001000 <0.001000 <0.001000 <0.001000 MW-391 12/22/2016 0.001700 0.02930 <0.001000 <0.001000 <0.001000 <0.001000 3/15/2017 0.001500 0.03320 <0.001000 <0.001000 <0.001000 <0.001000 6/20/2017 0.001700 0.03500 <0.001000 <0.001000 <0.001000 <0.001000
4
MANAGES V 4.0.15691
Table 2. Baldwin Fly Ash Pond System: Appendix IV Analytical Results
Baldwin
11:27:44 AM
January 12, 2018
Sample Date Location IDF, tot, mg/L Hg, tot, mg/L Li, tot, mg/L Mo, tot, mg/L Pb, tot, mg/L Ra-226,228, tot, pCi/L
MW-384 6/19/2017 1.500 <0.0002000 0.04040 0.01750 <0.001000 0.1300 7/25/2017 1.480 <0.0002000 0.03710 0.01570 <0.001000 0.5600 MW-390 3/22/2016 1.280 <0.0002000 0.03310 0.001700 <0.001000 0.2000 6/23/2016 1.360 <0.0002000 0.03860 0.005900 <0.001000 0.9000 8/18/2016 1.450 <0.0002000 0.04000 0.002900 <0.001000 0.8600 9/20/2016 1.440 <0.0002000 0.04930 0.003600 <0.001000 0.3900 12/22/2016 1.470 <0.0002000 0.04360 0.002600 <0.001000 0.6600 3/15/2017 0.8400 <0.0002000 0.02730 0.01320 <0.001000 1.580 6/20/2017 1.270 <0.0002000 0.04010 0.01030 <0.001000 0.1800 7/28/2017 1.190 <0.0002000 0.03750 0.01140 <0.001000 0.8600 MW-391 12/22/2016 2.560 <0.0002000 0.03200 0.07970 <0.001000 1.310 3/15/2017 2.650 <0.0002000 0.03550 0.08360 <0.001000 0.3700 6/20/2017 2.780 <0.0002000 0.04980 0.08600 <0.001000 0.7300
4
Table 2. Baldwin Fly Ash Pond System: Appendix IV Analytical Results
Baldwin
11:27:44 AM
January 12, 2018
Sample Date Location IDSb, tot, mg/L Se, tot, mg/L Tl, tot, mg/L
MW-384 6/19/2017 <0.001000 <0.001000 <0.001000 7/25/2017 <0.001000 <0.001000 <0.001000 MW-390 3/22/2016 <0.001000 0.001300 <0.001000 6/23/2016 0.001200 0.001300 <0.001000 8/18/2016 <0.001000 <0.001000 <0.001000 9/20/2016 <0.001000 <0.001000 <0.001000 12/22/2016 <0.001000 <0.001000 <0.001000 3/15/2017 <0.001000 <0.001000 <0.001000 6/20/2017 <0.001000 <0.001000 <0.001000 7/28/2017 <0.001000 <0.001000 <0.001000 MW-391 12/22/2016 0.001600 0.01660 <0.001000 3/15/2017 0.001700 0.01570 <0.001000 6/20/2017 0.001500 0.01540 <0.001000
4
O B G T H E R E ’ S A W A Y
BALDWIN FLY ASH POND SYSTEM
2017 ANNUAL GROUNDWATER MONITORING AND CORRECTIVE ACTION REPORT
"
D
"
D
"
D
"
D
"
D
"
D
"
D
"
D
"
D
WEST FLY
ASH POND
EAST FLY
ASH POND
OLD EAST FLY
ASH POND
MW-366 MW-384 MW-383 MW-304 MW-375 MW-377 MW-390 MW-391 MW-306 0 400 800
SCALE IN FEET
PROJECT NO: 67719
FIGURE NO: 1
"
D
DOWNGRADIENT MONITORING WELL LOCATION
"
D
UPGRADIENT MONITORING WELL LOCATION
CCR MONITORED MULTI-UNIT
CCR UNIT
G
RO
U
ND
W
AT
ER
S
AM
PL
IN
G
W
EL
L
LO
C
AT
IO
N
M
AP
BA
LD
W
IN
F
LY
A
SH
P
O
N
D
SY
ST
EM
M
UL
TI
-U
NI
T
ID
: 6
05
20
17
A
NN
UA
L
G
RO
UN
DW
AT
ER
M
O
NI
TO
RI
NG
A
ND
C
O
RR
EC
TI
VE
A
CT
IO
N
RE
PO
RT
DY
NE
G
Y
CC
R
RU
LE
G
RO
UN
DW
AT
ER
M
O
NI
TO
RI
NG
BA
LD
W
IN
E
NE
RG
Y
CO
M
PL
EX
BA
LD
W
IN
, I
LL
IN
O
IS
Y :\M ap pi ng \P ro je ct s\ 22 \2 28 5\ M XD \2 01 7_ An nu al G W M _C AR \F ig ur e 1_ G W S_ W el lL oc _B al dw in _O E. m xd Au th or : s to lz sd ; D at e/ Ti m e: 1 /2 9/ 20 18 , 3 :2 2: 12 P MService Layer Credits: Source: Esri, DigitalGlobe, GeoEye, Earthstar Geographics, CNES/Airbus DS, USDA, USGS, AeroGRID, IGN, and the GIS User Community
³
D
R
AW
N
B
Y/
D
AT
E:
SD
S
1/
17
/1
8
R
EV
IE
W
ED
B
Y/
D
AT
E:
KL
T
1/
17
/1
8
AP
PR
O
VE
D
B
Y/
D
AT
E:
SJ
C
1
/2
5/
18
KASKASKIA RIVER STATE FISH AND WILDLIFE AREA