MAdScope: Characterizing Mobile In-App Targeted Ads
Suman Nath
Microsoft Research
suman.nath@microsoft.com
ABSTRACT
Advertising is the primary source of revenue for many mo-bile apps. One important goal of the ad delivery process is targeting users, based on criteria like users’ geolocation, con-text, demographics, long-term behavior, etc. In this paper we report an in-depth study that broadly characterizes what targeting information mobile apps send to ad networks and how effectively, if at all, ad networks utilize the information for targeting users. Our study is based on a novel tool, called MAdScope, that can (1) quickly harvest ads from a large col-lection of apps, (2) systematically probe an ad network to characterize its targeting mechanism, and (3) emulate user profiles of specific preferences and interests to study behav-ioral targeting. Our analysis of 500K ad requests from 150K Android apps and 101 ad networks indicates that apps do not yet exploit the full potential of targeting: even though ad controls provide APIs to send a lot of information to ad networks, much key targeting information is optional and is often not provided by app developers. We also use MAd-Scope to systematically probe top 10 in-app ad networks to harvest over 1 million ads and find that while targeting is used by many of the top networks, there remain many instances where targeting information or behavioral profile does not have a statistically significant impact on how ads are chosen. We also contrast our findings with a recent study of targeted in-browser ads.
Categories and Subject Descriptors
C.4 [Performance Of Systems ]: [Measurement tech-niques]
Keywords
In-app Advertising; Mobile Advertising; Targeted Advertis-ing; User Profiles; Measurement
Permission to make digital or hard copies of all or part of this work for personal or classroom use is granted without fee provided that copies are not made or distributed for profit or commercial advantage and that copies bear this notice and the full cita-tion on the first page. Copyrights for components of this work owned by others than ACM must be honored. Abstracting with credit is permitted. To copy otherwise, or re-publish, to post on servers or to redistribute to lists, requires prior specific permission and/or a fee. Request permissions from permissions@acm.org.
MobiSys’15,May 18–22, 2015, Florence, Italy.
Copyrightc 2015 ACM 978-1-4503-3494-5/15/05 ...$15.00. http://dx.doi.org/10.1145/2742647.2742653 .
1.
INTRODUCTION
In-app advertising is a key economic driver in mobile app ecosystem, funding a wide variety of free apps. Gartner predicts the mobile ad market to grow to $13.5 billion in 2015 [9]. The growth is primarily due to increasing engage-ment of users with apps—users are reported to spend signif-icantly more time on mobile apps than on traditional web, and the gap is increasing [6].
Of central importance in the ad delivery process istargeting— the process of selecting specific ads to display to a given user of an app. In-appad controls, which fetch ads from backend ad networks and display them to users, target users based on criteria such as app type, device attributes (e.g., screen size), user’s long-term behavior, demographic, and geoloca-tion. The presumption is that targeting benefits all parties in the ad ecosystem: users, app developers, ad networks, and advertisers. Note that targeting is not unique to in-app ads; it has been successfully used for in-browser ads as well [1, 8, 11, 30].
Despite its importance, in-app ad targeting is relatively ill-explored (compared to its in-browser counterpart). Existing results on in-browser ads (e.g., [1,3,7,8,11,23,30]) cannot be directly generalized to in-app ads for several reasons. First, unlike in-browser ads that cannot easily access user infor-mation because of the same origin policy [29], in-app ads run with the same permission as the app itself, making it easier for ad controls to exfiltrate user information. There-fore some targeting information (e.g., user’s geolocation) is likely to be used more commonly by app ads than by in-browser ads, while some information (e.g., all or frequently used apps on the device) is unique to in-app ads. Second, ad controls often leave much targeting information optional to be provided by apps, and hence targeting behavior of even the same ad control may vary across apps depending on whether apps actually provide the optional targeting in-formation. Third, some ad networks and advertisers such as mobile marketplaces are unique or more common in in-app ads and their characteristics have not been investigated before. Finally, the methodology for harvesting in-app ads is significantly different from that for harvesting in-browser ads.
In this paper, we present a first-of-its-kind study of tar-geted display ads delivered to mobile apps. Our objectives are to broadly characterize in-app display advertisement and to understand targeting mechanisms employed by apps and ad networks from an empirical perspective. The study seeks to understand several key questions including the following:
networks? How effectively, if at all, do different ad networks utilize such information to target users? Do ad networks dif-ferentiate between different apps or different users using the same app, and if so by how much? What impact does tar-geting have on ad delivery process?
Answers to the above questions are important not just for a general audience inquisitive into in-app ad ecosystem, but also for two important constituents of the ad ecosystem: app developers and ad networks. An app developer can use the answers to guide his decisions on what ad networks to choose to effectively target users. He can also reduce the targeting information that the app needs to send to only the ones that influence targeting decisions, thereby reducing bandwidth and exfiltrated user data. An ad network can use the answers to find how often app developers provide a specific optional targeting information to other ad networks and how much targeting opportunity it currently misses by not supporting the targeting information.
An empirical study of in-app ad ecosystem is challenging for various reasons: The vast number of mobile apps that show display ads, the large number of ad networks that serve ads to mobile apps, the diversity and dynamics of targeting mechanisms across ad networks and users all present sig-nificant challenges. Our first contribution in this paper is a novel tool called MAdScope that can address these chal-lenges. Central to MAdScope are three key mechanisms to (1) quickly harvest ads from a large collection of apps, (2) systematically probe an ad network to characterize its tar-geting mechanism, and (3) emulate user profiles, i.e., inter-act with the ad ecosystem as if interinter-actions were by users of specific preferences and interests, in order to understand if an ad network does behavioral targeting. Various aspects of these mechanisms are inspired by recent works on profile-based ad crawling [1], differential correlation [16], and ad classification [27], but adapted to in-app ads. All these ca-pabilities are essential for understanding the full spectrum of targeting behavior of in-app ad ecosystem. We believe that MAdScope and its mechanisms will be valuable for future studies of in-app ad ecosystem as well.
Our second contribution is to characterize targeting be-havior of in-app ad ecosystem by using MAdScope. We first study what targeting information apps send to ad net-works. Our analysis of 500K unique ad requests harvested from 150K apps and 101 ad networks shows that apps do not yet exploit the full potential of targeting. Ad networks are aggressive in terms of allowing apps to provide targeting information of various categories: device, geolocation, de-mographic, keywords, and child flag—at least 76 of the 101 ad networks we studied can collect some of these informa-tion. However, much of the targeting information (41% on average per ad network) is left optional to developers, who do not often (in>90% of the apps) provide them. For 17% of the apps, ad networks receive no targeting information since they leave all targeting information as optional and apps/developers do not provide any of them.
We next investigate how effectively top 10 ad networks utilize various targeting information to target users. We con-sider bothattribute-based targetingthat targets users based on various attributes encoded in ad requests, and behav-ioral targetingthat targets based on user’s historical activi-ties. By analyzing over a million ad impressions, we found many instances where ad networks effectively utilize target-ing information and behavioral profiles to target users,
al-though the degree of utilization varies widely across net-works. Our results show that app ads differ from in-browser ads in multiple ways—in-app advertising employs significantly less behavioral and demographic-based target-ing but more location-based targettarget-ing, and it shows more entertainment-related ads.
Surprisingly, our study points out many instances where targeting information or behavioral profile does not have a statistically significant impact on how ads are chosen (within our observation window of one day). We are not certain why ad networks collect targeting information if not for selecting ads. Three plausible explanations for an ad network to col-lect such data could be: (1) forward-compatibility—the ad network wants keep the option open to select ads based on the information in future, and still be compatible to current or old versions of its ad controls used by existing apps, (2) backward-incompatibility—the targeting information is no longer used by the ad network but is still provided by old versions of its ad control, and (3) information brokerage— the ad network sells the information to other parties.
We would like to contrast our work with existing works on in-app ads. Most of the prior work has demonstrated the large extent to which apps are capable of collecting user’s personal information and the potential implications to user’s privacy [12, 17, 20, 24, 26] and device resources [4, 15, 19, 28]. These works do not investigate user targeting. A recent work [27] investigates targeting, but in a limited scale and scope—it shows various categories of targeted ads shown to 100 apps by one ad network, but does not characterize how apps use optional targeting information and how effec-tively ad networks utilize targeting information and behav-ioral profile. To the best of our knowledge, no prior work investigates the key questions we investigate in the context of in-app ads.
In the rest of the paper, we first discuss backgrounds and challenges of measuring in-app ads in Section 2. We then describe MAdScope’s mechanisms and our results charac-terizing apps (Section 3) and ad networks (Section 4) from targeting point of view. We also contrast our findings with a recent study on in-browser ads in Section 5). Finally we discuss related works in Section 6) and conclude in Section 7.
2.
BACKGROUND AND GOALS
2.1
In-app Ads
To display ads from a third-party mobile ad network such as AdMob1and MobClix2in an app, the app developer first registers with the ad network. The ad network provides the developer with an ad control (i.e. a library with some visual elements embedded within) that he includes in his app and assigns some screen “real estate”. When a user runs the app, the ad control fetches ads from the ad network and displays it to the user. As mentioned in Section 1, unlike in-browser ads, in-app ads run with the same permission as the app itself.
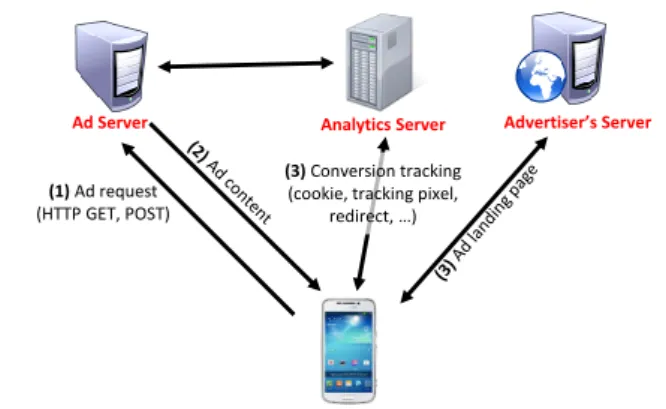
The ad ecosystem consists of multiple entities including advertisers, ad agencies and brokers, ad networks, apps, and app users. Figure 1 shows a generic workflow of a mobile app requesting an ad and actions resulting from a click on the ad. First, ad control in the app requests for an ad from
1http://www.google.com/ads/admob 2
(1)Ad request (HTTP GET, POST)
(3)Conversion tracking (cookie, tracking pixel,
redirect, …)
Ad Server Analytics Server Advertiser’s Server
Figure 1: In-app ad serving workflow.
ad network. Second, the ad server serves an ad with as-sociated contents, which the ad control displays in the app. The ad server may collect the ad offline from various brokers and ad agencies, or in real time from ad auction networks. Third, a click on the ad initiates connections to an ad ana-lytics server, which tracks ad conversions, and to advertiser’s server, which serves the landing page of the ad. Depending on the ad control, the click may generate only one connection to the analytics server, which can redirect the connection to the landing page.
I Targeting. An ad request, which is typically an HTTP GET or POST method, may include various targeting at-tributes such as app name, device properties, user’s location, demographic, etc. An ad network can use these information to select targeted ads for the user. While some targeting in-formation is automatically collected and sent by the ad con-trol, some others are optionally provided by apps/developers (through ad control APIs). Targeting can also be based on a user’s long-term behavior such as the types of apps he uses and the types of ads he clicks on. The ad server can obtain such statistics from analytics servers and maintain it for each user as hisprofile.
2.2
Goals
Our goal is to broadly characterize behavior of two im-portant parties in mobile in-app ad ecosystem: apps and ad networks, and to understand their targeting mechanisms from empirical perspective. There are two key aspects of such understanding.
IClient-side behavior. What various targeting informa-tion do mobile apps send to ad networks? The goal is differ-ent from that in prior work [12, 26] that demonstrated, by analyzing ad controls, the large extent to which ad controls arecapable ofcollecting user’s personal information. Actu-ally sending some of the information to ad networks, how-ever, is often left optional to apps— depending on how app developers customize their use of ad controls within apps, some of the personal information the ad controls are ca-pable of collecting may or may not actually be sent to ad networks. For example, AdMob, the most popular ad con-trol in our datasets, allows apps to optionally send user’s current location and demographic information such as his age and gender. How often apps actually send such infor-mation require analyzing ad requests made by apps—mere examination of individual ad controls is not sufficient.
Answer to the above question will illustrate the actual usage of these optional targeting information—whether de-velopers really care about targeting users, whether they take additional efforts to provide these optional targeting infor-mation despite runtime overhead and privacy implications [12, 26], and if they do, what type of targeting information apps actually send to ad networks.
I Ad network behavior. Even if specific targeting infor-mation, such as a user’s geolocation, is sent to ad networks, do the networks actually use the information for targeting users? If they do, how much do they rely on specific target-ing information in selecttarget-ing ads for a user? Answers to these questions can be useful for developers in choosing the right ad network and understanding whether it is worth providing optional targeting information. For example, as our results in Section 4 show, not all ad networks that collect geoloca-tion actually use it to target users. Based on the results, a developer who wishes to show location-based ads in his app can choose an ad network that actually utilizes geolocation to target users. On the other hand, if the developer decides to use an ad network that can accept user’s geolocation as an optional attribute but does not utilize the information for targeting users, he can choose not to provide the infor-mation to reduce exfiltrated user data, access permissions, and development and runtime overhead.
To the best of our knowledge, no previous works try to an-swer the above questions for mobile in-app ads. Anan-swering the questions is challenging due to the following reasons.
2.3
Challenges
I Scalability. To understand what targeting information apps send to ad networks, we need to analyze a large enough sample of ad requests from real apps. One obvious way to collect such data is to capture app traffic in large net-work providers [28], but this requires access to such netnet-work providers. Another option is to recruit real users and to cap-ture their ad traffic [27], but this is hard to scale to a large number of apps. Another option, which we explore in this paper, is to use an automation tool to automatically execute apps and to capture their ad traffic [18,22]. Correctness and scalability of this approach, however, hinge upon answering several non-obvious questions: Does poor coverage of exist-ing automation tools introduce any bias to collected sample of ads requests? How long do we need to run an app to capture all its ad requests?
IBlack-box ad networks. Without knowing internal tar-geting algorithm of an ad network, we need to characterize its targeting mechanism only from its externally observable behaviors. Passively monitoring ad requests and fetched ads from existing apps may not be sufficient for this purpose. For example, to determine if an ad network targets users based on their locations, we need to compare ads from requests (1) with and without location information, (2) without any other optional targeting information (to isolate the impact of location), and (3) with the same mandatory information (e.g., IMEI number). The available sample of ad requests may not contain requests satisfying all these criteria. For instance, if all available ad requests to an ad network con-tain location information, we cannot know how the network would behave with a request without location information. Moreover, there are many variabilities such as available ad inventory and time of day that can affect targeting behav-ior of ad networks. One must use sound statistical tools to
derive meaningful conclusions in the presence of such vari-ability.
I Profile-based targeting. Behavioral targeting of dis-play ads on the Web utilizes user’s long term behavioral pro-files [1] such as the sites he visits and the ads he clicks on. To study such targeting for in-app ads, we need to mimic multi-ple user profiles and study how ad networks target different profiles. For scalability, the profiles need to be built auto-matically. This can be tricky due to aclick-contamination problemdiscussed in Section 4. For instance, to automat-ically build a profile of a “sports-loving” user, we need to automatically click on all and only sports-related ads. To automatically determine if an ad is about sports, we often need to analyze its landing page, which may be determined only after clicking the ad. If the ad is not about sports, this click can contaminate the “sports-loving” profile.
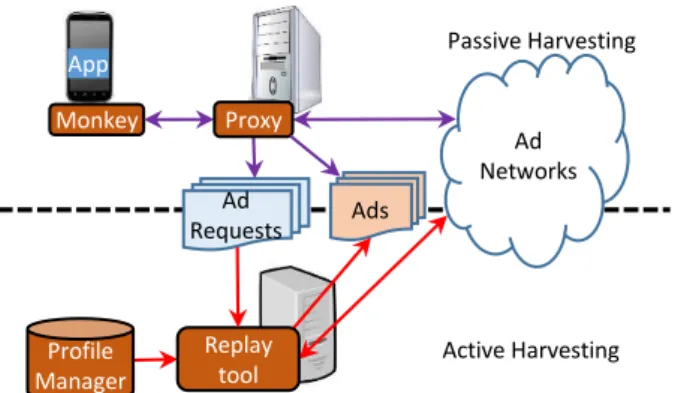
In this paper we address these challenges with a novel tool called MAdScope and use it later in the paper to understand targeted ads within mobile apps. At a high level, MAdScope has two functionalities (Figure 2): (1) passively harvesting ads from existing apps; we use this to understand what tar-geting information is sent to ad networks, and (2) actively probing ad networks; we use this to characterize targeting behavior of ad networks. We describe them in more detail in next two sections.
3.
CHARACTERIZING CLIENT BEHAVIOR
WITH PASSIVE AD HARVESTING
3.1
Passive Ad Harvesting in MAdScope
MAdScope harvests ad requests and impressions by run-ning unmodified apps on a mobile device. To harvest ads (ad requests and corresponding responses) from an app, it launches the app on a mobile device, navigates to its pages, and captures ads shown in those pages with a network sniffer that runs on the same device or at a proxy sitting between the device and the Internet. The sniffer or the proxy cap-tures all network traffic to and from the device, from which ad requests/responses are identified by looking for specific ad signatures (See MadFraud [5] for a principled approach of identifying ad requests from apps).
A recent work [27] used a similar methodology to harvest ads shown in 100 apps, but relied on humans to run the apps. Using human is not scalable. Since our goal involves ads from a large number of apps, MAdScope avoids the above scalability bottleneck by using aMonkey: a UI automation tool that can automatically launch an app in a real device and navigate through its pages by interacting with it, e.g., by clicking buttons, filling out text fields, swiping panels, etc. Previous work used Monkeys for various applications including app testing [22], ad frauds detection [5, 18], secu-rity bug detection [2], etc.
As mentioned before, one of our goals is to study what tar-geting information are sent to ad networks via ad requests. For our results to be sound, they need to be based onallor
an unbiased sampleof ad requests issued by a large sample of apps. All unique ad requests of an app can be collected by an ideal Monkey capable of visiting all runtime states (e.g., pages) of the app and thus triggering all ad requests the app can make. In practice, however, Monkeys have poor coverage. For instance, a Monkey may fail to visit some pages that can only be accessed by providing a correct
user-App Ad Networks Ad Requests Ads Monkey Replay tool Proxy Profile Manager Active Harvesting Passive Harvesting
Figure 2: MAdScope architecture. Top half involves passive ad harvesting (Section 3), while the bottom half involves active ad harvesting (Section 4).
name/password combination not known to the Monkey and hence miss the ad requests issued in those pages. (See [2] for a list of other reasons why a Monkey can have poor cov-erage.) If the missed ad requests are significantly different from the harvested ones, in terms of what targeting informa-tion is being sent out, the harvested sample can be a biased one. The amount of time a Monkey is given to explore an app can also affect the quality of harvested ad request sam-ple: a longer exploration time may yield more ad requests, but at the cost of fewer explored apps within a given time. Therefore, before we analyze the ad requests collected by a Monkey, we need to first understand whether the ad re-quest samples we collect are biased due to (a) poor coverage of the Monkey and (b) limited exploration time. We now investigate them empirically.
3.1.1
Understanding Ad Harvesting
To understand how apps make ad requests, we run top 3,000 ad-supported free Android apps in the Google Play market with a combination of human and an existing Mon-key tool called PUMA [14]. We configured PUMA to launch each app on a Nexus 5 smartphone and to navigate through various app pages for at most 20 minutes per app. For around 700 apps, PUMA had low coverage—it explored fewer then 10 unique pages per app as the apps required login passwords and/or had custom controls that PUMA failed to interact with. We manually ran those apps (e.g., by supply-ing user name and password) to make sure that at least 10 or all unique pages are explored for each app. All network traf-fic to/from the device was captured with a proxy, where we identified ad requests by using techniques described in [5]. We harvested ad requests from a total of 31,203 unique app pages.
I Observation 1. Most apps make the first ad request during launch time.
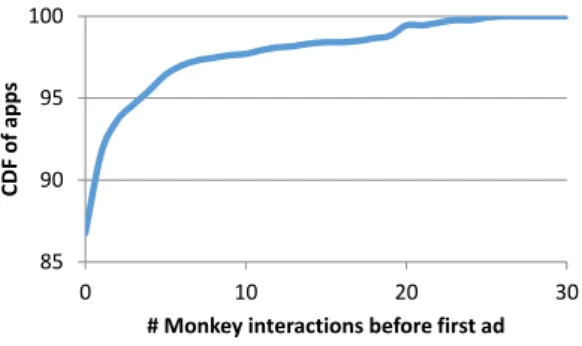
Figure 3 shows the CDF of apps and the number of in-teractions PUMA made before an app issued its first ad request. As shown, for 81% of the apps, PUMA had to sim-ply launch the app and make no interactions at all. These apps make ad requests during launch time so that the ads can be displayed on the first app page as soon as possible. Moreover, only 5 interactions were sufficient to harvest ad requests from>95% of the apps, suggesting that even a ba-sic Monkey that can interact with an app in a limited way
85 90 95 100 0 10 20 30 CD F of ap p s
# Monkey interactions before first ad
Figure 3: CDF of app count and number of Monkey interactions required to observe the first ad. No interaction is needed for 81% of the apps.
is able to capture first ad requests from a large fraction of apps.
I Observation 2. For most apps, the first ad request is similar to all its ad requests.
Let us first explain how we define two ad requests to be similar. A typical ad request is an HTTP GET or POST method call, consisting of a request page address (a host name and a path) and a query string with multiple attribute-value pairs separated by the ’&’ symbol. Attributes in a query string are eithervariableorinvariant, depending on whether their values change or remain constant in two back-to-back ad requests from the same app page, over all apps.3
For example, a timestamp attribute and a sequence number attribute are variable, while an IMEI number and a pub-lisher ID are invariant. We consider two ad requests to be similar if they have the same request page address and the same values of invariant attributes. Intuitively, two simi-lar ad requests convey the same or very simisimi-lar targeting information.
Our results show that for 94.7% of the apps, the first ad request an app makes is similar to its subsequent requests.4 Note that many of these apps required login and password and we had to manually run them to explore them well. We did not observe any instance where ad requests differ before and after user login. For 4.2% apps, subsequent ad requests differ from their first requests by only one attribute (e.g., FirstPage=true in first request and false in subsequent ones) and hence can be constructed from their first requests. Only≈1% apps issue multiple different ad requests in dif-ferent pages. Manual inspection reveals that these apps use keyword-based targeting and send different targeting key-words in different pages based on their contents.
3.1.2
Passive Harvesting in MAdScope
Insights from the above results guide us to the following scalable ad harvesting strategy in MAdScope: it launches an app and explores it with PUMA only until the app issues the first ad request or PUMA fails to explore further. We claim that the strategy yields:
3Note that attribute-value pairs encrypted with random
salts look random. The above definition would treat such attributes as non-invariant, even if their unencrypted values are the same.
4Ad impressions returned by these similar requests, however,
can be different. Ad domain Frequency doubleclick.net 36% mobclix.com 22% appsgeyser.com 12% adsmogo.com 12% wapx.cn 3.8% nend.net 1.1% mopub.com 0.9% mobfox.com 0.8% applovin.com 0.7% airpush.com 0.7%
Table 1: Top ten ad domains in the datasets.
• Unbiased sample of ads: Poor coverage or limited exploration time of PUMA does not introduce any sig-nificant bias on the harvested sample of ad requests. As Observation 1 shows, even if it explores zero or very small number of app pages, it still can harvest ad re-quests from most apps. Moreover, as Observation 2 shows, collecting only one ad request per app is suf-ficient, since that represents allad requests made by 99% of the apps (i.e., not many unique ad requests are missed from unexplored pages).
• Scalable harvesting:As Observation 1 shows, MAd-Scope needs to make a small number of interactions to harvest its ad, enabling it to quickly harvest ads from a large number of apps. In our experiments, we could harvest ads from around 4000 apps per device per day.
3.2
Empirical Results
3.2.1
Datasets and Basic Statistics
We use the following two datasets:
Dataset 1. This dataset contains 211,231 unique ad re-quests collected by MAdScope from 22,324 most popular free apps in Google Play market.
Dataset 2. The dataset is shared by the authors of the MadFraud system [5]. It consists of ad requests from 130,339 Android apps, selected randomly from a pool of 669,591 apps authors crawled from 19 markets including Google Play. Un-like Dataset 1, this dataset contains only ad requests that apps made during launch time: each app is launched, kept running for 60 seconds without any user interaction, and ads are captured. It consists of 353,181 unique ad requests. Note that, due to our Observation 1 and Observation 2, this dataset represents an almost unbiased sample of ad requests. Overall, both the datasets contain∼500K unique ad re-quests from ∼150K apps. They contain 143 unique ad re-quest pages from 101 unique top level ad network domains. Table 1 shows ten most frequent top level domains appearing in the ad requests.
3.2.2
How much information is sent to ad networks?
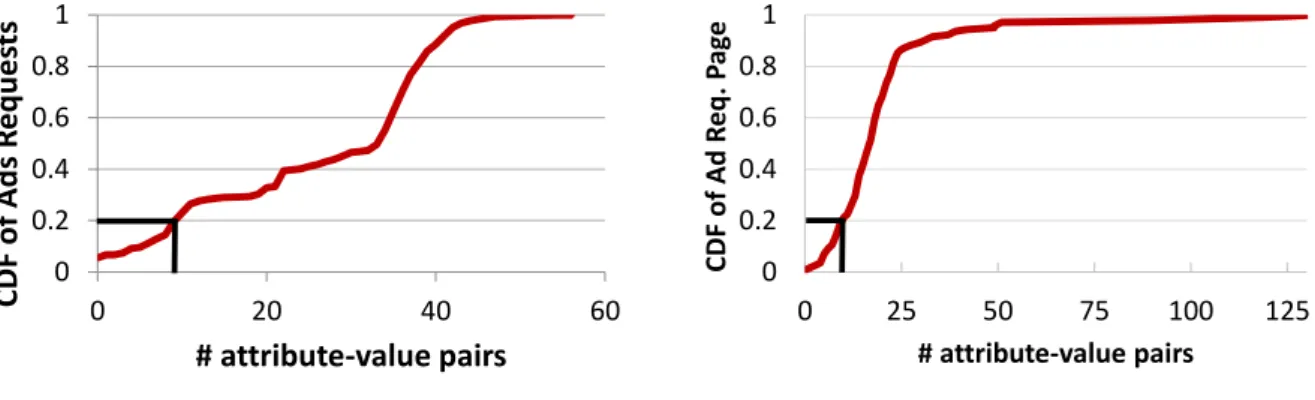
To approximate the magnitude of information sent by apps to ad networks, we count the number of attribute-value pairs in each ad request. Figure 4(a) shows the cumulative distributions of the number of attribute-value pairs in all ad requests. As shown, ad requests contain a large num-ber of attribute-value pairs: 26.3 pairs on average per
re-0
0.2
0.4
0.6
0.8
1
0
20
40
60
CDF o
f
Ad
s
R
e
q
u
e
sts
# attribute-value pairs
0
0.2
0.4
0.6
0.8
1
0
25
50
75
100
125
CDF
o
f Ad
R
eq.
P
ag
e
# attribute-value pairs
(a) Attr-value pairs in ad requests (b) Attr-value pairs in request pages
Figure 4: CDF of the number of attribute-value pairs appearing (a) in all ad requests and (b) in all ad request pages. >80% of ad requests and>80% of ad request pages contain>10attribute-value pairs.
quest. More than 80% of all ad requests contain more than 10 attribute-value pairs.
We also aggregate the counts per ad request page ad-dress: for each address, we take union of all attribute-value pairs that appear in any ad request to that address and count them. Figure 4(b) shows the CDF of the number of attribute-value pairs of all 143 ad request pages in our datasets. Overall, ad networks are aggressive in collecting various attributes. The average number of attribute-value pairs per ad request page address is 20.4, with>80% of the ad request pages supporting>10 attribute-value pairs.
The results above demonstrate that ad networks are ag-gressive in collecting a large number of attributes via ad re-quests. Note that many of the attributes are automatically collected by ad controls (and hence are transparent to devel-opers), while others are left optional to developers who need to explicitly provide their values. Moreover, not all these attributes are relevant to targeting users. We characterize these aspects next.
3.2.3
Mandatory and Optional Attributes
We define an attribute to be mandatory for a request page address if it appears inallad requests to that page address from all apps; otherwise, the attribute is optional. The in-tuition is that if an attribute is optional, then it is highly likely forsomedevelopers to not use it and hence ad requests from their apps to not include the attribute. For example, the ad control requesting ads fromgoogleads.g.doubleclick. com/mads/gmaallows developers to explicitly provide value of the optional attributecust_age; however, only a subset of the developers actually provide the attribute value. One limitation of this classification is that a mandatory attribute will deem optional if it does not appear inallversions of the ad control. For instance, if a mandatory attribute is intro-duced in a later version of the ad control, all ad requests from the latest version of the ad control will have the attribute, while none from an earlier version will have it.
We observed that, surprisingly, a large fraction (55%) of attributes are optional. On average, each ad request page address has 9.1 mandatory attributes and 11.3 optional at-tributes.
The result highlights the significance of our data-driven analysis of ad clients. By manually examining the usage of an ad client (as in previous works [12, 26]), one could
iden-Category Example values
Location Latitude and Longitude, City, Zipcode Keywords Keywords
Device IMEI number, MAC address, Android ID, IP address, CPU speed, RAM size, Screen size, Device model, Carrier name Demographic Age, Gender, Language
Child flag True/False
Table 2: Targeting attribute categories and values.
tify extent to which ad clients are capable of collecting user’s personal information. But since a large fraction of such in-formation is optional, this gives only the upper bound, not the actual magnitude, of information leak. In contrast, ex-amining ad requests from real apps gives the true magnitude of the information being sent to ad networks.
3.2.4
Identifying Targeting Attributes
To analyze targeting behavior, we must first identify var-ious targeting information that are sent from apps to ad networks in ad requests. In other words, we need to identify which attributes in an ad request contain targeting informa-tion. Since there are many ad providers for Android (101 in our datasets), it would be prohibitive to manually reverse engineer each ad provider’s ad serving protocol to determine which attributes in an ad request correspond to what tar-geting information. Instead, we develop a semi-automated method for such identification purely based on ad requests appearing in our datasets.
Our method consists of two steps. First, we keep only the attributes that satisfy either of the two criteria (and discard the others): (1) the attribute contains a relatively small number (we used a threshold of five) of distinct values in the entire datasets, or (2) its values are English words. Intuitively, since the ad requests in our datasets are har-vested from a small set of similarly configured identical de-vices from the same location, a targeting attribute should contain one or a very small number of values across all re-quests. For example, if the apps are all run from the same location, a location attribute should always have the same value. Attributes containing English words include
target-0 5 10 15 20 1 12 23 34 45 56 67 78 89 1 0 0 1 1 1 1 2 2 1 3 3 # at tr ibute -v al ue pa ir s
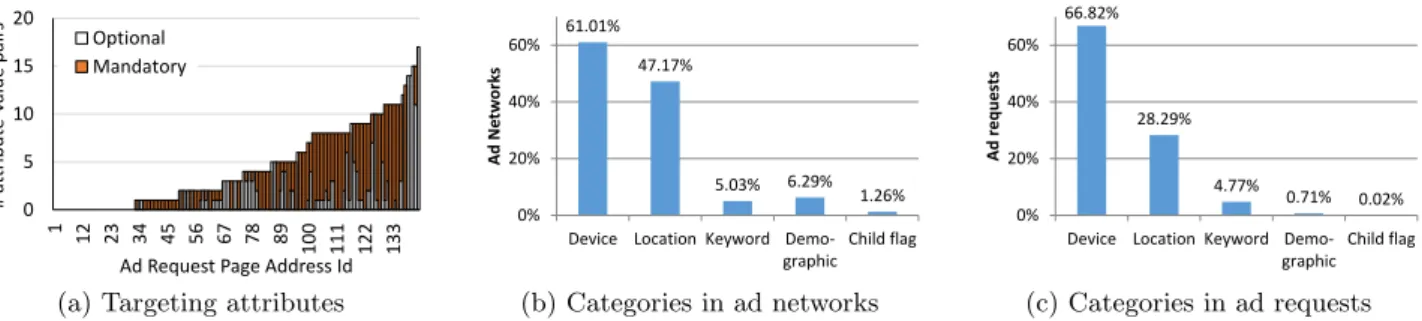
Ad Request Page Address Id Optional Mandatory 61.01% 47.17% 5.03% 6.29% 1.26% 0% 20% 40% 60%
Device Location Keyword Demo-graphic Child flag Ad Ne tw or ks 66.82% 28.29% 4.77% 0.71% 0.02% 0% 20% 40% 60%
Device Location Keyword Demo-graphic Child flag Ad r equ es ts
(a) Targeting attributes (b) Categories in ad networks (c) Categories in ad requests Figure 5: (a) shows distribution of identified mandatory and optional targeting attributes in all ad networks.
A significant number of targeting attributes are optional(b) and (c) show frequencies of various categories of
targeting attributes in all ad networks and in all ad requests, respectively.
ing keywords. The process discards attributes with arbitrary values such as timestamps or hashed values.
Second, for each of the remaining attributes, we manually inspect its name and values in our datasets and identify if the name and values are semantically meaningful (for exam-ple,cust_gender=malehas a semantically meaningful inter-pretation butq3=5does not). We select all attributes with meaningful interpretation. Note that the first step discards attributes that are unlikely to have meaningful interpreta-tion, and thus reduces laborious manual effort. Finally the selected attributes for each request page are categorizes into five different categories: Location, Keywords, Device, De-mograhic, and Child Flag. Example values of attributes of these categories are shown in Table 2.
I Targeting Dictionary. The targeting attributes, their categories, and whether they are mandatory or optional are encoded in MAdScope as aTargeting Dictionary. This is a static dictionary that maps each ad request page address to a set of targeting attributes that may appear in corresponding query strings and whose semantics are known. For instance, for the ad request page addressgoogleads.g.doubleclick.com/ mads/gma, the dictionary contains the information that the attributecust_ageis optional and its value is age of the user in plain text. MAdScope uses this dictionary for systemat-ically probing various ad networks to learn their targeting behavior (Section 4).
Our datasets contain 143 unique request page addresses and 2921 unique attributes for these requests. By using the above methodology, we could recognize 626 targeting at-tributes (21% of the unique atat-tributes). Note that the above methodology may miss some targeting information sent by an app, e.g., when they are sent as hashed or encrypted val-ues or codes (e.g., “v=1“ instead of “gender=male”). There-fore our results on extent of targeting is actually a lower bound.
3.2.5
Targeting Attribute Counts
Figure 5(a) shows the distribution of identified targeting attributes in all ad request page addresses. (Page addresses are sorted based on increasing order of the number of iden-tified targeting attributes.) 112 of total 143 ad request page addresses contain at least one targeting attributes. On av-erage, each address contains 4.4 targeting attributes.
Figure 5(a) also distinguishes between mandatory and op-tional targeting attributes. On average, 41% of targeting at-tributes are optional—there are 1.8 optional and 2.6 manda-tory targeting attributes per ad request page address. The
0% 20% 40% 60% 80% 100%
Device Location Keyword Demo-graphic Child flag Ad r equ es ts
Used Not used
Figure 6: Frequencies of ad requests that do not use a category of targeting attributes even though the ad network support that category.
high fraction of optional targeting attributes, again, high-lights the importance of data-driven analysis of ad clients.
We also categorize targeting attributes into various cate-gories shown in Table 2. Figure 5(b) and (c) show distri-butions of various categories of targeting attributes in all ad request page addresses and in all ad requests, respec-tively. As shown, two most common categories of attributes are device-related attributes such as IMEI number or de-vice Android ID and location attributes such as latitude and longitude. Keyword-based (also known as contextual) and demographics-based targeting is less common. Few ad net-works collect a child flag, to serve child-appropriate ads.
3.2.6
Omission of Optional Attributes
Figure 6 shows how often apps/developers actually pro-vide the optional targeting attributes of various categories. As shown, a large fraction of the ad requests do not include attributes of a targeting category even though their ad net-works support that category. For instance, 65% of the ad requests do not provide location attributes even though their ad networks allow location attributes. The fractions of ad requests not utilizing the opportunity of providing targeting attributes are higher (> 90%) for other categories, except for the Device category that is often automatically collected by ad controls. A developer may omit providing an optional attribute for many reasons: to reduce exflitrated user infor-mation, to avoid asking for additional permission (e.g., for location attribute), to avoid additional programming efforts
to include the attribute, to avoid runtime overhead of send-ing additional attributes over the network, or even due to his lack of awareness of the targeting attribute.
A few ad networks leave all targeting information op-tional. For 17% of ad requests in our datasets, correspond-ing ad networks do not receive any targetcorrespond-ing information since they leave all targeting information as optional and apps/developers do not provide any of them.
3.2.7
Static Targeting Attributes
Some targeting attributes such as location are usually specified dynamically, e.g., based on user’s current geoloca-tion. Interestingly, we observed that some developers spec-ify some of the attributes statically. For example, the app Virtual Table Tennis 3Drequests ads fromad.where.com, withcity=ADELAIDEirrespective of the user’s current loca-tion. Similarly, we observed a few apps requesting ads from
doubleclick.net by setting Age=10 and Gender=female. We suspect that most users of these apps are kids and girls, and without an easy way to determine the true age/gender of the users, app developers statically target the dominant user group.
To quantify such static targeting attributes, we counted all ad requests that specify location or demographics different from the Monkey’s profile. We found that at least 3.3% of all ad requests contain one or more such statically defined attribute values.
4.
CHARACTERIZING AD NETWORKS WITH
ACTIVE AD HARVESTING
The goal of active probing in MAdScope is to issue ad requests to a target ad network, with carefully chosen com-binations of targeting attributes and values, in order to fa-cilitate understanding of targeting mechanism of the ad net-work. For instance, to understand how much an ad network targets users based on their locations or whether its ad serv-ing rate changes when targetserv-ing is enabled, we would like to compare responses from many ad requests without location and with various locations. MAdScope’s active probing can issue such customized ad requests. Similarly, to understand if an ad network does behavioral targeting, we would need to build long term behavioral profiles and compare ads re-ceived by various profiles. MAdScope can build such profiles and issue ad requests from them.
One way to issue customized ad requests is to build a custom app with the desired ad control and to customize it with various optional attributes (such as location). However, this allows only to customize the parameters that ad controls allow developers to set; other parameters that ad controls collect automatically (such as Android ID or IMEI number, or location for some ad controls) cannot be customized.
To address this, MAdScope relies on modifying and re-playing passively harvested ad requests. This is supported by the following two observations.
I Observation 3. A passively harvested ad request can be replayed later to harvest more ads.
I Observation 4. Targeting attributes in ad requests can be modified before replaying.
To validate Observation 3, we selected a sample of 50 ran-dom apps. For each app, we performed the following three tasks until we got 100 ads from each: (1) launched the app on a mobile device and kept it running while it made
peri-odic ad requests; (2) issued the first ad request of the app (passively harvested as described before) each time the app requested an ad in task 1, from a replay tool running on a desktop PC; (3) replayed the ad request 100 times after a week. We also wrote parsers for the ads returned by these requests, to determine if responses from the ad requests were valid.
We observed that all replay requests (including the ones replayed a week later) returned valid ads and on average, the overlap between ads received by apps and real-time replay was > 82%. This implies that ad networks treat requests from the app and from the replay tool in a similar way. This also suggests that passively harvested ad requests can be quickly replayed from multiple desktops to harvest a large number of ads.
Observation 4 is motivated by the fact that most targeting attributes appear in plain text in ad requests. Ad providers do not typically encrypt ad requests because of the extra overhead that is required on the ad server to support a large number of SSL connections [26]. To validate Observation 4, we took ad requests from the previous experiment. For each ad request, we created a modified request by changing the value of one random targeting attribute, or dropping it if the attribute is optional. For example, if the original request containsgender=male, the modified request contained gen-der=female. We then replayed both versions of the requests 50 times each and observed that ad networks responded to the modified requests with valid ads (i.e., they could be suc-cessfully parsed), validating Observation 4.
4.1
Active Probing in MAdScope
Figure 2 shows the overall architecture of MAdScope and its active probing components. The key component is a re-play tool that uses insights from the above results to actively probe an ad network: It starts with ad requests passively harvested from real apps, selectively modifies various tar-geting attributes in the HTTP GET/POST requests, replays the modified HTTP requests with the same request header as the original ad request, and analyzes the responses (i.e., ads). What attributes in ad requests are modified depends on what targeting behavior to emulate.
Other than these basic components, MAdScope has sev-eral additional components that are crucial for understand-ing ad targetunderstand-ing. They involve how ad networks are probed, how targeted ads are identified, and how ads are classified. We describe them next, starting with the probing mecha-nism to understand targeting.
4.1.1
Probing for Attribute-based Targeting
From MAdScope’s perspective, there are two broad cat-egories of targeting. Attribute-based targeting is stateless where ad networks select ads solely based on various attribute-values within ad requests. Examples include targeting based on keywords (contextual ads), location, demographic infor-mation encoded in ad requests. Behavioral targeting, on the other hand, is stateful where ad networks select ads based on historical behavior of the user, e.g., what types of ads he clicked on and what types of apps he used in the recent past. We start with attribute-based targeting.
To construct ad requests with targeting enabled for cate-gory C to an ad networkN, MAdScope samples an ad re-quest toN from its passively harvested pool of ad requests. It then consults its targeting dictionary to identify
target-ing attributes of categoryCin the request and discards any other optional targeting attributes from it (to isolate the im-pact ofC from other targeting categories). Finally it enu-merates a few values ofC, possibly sampled from passively harvested ad requests, and for each value, it produces one modified ad request by setting the attribute of categoryC
to that value (other attributes keep the same value across all requests). The ad requests are then replayed by MAdScope. To avoid any potential impact of behavioural targeting based on device ID, different ad requests are issued with different device IDs.
For instance, to construct ad requests toadfonic.netwith location-based targeting enabled, MAdScope samples an ad request with hostname adfonic.net from its passively har-vested pool of ad requests. Using the targeting dictionary described in Section 3.2.4, it identifies location attributes u.latitude,u.longitude, andu.postalCodeand discards other optional targeting attributes such asu.gender,u.ageLow, and u.ageHigh from the request. It then produces multi-ple requests by setting values of location attributes to lati-tude/longitude and postal codes of top US cities.
In a very small number of cases, however, we found that targeting values (e.g., location in ad requests togoogleads. g.doubleclick.net) appear encrypted or hashed. For them, MAdScope uses encrypted/hashed targeting values from its passively harvested request pool. For example, to harvest encrypted location values forgoogleads.g.doubleclick.net, MAd-Scope uses themock locationfeature of popular mobile OS such as Android, iOS, and Windows Phone that allows MAd-Scope to set the location of the device to a target location before harvesting ad requests. MAdScope then identifies en-crypted location attributes in those harvested ads and uses them in ad requests to be replayed.
Note that the above procedure tries to identify the effect of one category of targeting attribute at a time, in isolation from other optional attributes. In practice, it is possible for an ad network to take targeting decisions based on multiple, rather than a single, categories of attributes. For example, an ad network may target women in a specific city, but such targeting would not be revealed by probing with only gen-der or with only location attributes. Identifying impact of combinations of attributes is challenging due to an exponen-tial number of combinations. Recent work has shown how to explore such combinations in a scalable way [16]; incor-porating such techniques to MAdScope is part of our future work.
4.1.2
Probing for Behavioral Targeting
Unlike attribute-based targeting, behavioral targeting is done based on a user’s profile, representing his historical be-havior such as types of apps he uses or ads he clicks on. MAdScope can automatically build profiles of specific inter-ests and preferences and can issue ad requinter-ests with those profiles.
There are several ways to create user profiles. One can mimic actions of a particular user (e.g., [3]). Characteris-tics of profiles built in this fashion can be arbitrary close to the profiles observed in reality. However, the approach is not scalable. MAdScope instead generates user location-and interest-based profiles by mimicking actions that reflect the target location and interest. (A similar approach was used in [1] to create profiles for in-browser ads.) The
strat-egy enables MAdScope to generate profiles for virtuallyany
location and interest.
Given a target location L and interest I, we would like MAdScope to mimic various user actions that are related to
LandIand that an ad network may observe, e.g., through targeting attribute values in ad requests or by correlating app and web usage data. More specifically, givenL andI, we would like MAdScope to emulate the following tasks for an extended period of time.
1. Set the user’s mobile device’s location toLbefore mak-ing any ad request.
2. Use various apps related to interest I only. Apps re-lated to interestIare chosen by matchingIwith Google Play app category [27].
3. Browse various web sites related to interest I. Web sites related to interestI are chosen by matchingI to website categorization service such as Alexa5 [1]. An ad network may correlate web and app usage to deliver ads to app based on the type of web page visited [21]. 4. Click on ads of categoryI. Category of an ad is
deter-mined by a classifier we describe later.
By emulating the above tasks, MAdScope lets ad networks observe (a subset of) the activities and build a user’s profile related toLandI. Step (1) is needed to make sure that an ad network can inferLas a significant location of the user and show location-based ad forLeven when he is not atL. Steps (2), (3), and (4) are needed because they reflect user’s interest, which an ad network can use to target ad. Among them (4) is particularly important since a click is a strong signal for a user’s need or interest.
Interestingly, MAdScope can perform actions (1), (2), and (3) easily with its replay tool, without using any real device. Since we only care about the interactions between apps and ad networks, instead of actually launching and using the tar-get apps, MAdScope can simply replay ad requests made by those apps. To enforce locationLand interestI, MAdScope replays ad requests harvested from apps of categoryI with location attributes set toL. Finally, it repeatedly visits top Alexa web sites of categoryI.
However, it is challenging to faithfully emulate clicks only on ads relevant to the profile category due to the following
click contaminationproblem.
IClick Contamination.While building a user’s profile of interest category I, MAdScope receives a sequence of ads, of which it must click on all and only ads of category I. Clicking on ads not related toImay contaminate the profile (i.e., confuse the ad networks about user’s true interest).
Category of an ad may be determined based on its textual content. However, many ads display images and videos and contain no or very little texts and hence cannot be classified with sufficient confidence. A more foolproof strategy is to classify based on content or Alexa category of the landing page of the ad (the page that a click on the ad leads to). Unfortunately, landing pages are not often mentioned in the ad itself; rather the ad contains a redirection URL, a click on which is redirected through an analytics server, typically used for accounting purpose, to a final landing page. Thus, to determine landing page of an ad, we need to click on it
5
http://ads.lfstmedia.com/click | {z } RedirectionServer /cmp10183 | {z } AdId
/XXX/2? ads=XXX&adkey=XXX&androididsha1=XXX&slot=XXX&impts=XXX&. . .
| {z }
DeviceP arams
Figure 7: Anatomy of a click URL of a MobClix ad. XXX denotes encrypted and numeric values.
even if we later find that its category does not match the profile category. This can contaminate the profile.
To address this, we use the following mechanism.
I Profile isolation via a dummy profile. MAdScope uses a dummy profile whose only purpose is to click on ads in order to determine their landing page. A redirecting click url consists of three components shown in Figure 7: a Redi-rection Server that receives the click and eventually redirects it to advertiser’s landing page, Ad Id that maps the ad to landing page and that the redirection server uses to decide which landing page to redirect to, and Device Params that contains various device-specific information that redirection server uses to identify the source of the click. The same ad shown in two different devices have the same redirection server and ad id, but different device attributes.
We utilize the above structure of click urls to click an ad without contaminating the profile. Given an ad requestr, we issue it twice, once with the original profile and again with the dummy profile, to receive adsaanda0respectively. By parsing the ads, we identify their click urlsuandu0. We then generate a click urlu00by concatenating the Redirection Server and the Ad Id fromubut Device Params fromu0and click (i.e., issue an HTTP GET request to) it. The effect is a click on the ada, but pretending the source of the click to be the dummy profile, which gives us the landing page without any click from the original profile.
4.1.3
Ad Classifier
MAdScope provides a classifier that given an ad can deter-mine its Alexa category6. This classifier is useful for various
analysis and for building behavioral profile.
Category of an ad can be determined based on its landing page or its content. To determine category based on the ad’s landing page, we rely on multiple sources, since we did not find an authoritative source that would assign a category to all of the landing pages in our data set. We used site categorization services from Alexa and WebPulse7from Blue Coat. However, as we show later, a significant number of the advertisers do not appear in Alexa (or WebPulse), and hence we train a machine learning classifier that predicts the category of a web page based on its content. The same classifier can be used for content-based classification if an ad contains enough textual contents.
IClassification features. For each top-level Alexa cate-gory, we consider top 1000 web sites. For each site, we take English words appearing in its title and keyword metadata in its HTML document header and discard frequent words such as ‘the’ and ‘and’. We then normalize each word by stemming it8. Finally, for each category, we construct a
“bag of words” with all stemmed words and their 2-grams
6
http://www.alexa.com/topsites/category 7http://sitereview.bluecoat.com/sitereview.jsp 8
Stemming is the process for reducing inflected (or some-times derived) words to their base or root form; e.g., “pho-tos” to “photo”.
in all 1000 web sites of that category. The bag is used as features for the category.
I Classification algorithm. Given the feature sets for all categories, we train a multi-class logistic regression clas-sifier [25], which is commonly used for text classification. We use a min-max normalizer for normalizing features, 20 random sweeps with L1 and L2 weights of 0, 0, 1, and 1 (for a linear combination of L1 and L2 regularization), and optimization tolerances of 10−4 and 10−7.
I Classification accuracy. To evaluate the performance of the classifier, we apply cross validation to the ground truth. We split the ground truth into 3 folds, train a clas-sifier on 2 of those folds and then evaluate its performance on the remaining fold. Overall, the classifier has an average accuracy of 0.76 across all categories. The Log-loss reduc-tion or the Reducreduc-tion in Informareduc-tion Gain (RIG) is 78%, which can be interpreted as the advantage of the classifier— the probability of a correct prediction is 78% better than random guessing.
4.1.4
Identifying Targeted Ads
To identify whether an ad is targeted, we use the intuition that a targeted ad is shown more frequently to some specific value of a targeting attribute than others. For each ad, we count how many times it is been shown to different values of a targeting attribute. This gives us empirical distribution of the ad over all targeting values. If the ad is not targeted to specific values, it is fair to assume that the observed distri-bution should be close to uniform. To compare the observed distribution with uniform distribution, we use Pearson’sχ2
test with the null hypothesis being “observed distribution is uniform”. The test involves computingp-value, whose value is small (less than 0.05) if the null hypothesis is rejected and close to 1 if the hypothesis is accepted. We say that an ad is targeted if thep-value of its observed distribution is less than 0.05.
The statistical analysis is meaningful only for ads that are shown at least a few times; we use a threshold of 10.
4.2
Limitations
Before we present our results, we would like to point out a few limitations of our methodology to set the expectation right. Targeting behaviour of an ad network may depend on many variabilities such as its available ad inventory, de-mands of ads, its targeting algorithm which may evolve over time, time of the day, etc. Although our attribute-based targeting results are based on a week long probe, the win-dow may not be sufficiently large to capture all variabilities. Our results are based on a small number of targeting values (e.g., locations of five big US cities); it is possible that an ad network employs custom targeting strategies for specific values which we might miss. For example, if an ad network used a different location-based targeting algorithms for USA and China, we would miss its behavior for China since we used USA locations only.
0
5
10
15
20
25
30
% Ads
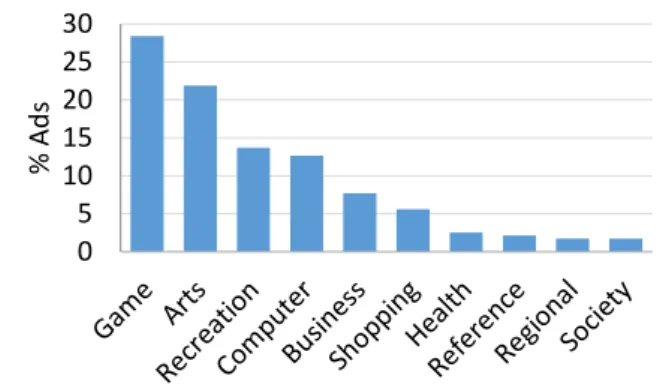
Figure 8: Distribution of ads over top ten Alexa categories
It is also possible that we failed to identify behavioral targeting of some ad network. This can happen for a few reasons. First, we use a window of one day to build profiles, after which we test for behavioral targeting. It is possible that our profile-building window of one day is too small to capture behavioral targeting of the network (although it is unlikely based on results from [1]). Second, the ad network may rely on other actions than what MAdScope emulates (Section 4.1.2) to build behavioral profiles. Third, MAd-Scope’s ad classifier is not perfect, and hence it can click on unrelated ads to contaminate profiles. The ad network under study may be sensitive to such contaminated profiles.
4.3
Empirical Results
4.3.1
Ads and Advertisers
We start with some results about ads and advertisers, which are based on ad impressions received by replaying 100,000 randomly selected ad requests from our datasets.
IAd serving rate. Ad serving rate indicates the fraction of ad requests returning valid ads. We say an ad network fails to return an ad when in response to an ad request, it returns an unsuccessful HTTP response (e.g., error 503: Service Unavailable) or an empty ad (likely due to lack of enough ads to serve).
We observed various degrees of ad serving rates for differ-ent ad networks. While most of the ad networks we tried had good (>95%) ad serving rate, we experienced poor serving rates for two ad networks: adsmogo.comand mobclix.com. Ad serving rates for these two networks were 43% and 81% respectively. Such a poor ad serving rate is bad for app de-velopers since they waste opportunities to show ads to users.
IAdvertiser rank analysis. We observed a total of 4037 unique advertisers. We determined their ranks by using Alexa’s top 1 million web sites. About 55% of the adver-tisers appear in Alexa’s top 1 million web sites, with an average ranking of 217K. Remaining 45% of the advertis-ers do not appear in Alexa’s top 1 million web sites and hence we could not determine their global web rank. Ads from these unranked constitute 75% of the total ads in our corpus. This shows that most of the mobile ads come from obscure advertisers who are not among the top 1 million web sites listed by Alexa.
I Ad categories. We categorized 1734 of 4037 advertis-ers using Alexa, 836 using WebPulse, and the rest with our
classifier. Figure 8 shows ad distribution for the top 20 root level Alexa categories. The top advertiser category is Game, where the landing page is a Google Play page for download-ing Android games. Some other major categories are Arts, Recreation, Computer, Business, and Shopping.
4.3.2
Attribute-based Targeting Analysis
To characterize attribute-based targeting of ad networks, we use MAdScope to actively probe top ten ad networks in our dataset. To capture temporal variability, each ad net-work was probed once every two hours, over a period of a week starting from October 10, 2014. To probe an ad net-work N, MAdScope first uses the targeting dictionary to identify categories of targeting information collected by N. The top ad network,doubleclick.net, allows targeting based on six different categories of attributes: location, keywords, device, demographics, child flag, and app name. Other net-works allow a subset of these categories. We identified a total of 26{ad network, targeting category}combinations. For each network N and categoryC, MAdScope then cre-ates up to 5 ad requests, with different values of targeting attributes of categoryC plus one request without any op-tional attribute of category C. (Note that MAdScope iso-latesCby omitting targeting attributes of other categories in ad requests.) Each ad request is then issued 100 times and the responses are captured. The overall process generated slightly over a million ad impressions over a week.
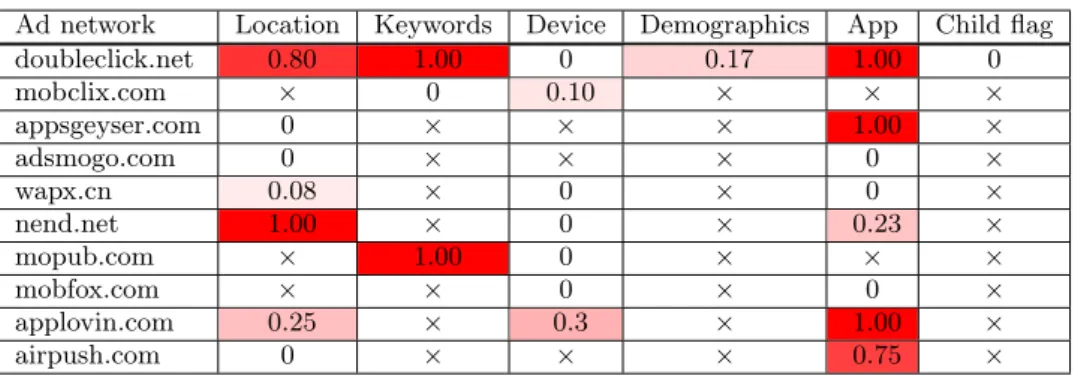
I Utilization of targeting attributes. Our key results on attribute-based targeting are shown in Table 3 that shows how effectively ad networks utilize various targeting infor-mation for targeting users. We compare ads received with different targeting values. For each {ad network, target-ing category}combination, we calculate the fraction of ads whose distribution across targeting values does not follow a uniform distribution with any statistical significance (i.e.,
p-value of theχ2test is less than 0.05). The closer the value to 1, the more targeted the ad. A value of 1 means 100% of the ads are distributed in a non-uniform way (i.e., they are targeted) across all targeting values. The same metric was used in [1] and [27] to quantify targeted ads.
We observed many instances where targeting information has statistically significant impact on how an ad network selects ads (shown by cells with values close to 1 in Table 3). For example, we founddoubleclick.netto select ads based on targeting keywords every time such keywords are available, while it targets users based on their locations 80% of the cases when location information is available.
We also observed many instances where ad networks col-lect many different types of targeting information, but do not use the information to target users. This is shown as cells in Table 3 with a zero values. For example, even though
appsgeyser.comallows apps to send location information, the information does not have a statistically significant impact on how the network selects ads.
• Location. We expected location-based ads to be com-mon and location information to be utilized by all top ad networks. Surprisingly, three of the seven ad networks that collect location information do not utilize it for targeting user. The fourth network,applovin.com, utilizes location in-formation only marginally.
•Keywords. We found three networks to accept targeting keywords and two of them to actually use them.
Ad network Location Keywords Device Demographics App Child flag doubleclick.net 0.80 1.00 0 0.17 1.00 0 mobclix.com × 0 0.10 × × × appsgeyser.com 0 × × × 1.00 × adsmogo.com 0 × × × 0 × wapx.cn 0.08 × 0 × 0 × nend.net 1.00 × 0 × 0.23 × mopub.com × 1.00 0 × × × mobfox.com × × 0 × 0 × applovin.com 0.25 × 0.3 × 1.00 × airpush.com 0 × × × 0.75 ×
Table 3: Ratio of ads shown by different (ad network, targeting category) combinations whose distribution across profiles does not follow uniform distribution with statistical significance. A cell marked with×indicates that the ad network does not collect targeting information of that category.
0 0.2 0.4 0.6 0.8
Fr
ac.
U
ni
que
Ads
NoTargeting
Targeting
Figure 9: Arrival rate of unique ads. Without tar-geting, average rate for all top ten ad networks is 26%, with targeting it is 11%.
• Device. Most (7 out of 10) ad networks collect device-specific information, but most ignore it for targeting pur-pose.
• Demographics and Child flag. Only one top ad net-work collects these information, but use them only marginally.
•App name/ID.Eight of the top ten ad networks collect app names and only half of them use the information to select ads.
Note that we identified targeting information from ad re-quests made by real apps and some of the targeting informa-tion is opinforma-tional, which implies that app developers explicitly provide these optional targeting information without getting any perceived targeting benefit. As mentioned in Section 1, ad networks most likely collect such targeting information for forward-compatibility and for information brokerage.
Also note that the results in Table 3 should not be inter-preted as a way to decide whether one ad network is neces-sarily “better” than another. An ad network may not collect or effectively use targeting information, but yet it can be lucrative to developers in terms of payouts and to advertis-ers in terms of convadvertis-ersion rates (and vice vadvertis-ersa). Evaluating ad networks in terms of these metrics is part of our future work.
IImpact of targeting on average distinct ad arrival rate. Figure 9 shows the fraction of distinct ads of all ads harvested from each of the top ten ad providers. Two ads
are considered distinct if they have the same text or image content and have the same click url. For each ad network, we report the fraction of distinct ads for two scenarios: when targeting is enabled and when targeting is disabled (i.e., when ad requests do not contain any targeting attributes).
Figure 9 shows several key points. First, all ad networks serve a large fraction of duplicate ads. On average, only 26% of the ads were distinct, suggesting that ad networks could benefit from caching ads on the client, as suggested by prior works [15, 19, 27]. The fraction of distinct ads vary widely across ad networks, ranging from 1% to 80%.
Second, targeting reduces the fraction of distinct ads. We observed this for all ad networks. When averaged over all ten top ad networks, the average fractions of distinct ads reduces from 26% to 11% when targeting is enabled. This is most likely because the pool of distinct ads applicable to specific targeting scenario is substantially smaller than those applicable to any or no targeting. This suggests that developers are likely to see more distinct ads when they do not overly target their ad requests. This might be one reason of why many developers do not provide optional targeting attributes even if ad networks allow them (Figure 6).
4.3.3
Behavioral Targeting Analysis
We use the following two-step methodology to detect if top ten ad networks use behavioral targeting. In the training step, we let MAdScope create five profiles with (1) different device ids, (2) different locationsL: New York, Los Angeles, Houston, Atlanta, and Seattle (five big cities in USA), and (3) different interestsI: Game, Arts, Recreation, Computer, and Business (top five ad categories shown in Figure 8). We then use MAdScope to issue 5000 ad requests for each profile, over a period of one day. Then in the testing step, we use MAdScope to issue 1000 ad requests for each profile, with the ad requests containing only device information but no location or specific interest information (i.e., we select ad requests from a set of 100 apps from all categories, remove their optional targeting attributes, and replay them for each profile). Intuitively, if the ad network has learnt about the users’ interests and locations from the training step and if it does behavioral targeting, it should show different ads to different profiles even though the attributes in ad requests do not indicate any specific location or interest. We use the sameχ2test to decide if the ads received by different profiles are distributed uniformly across profiles.