Using Inuence Diagrams in Software Change Management
Colin J. Burgess
Department of Computer Science, University of Bristol, Bristol, BS8 1UB, England Ilesh Dattani, Gordon Hughes and John H.R. May
Safety Systems Research Centre, University of Bristol, Bristol, BS8 1UB, England Kearton Rees
BT Laboratories, Martlesham Heath, Ipswich, Suolk IP5 3RE, England
In a large software management programme, the number of software changes
and enhancements requested for inclusion in the next software release often
far exceeds the resources available. Thus, during the preceding months before
the nal decision is made on which changes to include, there needs to be a way
of incorporating all the dierent factors that inuence these possible changes
into a coherent set of information to enable good decisions to be made.
This paper describes the use of inuence diagrams and a risk-based model to
formalise the combining of these dierent factors to aid the decision process.
This model not only reects the likelihood of all the necessary requirements
for a change being met but also allows for the nancial or other benets to the
organisation that would result from the change being included in the next
software release.
Keywords: inuence diagrams, software change management, risk-based modelling.
1 Introduction
In a large software management programme, there will normally be a large number of software changes and enhancements requested for inclusion in the next software release. The total number of requests often far exceeds the resources available for implementation and so not all the changes can be incorporated in the next release. Thus, during the preceding months before the nal decision is made on the contents of the release, a number of dierent factors relating to these changes need to be combined in order to provide sensible risk management information. These factors aect the likelihood of all the business and technical requirements for a given change being met by the cut-o date for inclusion, which we will term the Inclusion Date.
This paper describes the use of inuence diagrams and a risk-based model to formalise the combining of these dierent factors in the decision process. This model not only reects the likelihood of all the requirements being met but also the nancial or other benets accruing from the given change being included.
The paper has the following structure. Section 2 will describe the problem in greater detail and describe the existing approach, based on a standard Red, Amber and Green categorisation. Section 3 will be a brief introduction to inuence diagrams for readers unfamiliar with the concept. Section 4 will describe the application of inuence diagrams to the change management programme and Section 5 will describe the advantages and disadvantages of the approach.
2 The Software Change Management Problem
A Software Change Programme, often just termed a Software Development Programme, is responsible for producing new releases of software packages. In the particular programme studied, a new release of a very large package was produced several times a year on specied dates. Each new release takes about nine months to complete, and so work on dierent releases can overlap. For a given release, these nine months can be divided into a three month period, which we will term the Selection Phase, during which the contents of the release will be decided, followed by a six month Development Phase covering the development, testing and integration of the software for that release. This paper addresses the construction of a formal model to help management with the decision making process required during the Selection Phase.
There are a large number of Input Streams into the Software Change Programme from other parts of the organisation. Each Input Stream submits a Work Package, which we will call in this paper a Requirement, for inclusion in the next software release. Initially, these Work Packages are only specied at a very high level, and these specications then get rened and acquire the necessary business criteria for inclusion, during this Selection Phase. Thus each software release consists of a set of Requirements, or Work Packages, which have to be selected from all the Requirements requested.
Before any particular Requirement can be allowed to proceed to the implementation phase of the release, it must meet a number of criteria that are specied by the organisation. Some typical criteria are: A complete Business Requirement Specication; or Approval for the Finance for the work, because the work is nanced by the individual cost centres requesting the Requirement. The inclusion of the Requirement can also be inuenced by Management Directives or factors external to the organisation. Only Requirements which have met all the criteria by the Inclusion Date, were allowed to proceed to the implementation phase, and it may only be a subset of these, due to the nite resources of the teams required to do the implementation.
The management of this Selection Phase was assisted by a standard technique of assigning Red, Amber or Green statuses to each of the criteria. If a criteria had been met, it was assigned a Green status. If work to meet a criterion by the Inclusion Date was well in hand, then it was assigned an Amber status, and if work had yet to commence, or it looked likely to fail to meet the criterion by the Inclusion Date, then it was assigned a Red status. Thus any Requirement would have a collection of statuses associated with it for each system release.
At the start of the Selection Phase, any particular Requirement is likely to have mainly Red or Amber statuses associated with each of the criteria that have to be met. As the Selection Phase progresses, there can be daily changes to these statuses, with the aim of making all the statuses Green by the time of the Inclusion Date. At any particular point during the Selection Phase, the relative numbers of criteria assigned Red, Amber or Green status gives a good guide as to the likelihood of the Requirement meeting all its criteria in time for inclusion in the next release. In the specic programme studied for this research there would be typically 15 dierent criteria and the most important of these had to be Green and the rest Amber, for the Requirement to be a candidate for the Implementation Phase.
Although this was the major mechanism used, it was only a management guide, as other factors that were too complicated for this model had to be considered. Examples of these are external pressures or policy directives. These might cause more resources or pressure to be exerted on those requesting the change so that it met the criteria on time.
Despite having evolved to meet operational needs, this evaluation approach has two short-falls. Firstly, it is not a formal model of the decision process, and only includes a crude estimate of how likely it is for the criteria to be met. Secondly, it fails to formally capture the worth to the company, normally nancial, of the inclusion of a particular Requirement,
or even in some cases, the cost of omitting it. These are the additional aspects which the inuence diagram approach tries to capture.
3 Introduction to Inuence Diagrams
3.1 Motivation
Causal networks is a widely used technique for combining combinations of probabilistic events into a single mathematical model. The mathematics is based on standard probability theory. These networks contain chance nodes which represent events with a given probability and these events may be independent or conditional upon other events. There is also a utility node which represents the likely outcome of the network [10].
Another technique widely used in decision analysis is decision trees. Each node in a decision tree represents a decision and the branches emanating from a node are labelled with the probability of that particular outcome from that decision. These branches connect to further nodes, which represent subsequent decisions. One of the problems with decision trees is that the total number of nodes in the tree can grow exponentially with the number of decisions, making the tree quite large and hard to understand.
Inuence diagrams are an attempt to incorporate decisions as well as chance events into a single diagram which is easy to understand and can represent the value or likely utility of pursuing a given course of action. These are designed specically to provide as simple a model as possible of a decision process which contains uncertainties, so that management can understand the process involved and, if necessary, alter the model to more accurately reect the management process that takes place. The inuence diagram is also formal and can be transformed into an equivalent decision tree and evaluated. The decision tree which results is likely to be far more complicated than the original inuence diagram which makes the equivalent decision tree far less suitable for use when discussing issues with management sta. Some of the earlier work which helped to explain the use of inuence diagrams and their evaluation was by Shachter in 1986 [2,3], and a few years later, a variety of issues and applications of inuence diagrams was covered in a special issue of a journal[4]. The best book found so far by the authors, covering inuence diagrams and decision modelling, is by Marshall and Oliver [1]. Today, software tools exist that implement the inuence diagrams directly and perform the evaluations without the user needing to be aware of the equivalent decision tree.
Thus inuence diagrams help both the decision maker and the management analyst to visualise graphically, how management decisions and uncertain events relate to one another and their combined eect on the nal outcome of decisions. Inuence diagrams oer a compact global view of the probabilistic structure of the decisions problem, the timing of available information and decisions, and the interdependence between decisions and uncer-tain events.
Inuence diagrams make three main contributions to modelling the management process, which in order of importance are:
1. They provide a framework in which experts and decision makers can discuss the management of the problem and interdependencies of decisions and events, without invoking any formal mathematical, probabilistic, or statistical notation. Thus they serve to link the real world of decision making with that of the scientically trained analyst. The decision maker focuses on the problem and ensures that the inuence diagram used accurately reects the real world.
2. They provide a signicant contribution towards reducing large volumes of data to those parts that are essential to the decision making process.
3. An inuence diagram can provide a degree of sensitivity analysis to show how much eect particular decisions or uncertain events have upon the nal outcomes.
Since the early 1980's, inuence diagrams have been used in a wide variety of dierent applications. Some examples are medical diagnosis [5]; clinical decisions [6]; optimisation of oil spill response [7]; and the eect of res on biodiversity [8].
3.2 Constructing Inuence Diagrams
There are three dierent types of node in an inuence diagram. These three types are: 1. Uncertain events which are represented by circular nodes.
2. Decisions which are represented by square nodes.
3. Results or Utility Value which is represented by a diamond node.
An inuence diagram is drawn by connecting the labelled nodes by directed arcs. A directed arc from node A to node B implies that A aects or inuences B.
The following is a simple procedure to produce an inuence diagram. This is based on the procedure that appears in pp. 136-137 of Marshall and Oliver, which should be consulted for more details [1].
1. Construct a preliminary list of all the decisions and a list of the random events or random quantities of interest whose outcomes you believe to be important in the problem formulation.
2. Name each random quantity or decision, and also number them and rank them in time order.
3. Represent random quantities by round nodes and decisions by square nodes and draw them in time order from left to right.
4. Identify any inuences or dependencies between random quantities and decisions that you believe important. Insert directed arcs between nodes that inuence one another with the direction corresponding to the natural inuence.
5. If a random event or decision A is conditionally independent of, i.e. is not inuenced by, another decision or event B, given a third event or decision C, then you do not need an arc from B to A, even though C and B, and C and A, are connected by directed arcs. Thus it is permissible to have part of an inuence diagram that looks like Figure 1, despite the fact that intuitively we might expect an arc between B and A since they are both aected by C.
C
A
B
6. Check to see that there are no directed cycles in the diagram.
7. Ensure that any decision that occurs before a later decision has a directed arc from the former to the latter. Also any chance node known to a given decision node must be known to a later decision node, and thus must also be connected by a directed arc from the former to the latter.
4 The Application of Inuence Diagrams to the Software
Change Management Problem
4.1 Design of the Simplied Inuence Diagram
An inuence diagram for the Software Change Management Problem described in Section 2, can be constructed in the following way. In order to reduce the size of the nal inuence diagram, the scope is restricted to the modelling of a single Requirement independently from all the other Requirements that are possible candidates for inclusion in the development programme for the next software release. The purpose of the inuence diagram is to show how the expected utility of the Requirement is inuenced by a large number of factors, which we will call dependencies, which aect the feasibility of including the Requirement in the next software release.
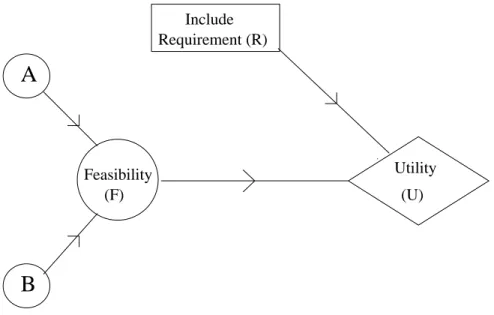
All the dependencies and the feasibility are represented as chance nodes. These attempt to capture the main variable factors that inuence the inclusion of a particular Requirement. These chance nodes are usually represented by circles. In this particular case study, there is only one decision to be made, which is whether or not to include the Requirement in the next release. This decision is represented as a square or rectangular box marked Include Requirement(R) and has two possible associated outcomes, called In or Out.
B A Feasibility (F) Utility (U) Include Requirement (R)
Figure 2: Simplied Inuence Diagram
The Utility node represents the level of benet that can be expected at any point in time, as a result of choosing to include a particular Requirement, and is usually expressed in pounds. This is represented by a diamond box marked Utility(U). Directed arcs are used on the diagram to represent inuences. Thus all the dependencies in this example will be connected either directly or indirectly to the Feasibility chance node.
A Simplied Inuence Diagram, which contains only two dependencies aecting the Fea-sibility is shown in Figure 2. This is a proper inuence diagram but is simplied in the
sense that real applications have many more than two dependencies. This simplied version will be used in order to explain the basic principles.
The two dependencies are represented by the circles A and B. The fact that they aect the Feasibility(F) is represented by the directed arcs AF and BF. The Expected Utility(U) is inuenced by the decision named Include Requirement(R), which has the values In or Out, and the Feasibility. These are represented by the directed arcs RU and FU. The absence of any other nodes or arcs implies that there are no other signicant inuences on the Utility that we wish to include in the model.
4.2 Implementation of the Simplied Inuence Diagram
The inuence diagram is a general concept and the calculations could be done by hand, but as soon as the diagrams contain many nodes or as soon as one starts experimenting with the consequences of making any changes to the diagram, some form of computer automation is useful. For this work the inuence diagram was implemented using a proprietary software package called HUGIN [9]. Tables are constructed in Hugin to specify how the Feasibility node and the Utility node calculate their values from the values of the nodes directly connected to them.
For each node, a decision is required on how the outcome associated with that node is going to be measured. This should me made so that it is as close as possible to the way the management do the assessment at present, hopefully ensuring that the model ts well into the management organisation. Although continuously variable outcomes can be catered for, probability distributions based on set of discrete values are easier to handle.
Some of the possible scales for these discrete values are: 1. Red, Amber and Green.
2. High, Medium and Low. 3. Yes and No.
As an example, consider Figure 3, which is the same as Figure 2 with the addition of tables for the nodes aecting the Expected Utility.
The probability distributions are captured by associating a probability with each discrete value such that the sum of the probabilities is always one.
e.g Using the Red, Amber and Green scale, then the set of pairsf(0.1, Red), (0.2, Amber),
(0.7, Green)gwould represent a 10% chance of it being Red, 20% chance of it being Amber
and a 70% chance of it being Green. This is illustrated by the table associated with node A.
One specic advantage of this approach is that it can still be used when information is currently unknown. This can be represented by associating equal probabilities to each of the discrete values e.g. f(0.5,Yes),(0.5,No)g. This is illustrated by the table associated with
node B.
The table for the Feasibility node gives the probability distribution for the feasibility given the probability distributions for the dependencies. This is illustrated by the table associated with the Feasibility Node(F), which has a row for each pair of possible values of nodes A and B.
A decision node is one whose outcome can only have one of a nite number of values, often only 2. e.g. The decision node R either has the value In, corresponding to the Requirement being included, or Out, corresponding to the Requirement being excluded. There is no probability distribution associated with the outcome of the decision. This is represented by the values 1.0 and 0.0 in the table associated with node R.
The output of the Utility node is single value called the Expected Utility. This is found by multiplying the Utility of incorporating the Requirement, i.e. the nancial gain, by
B A Feasibility (F) Utility (U) Include Requirement (R) 0.2 0.7 Yes No 0.5 0.5 Green No Yes Yes No No Yes 0.3 0.02 Red Amber Green Red 0.1 Amber Green Red Amber 0.5 0.1 0.01 0.07 1.0 Out In 0.0
Figure 3: Simplied Inuence Diagram with tables
its Feasibility, i.e. the probability of the Requirement having all its criteria met by the inclusion date. This Feasibility is automatically calculated by the software from the tables for nodes A, B and F, using the normal rules for calculating conditional probabilities. For more details of the mathematics, see either Pearl [10] or Marshall and Oliver [1].
The choice between whether to represent an inuence with a binary outcome as a decision or as a chance node in the inuence diagram depends on whether or not you need to cater for cases where the result of the decision is unknown or where probably is a sensible answer. If the output of the decision is always known and is clear cut, then a decision node is more appropriate, but if DontKnow or Probably are possible, then a chance node with appropriate probabilities associated with the Yes and No outcomes provides a better model. Thus DontKnow is modelled as the pair of outcomes f(0.5,Yes),(0.5,No)g and Probably could be
modelled as a pair such as f(0.8,Yes),(0.2,No)g.
In this work, all inuences with binary outcomes were modelled as chance nodes, since this more accurately modelled the situation, and the current release of the HUGIN did not support the modelling of alternating decisions and chance nodes in the same path.
An important point about this diagram is the lack of an arc from the Feasibility node F to the Include Requirement decision node R. This is because, although the Feasibility F, of this particular Requirement does inuence R, the decision is dominated by the feasibility and expected utility of all the other Requirements. Since the inuence diagram is only modelling a single Requirement, this decision can not be completely modelled on this diagram, but the diagram shown is the closest possible for a single Requirement considered in isolation. It is often the case that small inuences are omitted in order to provide a simpler inuence diagram that is easier to understand and use.
4.3 Requirements Capture Inuence Diagram
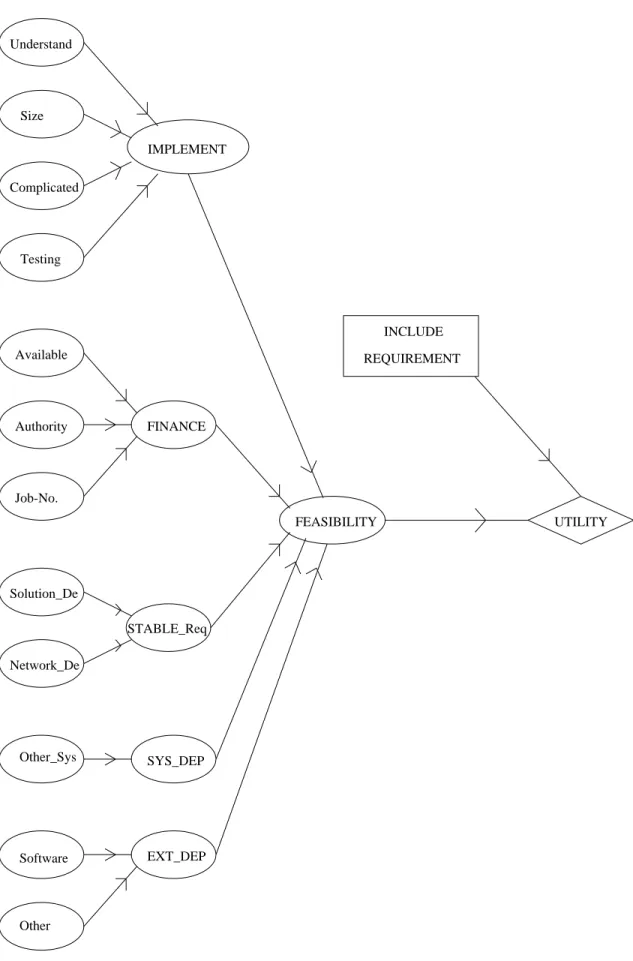
A more realistic inuence diagram which captures the main inuences aecting the inclusion of a particular Requirement is shown in Figure 4
The inuences can be naturally grouped into particular areas by introducing a two-level hierarchy into the diagram, e.g. Finance. This has two main eects. Firstly, the structure of the diagram can be improved and secondly, the size and complexity of the tables required to implement the inuence diagram is reduced as a direct consequence of reducing the total number of inputs into any one node.
The meaning of all the abbreviations used in Figure 4 is given in Table 1.
Abbrev.
Explanation
IMPLEMENT The implementation factors associated with the software for this Requirement
Understand Is this Requirement clearly understood? Size How large is this Requirement to develop?
Complicated How complicated is this Requirement thought to be? Testing How large is this Requirement to test?
FINANCE All nancial aspects of the implementation of this Requirement Available Is the budget for this Requirement available?
Authority Have we received the authority to spend the budgeted amount? Job-No. Has a job number been created on the nance system?
STABLE RQ Are the requirements for this software change stable? Solution De Is a solution design available?
Network De Is a network design available?
SYS DEP Constraints imposed by other systems Other Sys Are other systems aected?
EXT DEP Outside factors that inuence this Requirement Software Any changes required to other existing software? Other Other outside constraints
Table 1: Requirements Capture Abbreviations
All the nodes aecting the Feasibility have been modelled as chance nodes since this allows greater freedom for the modeller to capture uncertainty.
5 Conclusions
5.1 Advantages and Disadvantages of the Inuence Diagram approach
The inuence diagram has provided a model of the decision making process to determine whether or not to include any particular Requirement in the next software release. This is a very simple model to understand, but it is not always so easy to construct. The diagram can be of benet by itself since, if at any future occasion it was thought desirable to change the decision making process, this could be explicitly represented by changing the inuence diagram. By using the Hugin software to populate and evaluate the inuence diagram, it is possible to arrive at an Expected Utility for each Requirement. This Expected Utility reects both the likelihood of the software change proposed being successfully implemented in time for the next software release, and the value of that change to the organisation. This enhances the information provided by the existing spreadsheet mechanism, by not only combining the dierent dependencies in a consistent manner, but also explicitly including the benet of the change to the organisation in the calculations.
Thus the model identies the likelihood of each Requirement meeting all the criteria, by the time of the selection decision. These likelihood values, and the causes behind them,
FINANCE Understand Complicated Available Authority Job-No. Size Network_De Testing Solution_De FEASIBILITY STABLE_Req SYS_DEP EXT_DEP Other Software Other_Sys UTILITY INCLUDE REQUIREMENT IMPLEMENT
can be examined at any time during the Selection Phase, thus allowing managers to take appropriate action to ensure that the Requirements with highest Utility value in each release will meet the criteria in time for inclusion.
The only real disadvantage of the approach is the time required to set up the probabilities for all the tables used to drive the HUGIN simulation, but this is an inevitable consequence of trying to establish a more formal probabilistic model of the decision process. Fortunately, the factors that inuence the inclusion of a Requirement and their relative importance are the same for all the dierent Requirements and thus once the model has been set up, it can be used without any changes, although the organisation may want to do some ne tuning of the probabilities when some experience has been gained from using the system.
The output from the inuence diagram simulation has to be used in conjunction with any other factors that cannot easily be captured by either the spreadsheet or the inuence diagram model when making the nal decision. Possible examples of these factors are the availability of the required people or teams to implement particular Requirements, or decisions that are the result of policy rather than cost. Future research could include the development of more complex models designed to extend the types of factors that could be incorporated.
6 Summary
This paper has outlined how the use of an inuence diagram can be used to model the risk management process of choosing which software changes to chose to implement in a given software release. It has shown how the model can be implemented using proprietary software and thus automate the calculation of all the conditional probabilities to produce an overall Expected Utility for each possible software change. This Expected Utility reects both the likelihood of it being successfully implemented in time for the next software release, and the value of that change to the organisation.
7 Acknowledgement
The University of Bristol would like to thank BT Laboratories for providing a research grant to support this work.
8 References
1. Kneale T. Marshall and Robert M. Oliver, Decision Making and Forecasting: with emphasis on model building and policy analysis, McGraw-Hill Inc. (1995).
2. Ross D. Shachter, 'Evaluating Inuence Diagrams', Operations Research Vol 34 No 6 (1986) pp 871-882
3. Ross D. Shachter, 'Probabilistic Inference and Inuence Diagrams', Operations Research Vol 36 No 4 (1988) pp 589-604
4. F.T. Boesch (ed), 'Special Issue on Inuence Diagrams', Networks: an international journal, Vol 20 No 5 (1990) pp 491-685
5. C.A. de Braganca Pereira and R.E. Barlow, 'Medical Diagnosis Using Inuence Dia-grams', Networks: an international journal, Vol 20 No 5 (1990) pp 565-578
6. D.K. Owens, R.F. Nease and R.D. Shachter, 'Representation and Analysis of Medical Decision Problems with Inuence Diagrams', Report No. SMI-96-0643, Stanford University, USA (1996)
7. J.M. Agosta, 'Constraining Inuence Diagram Structure by Generative Planning: An Application to the Optimisation of Oil Spill Response', Proceedings of the 12th Conference on Uncertainty in Articial Intelligence (UAI96), Oregon, published by Morgan Kaufmann, San Francisco, pp 11-19 (1996)
8. A. Malcolm Gill, 'Fire and Biodiversity: The Eects and Eectiveness of Fire Manage-ment', 'Biodiversity Series', Paper No. 9, Centre for Plant Biodiversity Research, Australia. 9. HUGIN Runtime User's Guide, Version 3.1, Rev. 2.4, Hugin Expert AS. Denmark. (1993) Web site: http://www.hugin.dk/