Modeling the Impact of Total Quality Management
(TQM) Practices on Service Quality in Service
Organizations
(Case Study: Isfahan Refah Kargaran Bank)
Dr. Majid Nili AhmadabadiDepartment of Management, Najafabad Branch, Islamic Azad University, Isfahan, Iran Tel:+98-912-130-3478 E-mail:Nili2536@gmail.com
Dr. Javad Mehrabi1
Department of Public Management, Qazvin Branch, Islamic Azad University, Qazvin, Iran Tel:+98-912-209-7984 E-mail:mehrabijavad@yahoo.com
Mohammad Hasan Tanhaei
Department of Management, Najafabad Branch, Islamic Azad University, Isfahan, Iran
Tel:+98-913-413-1978 E-mail: mhtanhaei90@yahoo.com
Accepted: April 25, 2012 Published: May 26, 2012
Doi:10.5296/ijld.v2i3.1859 URL: http://dx.doi.org/10.5296/ijld.v2i3.1859
Abstract:
Purpose: purpose of the present survey is to determine degree of relationship and impact of total quality management (TQM) practices on service quality in service organizations.
Research methodology: this survey was conducted using descriptive-field method. Its primary data was obtained through field study by two TQM and service quality questionnaires among seventeen selected branches of Refah Kargaran Bank in Isfahan province. Volume of sample included sixty three (63) persons. Multiple regression method, F-test and T-test, ANOVA and correlation tables were used in the survey.
Findings: continuous improvement with β=-0.537 and training with β=0.409 are two primary
effective factors on increasing of service quality among seven independent variables (training, management commitment, employees‟ empowerment, customer focus, information, continuous improvement and employees' involvement). Its regression model is as below:
Conclusion: given to obtained results it could be claimed that it is possible to achieve a desirable level of success in business through a more precise planning, focusing on several more important and effective principles due to prioritization of effective factors on service quality during a shorter period of time and paying lower costs.
Key words: total quality management (TQM), total quality management (TQM) practices, service quality
Introduction
Globalization of commercial economy has persuaded companies to focus on maintaining a stable competitive advantage and these advantages have a direct relationship with service quality and production (Siddiqui et al, 2007). Also quality is a competitive weapon which ensures more durability of organizations. Production and operation managers and especially quality managers are creators of such competitive weapon. Today quality is regarded as one of the most important branches of global competition. Intensification of global competition and increasing of customers' demand for better quality have been leaded to companies' movement towards offering high quality products and services (Demirbag et al, 2006). Considering customer satisfaction is another competitive advantage which is observed by organizations. Heavy load of customer satisfaction is generally undertaken by the organization and specifically is undertaken by marketing. Quality improvement in order to attract customer satisfaction is a new competitive weapon that creates delay at the time of organizations' collapse and products' declining. Stating quality and customer satisfaction in mission statement of organizations indicates strategic perspective about the company's future. This issue is so important that some specialists of total quality management (TQM) have defined quality as attracting customers' satisfaction and satisfying their needs.
Research literature Service quality
Quality is a dynamic status that has relation with production, service offering, employees, processes and environment and could be reached expectation level of customers or even higher than it (Venous and Madadi Yekta, 2006). Customers expect two desirable and sufficient levels of service quality that customer's tolerance area separates these two levels from each other (Beglu and Zomorodpush, 2010). Physical quality is products or supporting products and services. Of course physical dimensions are fewer in public and service organizations and customers evaluate physical quality in such organizations based on accessibility of services. Interactive quality refers the relationship between customer and service provider and organizational quality reflects general picture and perceptions from the organization (Shahriari, 2007).
Total quality management
Total quality management (TQM) is one of the most perfect and efficient management philosophies that contains topics of quality and customer satisfaction suitably. Purpose of modern quality management is to attract total satisfaction of the customer through
economizing and rationalizing the expenditure that the customer pays. Basis of this affair is systematic quality management that includes all sections of an organization. Total quality management (TQM) is a key strategy to maintain competitive advantage and is a way for managing organizations in order to improve effectiveness and general performance and obtain a superior global status (Ooi et al, 2007).
Total quality management (TQM) and service quality
Using total quality management (TQM) for service organizations (to enhance service quality) needs special considerations, because services are typically produced and consumed at one time. Many organizations started to examine total quality management (TQM) as a fixed and permanent method to improve their services since the 1990's and this becomes more important increasingly so that each year new vocabularies are created in the field of quality and productivity. Some of these vocabularies refer foundations of this science and some have just advertising quality for management consultant companies. On the other side, all people demand improved services and a high level of participation by comprehensiveness of concept of quality and this has become a complicated task for organizations, because the common people demand quality and service improvement and at the same time they object to increasing of prices or creating tax burden. This duality is often happened because customers need high quality services with lower price. However, organizations should establish a balance between such duality, i.e. successive conflicts and obligations of citizens.
Table 1- synthetic table
Study Factors Juran, 1988 Saraph et al, 1989 Flyn et al, 1994 Motwani, 2001 Antony et al, 2002 Hashemi, 2008 Proposed model Information - - √ - - - √ Employees' empowerment - √ - √ - √ √ Customer focus √ - - - √ √ √ Employees' involvement √ √ √ - √ - √ Management commitment - √ √ √ √ √ √ Continuous improvement √ - √ √ √ √ √ Training √ √ - √ √ - √
The above table shows that the most emphasis is on continuous improvement, management commitment, training, employees' involvement, employees' empowerment, customer focus and finally information respectively according to the clear-sighted.
Proposed model of the survey
Primary hypotheses
1) There is a significant relationship among total quality management (TQM) practices and service quality in service organizations.
2) Total quality management (TQM) practices have different impacts on service quality.
Secondary hypotheses
1) There is a significant relationship between information and service quality.
2) There is a significant relationship between employees' empowerment and service quality. 3) There is a significant relationship between customer focus and service quality.
4) There is a significant relationship between employees' involvement and service quality. 5) There is a significant relationship between management commitment and service quality. 6) There is a significant relationship between continuous improvement and service quality. 7) There is a significant relationship between training and service quality.
Research background
Nazemi et al (2011) conducted a research entitled "prioritization of key success factors in TQM to decrease performance gap" using fuzzy AHP technique and investigated the issue that which sections are in improvement priority in order to improve current status of total quality in the industry under study. Four components and sixteen sub-components were generally studied in this research. Improvement priority was specified after determining the weight of factors from one side and their gap from the other side by calculating the balanced gap and sub-components of team work, employees' involvement and reward were in first to third priority.
Arumugam et al (2009) conducted a study entitled "self-assessment of total quality management (TQM) practices". This study reveals that power of companies lies in accurate implementation of total quality management (TQM) principles that two important principles of customer focus and processes' management have the highest impact on gaining success. But factors such as having relation with suppliers and information have moderating role and are not as important as the above cases.
Boon Ooi (2007) conducted a study entitled "total quality management (TQM) practices and its relationship with production employees". Results of this study illustrate that all practices of total quality management (TQM) don't have a similar impact on production and increasing of employees' job satisfaction. Only organizational culture and team work have a positive relationship with increasing of employees' job satisfaction. This study states that when team work is disseminated as the dominant TQM principle across the whole organization increasing of job satisfaction is appeared significantly.
Research methodology
First, two questionnaires were compiled for total quality management and service quality using research model and validity of the questionnaire was confirmed through views of academic experts as well as active managers in service industries especially banks. Reliability of the questionnaire was confirmed using cronbach alpha test and was equal to 0.67. Statistical population included two-hundred thirty four (234) employees of branches of Refah Kargaran Bank in Isfahan province. Seventeen branches were selected among thirty five branches of Refah Kargaran Bank by random sampling method and four questionnaires were distributed in each branch. Of course the accessible sample (number of the personnel who were allowed to complete the questionnaire by permission of supervision of branches) was 65 persons that maximum sample volume was used to obtain better results. Descriptive statistics methods such as frequency distribution tables, percentage and mean were applied to study and compare variables. Also referential statistics methods like multiple regression, ANOVA tables, correlation tables and different tests such as F-test and T-test were used to analyze data in SPSS software.
Data analysis
Studying variables of TQM practices and service quality using partial correlation coefficients
Partial correlation coefficient is correlation between two variables when impacts of other variables are omitted (Nourosis, 2002). Partial coefficient is used when we want to measure power of linear relationship between one dependent variable and one independent variable while impacts of other independent variables are fixed simultaneously. Given to research variables (training, management commitment, employees' empowerment, customer focus, information, continuous improvement and employees' involvement) and the above explanations partial correlation coefficient is used to determine significance relationship among these seven variables. Results are as the following tables:
Hypothesis 1H0: there is a significant relationship between information and service quality.
Table 2- testing secondary hypothesis 1: there is a significant relationship between information and service quality.
Control variables Service quality Information
Management support & Employees' involvement & Employees' empowerment & Continuous improvement & Customer focus & Training
Service quality Correlation 1.000 .105
Significance (2-tailed) . .435
Df 0 55
Information Correlation .105 1.000
Significance (2-tailed) .435 .
Df 55 0
Given to results of table (2) and the obtained partial correlation coefficient between information variable and dependent variable of service quality (Sig=0.435>0.05, partial significance=0.105) H0 is not rejected. Thus, it is not possible to accept the hypothesis
regarding existence of positive correlation between information and service quality.
Hypothesis 2H0: There is a significant relationship between employees' empowerment
and service quality.
Table 3- testing secondary hypothesis 2: there is a significant relationship between employees' empowerment and service quality.
Control variables Service quality Employees’ empowerment
Information & Training & Customer focus & Continuous improvement & Management support & Employees' involvement
Service quality Correlation 1.000 -.013 Significance
(2-tailed)
. .921
Df 0 55
Employees’ empowerment Correlation -.013 1.000 Significance
(2-tailed) .921 .
Df 55 0
Given to results of table (3) and the obtained partial correlation coefficient between employees' empowerment variable and dependent variable of service quality (Sig=0.921>0.05, partial significance=-0.13) H0 is not rejected. Thus, it is not possible to
accept the hypothesis regarding existence of positive correlation between information and service quality.
Hypothesis 3H0: There is a significant relationship between customer focus and service
quality.
Table 4-testing secondary hypothesis 3: there is a significant relationship between customer focus and service quality.
Control variables Service quality Customer focus
Information & Training & Management support & Employees' involvement & Employees' empowerment & Continuous improvement
Service quality Correlation 1.000 -.044
Significance (2-tailed) . .746
Df 0 55
Customer focus Correlation -.044 1.000
Significance (2-tailed) .746 .
Df 55 0
Given to results of table (4) and the obtained partial correlation coefficient between customer focus variable and dependent variable of service quality (Sig=0.746>0.05, partial significance=-0.044) H0 is not rejected. Thus, it is not possible to accept the hypothesis
regarding existence of positive correlation between customer focus and service quality.
Hypothesis 4H0: There is a significant relationship between employees' involvement and
service quality.
Table 5- testing secondary hypothesis 4: there is a significant relationship between employees' involvement and service quality.
Control variables Service quality Employee involvement
Information & Training & Customer focus & Continuous improvement & Employees' empowerment & Management support
Service quality Correlation 1.000 .131
Significance (2-tailed) . .333
Df 0 55
Employee involvement Correlation .131 1.000
Significance (2-tailed) .330 .
Df 55 0
Given to results of table (5) and the obtained partial correlation coefficient between employees' involvement variable and dependent variable of service quality (Sig=0.330>0.05, partial significance=0.131) H0 is not rejected. Thus, it is not possible to accept the hypothesis
regarding existence of positive correlation between employees' involvement and service quality.
Hypothesis 5H0: There is a significant relationship between management commitment
and service quality.
Table 6-testing secondary hypothesis 5: there is a significant relationship between management commitment and service quality.
Control variables Service quality Management commitment
Employ involvement & Employees' empowerment & Continuous improvement & Customer focus & Training & Information
Service quality Correlation 1.000 -.336 Significance
(2-tailed)
. .051
Df 0 55
Management commitment Correlation -.336 1.000 Significance
(2-tailed)
.051 .
Df 55 0
Given to results of table (6) and the obtained partial correlation coefficient between management commitment variable and dependent variable of service quality (Sig=0.051>0.05, partial significance=-0.336) H0 is not rejected. Thus, it is not possible to
accept the hypothesis regarding existence of positive correlation between management commitment and service quality.
Hypothesis 6 H0: There is a significant relationship between continuous improvement
and service quality.
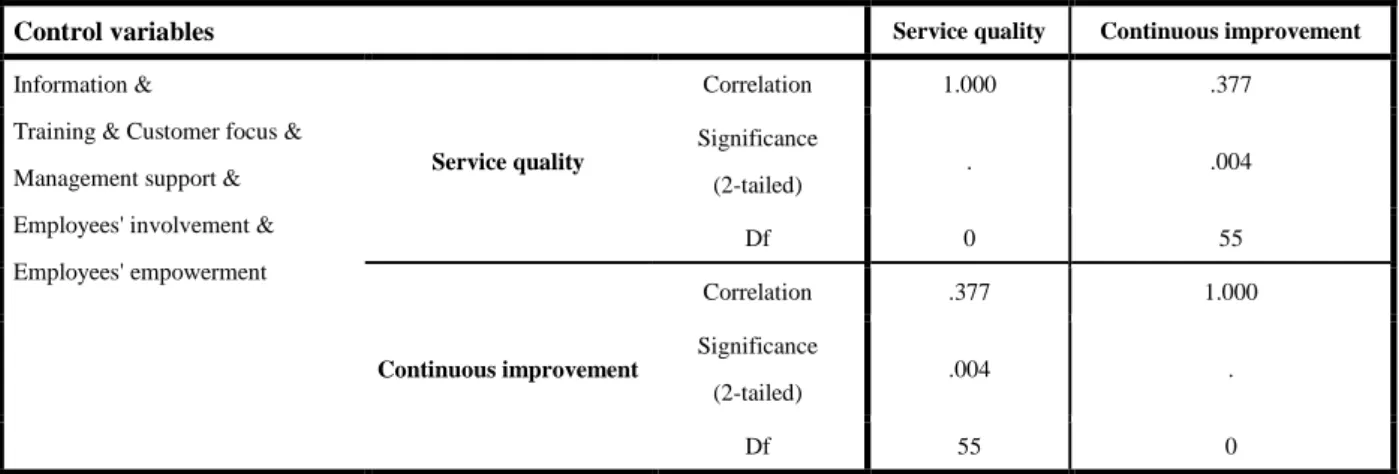
Table 7- testing secondary hypothesis 6: there is a significant relationship between continuous improvement and service quality.
Control variables Service quality Continuous improvement
Information &
Training & Customer focus & Management support & Employees' involvement & Employees' empowerment Service quality Correlation 1.000 .377 Significance (2-tailed) . .004 Df 0 55 Continuous improvement Correlation .377 1.000 Significance (2-tailed) .004 . Df 55 0
Given to results of table (7) and the obtained partial correlation coefficient between continuous improvement variable and dependent variable of service quality (Sig=0.004<0.05, partial significance=0.377) H0 is not rejected. Thus, it is not possible to accept the hypothesis
regarding existence of positive correlation between continuous improvement and service quality.
Hypothesis 7H0: There is a significant relationship between training and service quality.
Control variables Service quality Training
Information & Management support & Employees' involvement & Employees' empowerment & Continuous improvement & Customer focus
Service quality Correlation 1.000 .310
Significance (2-tailed) . .019
Df 0 55
Training Correlation .310 1.000
Significance (2-tailed) .019 .
Df 55 0
Given to results of table (8) and the obtained partial correlation coefficient between training variable and dependent variable of service quality (Sig=0.019<0.05, partial significance=0.310) H0 is not rejected. Thus, it is not possible to accept the hypothesis
regarding existence of positive correlation between training and service quality.
Table 9- table of synthetic coefficients
Unstandardized Coefficients Standardized Coefficients T Sig 95.0% Confidence Interval for B B Std. Error Beta Upper Bound Lower Bound Constant 1.435 0.428 --- 3.355 0.001 2.293 0.578 Management commitment -0.360 0.136 -0.475 -2.643 0.051 -0.087 -0.632 Employees' involvement -0.138 0.140 0.158 0.983 0.330 0.418 -0.143 Employees' empowerment -0.015 0.148 -0.014 -0.100 0.921 0.282 -0.311 Information 0.111 0.142 0.128 0.786 0.435 0.395 -0.172 Training 0.393 0.162 0.409 2.419 0.019 0.718 0.067 Customer focus -0.043 0.133 -0.039 -0.325 0.746 0.224 -0.310 Continuous improvement 0.469 0.156 0.537 3.016 0.004 0.781 0.157
Variables of management commitment, employees' empowerment, employees' involvement and customer focus have negative coefficients in table (9). But training, information and continuous improvement have positive coefficients. Studying table (9) rejects the null hypothesis that coefficients of training (Sig=0.019<0.05) and continuous improvement (Sig=0.04<0.05) are equal to zero. It is observed that confidence interval doesn't include zero for these two variables.
But it is not possible to conclude decisively that variables of management commitment (Sig=0.051>0.05), employees' involvement (Sig=0.330>0.05), employees' empowerment (Sig=0.921>0.05), information (Sig=0.435>0.05) and customer focus (Sig=0.746>0.05) don't have a linear relationship with service quality. It means that any other conclusion about a specific independent variable in multiple regression model depends on the relationship between that variable and other independent variables as well as the dependent variable (Nourosis, 2002). Therefore, table (9) could be used for better interpretation.
Table 10- correlation coefficient among independent variables P ea rso n Co rre lati o n S ig . (1 -tailed ) Service quality Management commitment Employee involvement Employees‟ empowerment
Information Training Customer focus Continuous improvement Service quality 1.000 0.399 0.430 0.385 0.503 0.569 0.367 0.623 Management support 0.001 1.000 0.660 0.538 0.687 0.744 0.449 0.748 Employees' involvement 0.000 0.000 1.000 0.674 0.671 0.453 0.486 0.635 Employees' empowerment 0.001 0.000 0.000 1.000 0.617 0.392 0.330 0.597 Information 0.000 0.000 0.000 0.000 1.000 0.669 0.428 0.645 Training 0.000 0.000 0.000 0.001 0.000 1.000 0.425 0.705 Customer focus 0.002 0.000 0.000 0.004 0.000 0.000 1.000 0.577 Continuous improvement 0.000 0.000 0.000 0.000 0.000 0.000 0.000 1.000
The first section of table (10) includes the observed correlation coefficients for each pair of variables and the second section includes observed significant levels. For instance it could observe that correlation coefficient between service quality and information is equal to 0.503 and it is possible to reject the hypothesis that there is no linear relationship between the two variables based on the observed significance level:
H0: there is no linear relationship between the two variables.
H1: there is linear relationship between the two variables.
Given to amounts of beta column in table (9) we can accept the hypothesis that each practice of total quality management has a different degree of impact on service quality. Consecutive improvement with β=0.537 is regarded as the most effective practice to increase service quality and training with β=0.409 is regarded in the second place of effectiveness on increasing of service quality among seven practices of total quality management.
Making the final regression model
Seven variables that have been introduced as independent variables in the model were selected among a large number of variables. Undoubtedly there are other cases which could be useful for making a model. Also some of the selected variables may not be good predictors. The purpose is to constitute a simple model which decreases index errors and improves prediction (Nourosis, 2002). There are various methods to do this and one of them is using forward selection method.
Forward selection method
In this method we begin from the model which has just a fixed amount. At each stage one variable is added to the model which creates the highest change in R and this change must be so severe to be able to reject the null hypothesis regarding that real amount of change is equal to zero. Insertion of variables in the model is stopped when there is no other variable to create a significant increase in R. The regression model has been compiled as below after using forward selection method:
Comprehensive model : Service Quality Y=1.876+0.543 (Continuous improvement)
Conclusion
Results reveal that the hypothesis regarding existence of a significant relationship between training and service quality as well as continuous improvement and service quality could be accepted. But hypothesis regarding existence of relationship between service quality and each practice of management commitment, employees' involvement, employees' empowerment, information and customer focus could not be accepted given to their significance level in partial correlation analysis. But this issue is not the reason for lack of relationship among these five practices and service quality. It is notable that some variables contain changes which have been obtained by other variables due to existence of strong and positive relations among variables that were observed in Pierson correlation analysis. For example Pierson correlation coefficient between continuous improvement and information is equal to 0.645. That is if continuous improvement is inserted in a model as an independent variable, information has no role independently, i.e. most data that information variable contains has been represented by other independent variables too.
The second primary hypothesis (total quality management practices have different impacts on service quality) is accepted given to various amounts of correlation coefficients as well as various beta amounts in lieu of each variable in the tested regression models. Continuous
improvement with = 0.537 was identified as the most important and effective practice among total quality management practices to increase service quality. The second effective
factor on service quality is training with = 0.409 in service organizations.
A very important point has been considered in each of the above regression models to model the relationship among independent variables and the dependent variable (here service quality) and it is that independent variables have relation with each other considerably. For instance correlation coefficient between continuous improvement and information is equal to 0.645. It means that if continuous improvement is inserted in a regression model as an independent variable, information variable has no role independently. In other words, most issues that information variable could change or repeat are represented by other independent variables too. Thus coefficients of independent variables each of which has relation with the dependent variable singly will have no much significant difference with zero in multiple regression equation.
As a result the regression model in this article just includes continuous improvement (β=0.623) and significance coefficient of 0.543. This result proves importance degree of continuous improvement in increasing of service quality in service organizations. Generally we can accept that total quality management practices have different impacts on service quality.
References
Beglure, Zomorrodpush, F, 2010, Determining the status of customer relation management (CRM) in libraries and information centers, Journal of Librarianship and Information, 47 Shahriari, S, 2007, Impact of customer-oriented policies of Keshavarzi Bank based on customer reverence in customer satisfaction in Shiraz, M.A thesis, department of higher education, Khorasgan University, Isfahan
Nazemi, Sh; Kazemi, M; Okhravi, A, Prioritization of key success factors to decrease performance gap using fuzzy AHP, Case study: an industrial company, two journals of strategic management thought, p 183, No.8, autumn and winter 2011
Nourosis, 2002, translated by Fotouhi, A and Asghari, F, Statistical analysis of data by SPSS, Naghus publications, Tehran
Venous, D; Madadi Yekta, Sh, 2006, Studying effective factors on satisfaction and satisfaction degree of customers in internal flights of Iranian Airlines HOMA, Journal of department of administrative affairs and economy at Isfahan University
Arumugam, Hiaw Wei Chang, Keng-Boon Ooi, Pei-Lee Teh, (2009) "Self-assessment of TQM practices: a case analysis", The TQM Journal, Vol. 21 Iss: 1, pp.46 – 58
Arumugam et al, “International Journal of Business, Management and Social Sciences” Vol. 1, No. 1, 2010, pp. 113-128
Demirbag, Mehmet; Tatoglu, Ekrem; Tekinkus, Mehmet; Zaim, Selim. (2006). “an Analysis of the Relationship between TQM Implementation and Organizational Performance”, Journal of
Ooi, Keng Boon; Bakar, Nooh Abu; Veeri, Arumugam; Vellapan, Lorriane; Loke, Alex Kim Yin. (2007). “Does TQM Influence Employees’ Job Satisfaction?”, International Journal of Quality & Reliability Management, Vol. 24, No. 1, PP: 62-77
Saraph, J.V., Benson, P.G. and Schroeder, R.G. (1989), „„An instrument for measuring the critical factors of quality management’‟, Decision Sciences, Vol. 20 No. 4, pp. 810-29. Siddiqui, Jamshed; Rahman, Zillur. (2007). “TQM Principles’ Application on Information Systems for Empirical Goals”, the TQM Magazine, Vol. 19, No. 1, PP: 76-87.