91
A Quality of Service Performance Evaluation Strategy for Delay
Classes in General Packet Radio Service
P. Calduwel Newton
1and L. Arockiam
2 1Assistant Professor in Computer Science, Bishop Heber College (Autonomous),
Tiruchirappalli-620 017
2
Associate Professor in Computer Science, St. Joseph’s College (Autonomous),
Tiruchirappall –620 002, Tamil Nadu, INDIA
calduwel@yahoo.com
Abstract
The wireless networks are experiencing higher delay, higher error rate, and lower bandwidth compared to wired networks. The customers not only need mobility but also quality. It is a great challenge for the service providers to offer Quality of Service (QoS). The QoS parameters are divided into two categories such as Qualitative QoS parameters (reliability, security, etc.) and Quantitative QoS parameters (bandwidth, delay, jitter, etc). The requirements of the above parameters will vary from one application to another application. In this paper, we would like to propose an efficient technique to store the QoS requirements of data transfer and to evaluate the performance of data transfer with respect to delay. Certainly, the outcome of this paper will help to compare the expected QoS requirements with the actual QoS results, to understand performance degradation and to identify the parameters responsible for delay problem.
Keywords: Quality of Service, Data, Reliability, Mobility, Performance
1. Introduction
The usage of wireless mobile networks is inevitable in our day-to-day life. But, it throws more challenges than its counterpart, fixed networks. It has more limitations in speed, bandwidth, error rate, etc. As the users of mobile network are increasing exponentially, ensuring Quality of Service (QoS) by the service providers is must. These networks are expected to support wide variety of applications. These applications integrate several media such as text, graphics, audio, video, image, etc. These heterogeneous data and recent advances in mobile networks present complex traffic patterns and QoS requirements.
According to the ITU-T standard E.800, QoS is defined as “the collective effort of service performances, which determine the degree of satisfaction of a user of this service”. QoS is also defined as “a set of service requirements to be met by the network while transporting a flow”. Flow refers a stream of packets from source to destination.
Services can have qualitative and quantitative QoS parameters [1]. Qualitative parameters are security mechanisms, manageability, etc. Quantitative parameters are bandwidth, jitter, delay, etc. These parameters together determine the Quality of Service (QoS).
92
The Internet provides mainly best-effort service and may not meet the requirements of mobile networks that will require guarantee for transferring heterogeneous data. The requirements of the above parameters will vary from one application to another application. Applications like file transfer, remote login, etc., will require high reliability. But, applications like audio, video, etc., will require low reliability, because they can tolerate errors. Due to these diverse requirements, QoS is inevitable.
Delay refers the time needed to send a packet from source to destination. Jitter refers the delay variation. Delay includes the time needed for the propagation of packets and the processing of packets. Measures must be taken to reduce propagation issue and processing issue. Delay issues are very important in mobile networks. They have to be handled carefully in order to provide QoS. Due to its exponential growth and moving nature, complexities of various parameters are increasing. Some of the delay issues occur with web access, remote login, telephony and video-conference, etc.
When the load reaches the network capacity, the delay may be increased. The sensitivity of application programs to delay is not the same. For example, it is more important that the web access and remote login are sensitive to delay. But, telephony and video conference applications are more sensitive to delay.
The performance of a network is affected by many factors. They are speed mismatch, topology, increased usage, misbehavior, capabilities of the hardware and software, etc. The performance of the network can be affected by the computation overhead and processing overload [2]. When the network is not performing well, the customers often complain the service providers. To reduce or eliminate these issues, the service providers must understand the problem, identify the causes, realize the consequences and find the cures for the problem.
As the need for mobile network is growing exponentially, challenges and issues also increases. They affect the data traffic of the network. The flow of data is affected by heavy and uneven traffic. The mobile networks are more sensitive to delay, reliability, security, etc. Hence, there is a need for QoS strategies to reduce or overcome these sensitive issues.
This paper is organized as follows. Section 2 highlights the motivation to write this paper. Section 3 explains the QoS strategy to evaluate the performance of the network with respect to delay. Section 4 analyzes expected QoS with actual QoS and offers the outcomes. Section 5 devoted to the conclusion and future enhancements. Section 6 lists the references.
2. Motivation
This section highlights the reasons for writing this paper. The fiber optics has the data rate in Tbps, while delay and bit error rates are very low. But, in wireless networks data rate is in Mbps, while delay and bit error rates are very high [1]. Some applications are very sensitive to delay. An interactive real-time application program cannot tolerate delay. But, some applications are not sensitive to delay. For example, an e-mail can wait for a few seconds or even hours before delivery. So, the delay-sensitive applications must be given proper attention.
Optical communication technology has the potential for meeting the emerging needs of obtaining information at much faster yet more reliable rates because of its potentially limitless capabilities – huge bandwidth, low signal distortion, low power requirement and low cost [3]. The challenge is to increase the bandwidth and decrease the delay, bit error rates in wireless mobile networks.
The Global System for Mobile Communications (GSM) was started with a voice with in mind. The popularity of GSM, Internet, etc., forced GSM to look for wireless data with higher
93
bandwidth. The General Packet Radio Service (GPRS) is a step to efficiently transport high-speed data over the current GSM. The QoS requirements of typical mobile packet data applications will vary from one application to another application. For example, the QoS for real-time multimedia content is different from web browsing or email transfer. The GPRS has the following QoS parameters namely service precedence, reliability, delay and throughput [4].
The GPRS has four delay classes [1]. Delay within a GPRS network is incurred by channel access delay, coding for error correction and transfer delays in the fixed and wireless part of the GPRS network. Serious attempts to guarantee Quality of Service through network and protocol design is needed [5]. After a data transfer or a group of data transfer is over, the QoS requirements have to be validated. That is, periodically QoS requirements should be validated for correctness. A flow may not get expected QoS requirements in all the time [6]. After a flow is over, checking must be done whether that flow got expected QoS requirements or less than that.
Reliability analysis for GPRS helps to identify the cause of the reliability problem which may have occurred due to loss or duplicate or out of sequence or corruption of packets. It can also identify the combination of parameters that cause this problem. The service providers must use this technique to evaluate the performance of various applications with respect to reliability [7]. One of the applications in the Internet is telephony. It is not useful if there are long delays in the conversation [8].
QoS prediction technique can also be used to overcome QoS issues in GPRS. It is used to predict reason(s) for deterioration in the QoS [9, 16]. The ever increasing high-speed mobile networks are expected to support wide variety applications. These applications integrate several media such as text, graphics, audio, video, image, etc. These heterogeneous data and recent advances in mobile networks present complex traffic patterns and QoS requirements. Multimedia services (video call, VoIP, video streaming, instant messaging, web access, etc.) may require high restrictions in network parameters. Hence the support for QoS is necessary [10].
Applications often require a certain level of bandwidth, delay or security to work properly. Analyzing further, these applications reveals that their requirements also depend on the user's situation [11, 12]. The profiles of services are vastly different, the qualities of service demanded by these services also differ greatly [13]. Due to the diversified nature of the requirements and available services, care must be taken to improve QoS.
For mobile network operators, knowledge of their strengths and weaknesses provides the basis for identifying options to maximize revenue and business potential [14]. With the growth of mobile services, it has become very important for an operator to measure the QoS and Quality of end-user Experience (QoE) of its network accurately and improve it further in the most effective and cost-efficient way to achieve customer loyalty and maintain competitive edge [15].
Post-QoS requirements may vary from Pre-QoS requirements. Here, Post-QoS requirements refer the requirements received by a flow and Pre-QoS requirements refer the requirements needed / expected by a flow. So, there should be an efficient strategy to evaluate the performance of QoS with respect to delay in order to meet the objectives of this paper. This paper will contribute to evaluate the performance of Post-QoS.
3. A QoS Strategy
This section describes the proposed QoS strategy. In order to ensure Post-QoS requirements to match with Pre-QoS requirements, a separate table has to be maintained by
94
the gateway for each application. Various QoS requirements to improve the network performance are given below [5].
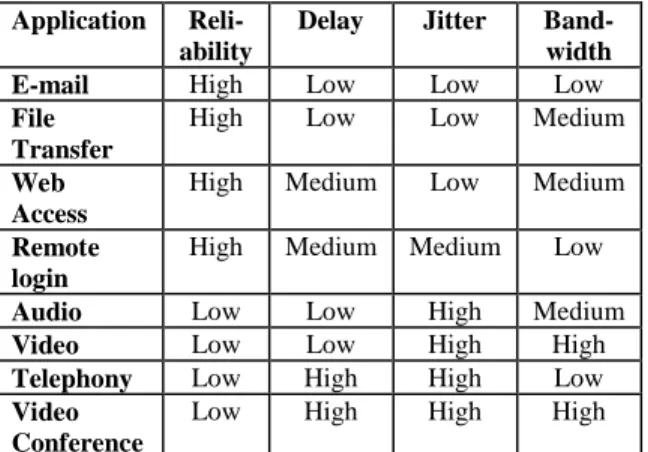
Table 1. Quality of Service Requirements
Application Reli- ability
Delay Jitter Band-width
E-mail High Low Low Low
File Transfer
High Low Low Medium
Web Access
High Medium Low Medium
Remote login
High Medium Medium Low
Audio Low Low High Medium
Video Low Low High High
Telephony Low High High Low
Video Conference
Low High High High
Table 1 shows that applications like, web access and remote login are moderately sensitive to delay. So, appropriate measures must be taken to ensure QoS. The applications like telephony and video conference are highly sensitive to delay.
Table 2. Delay classes in GPRS [1]
Where, SDU = Service Data Unit
Table 2 shows that all delays in GPRS are higher than fixed network delays. Typical round trip times (RTT) in fixed networks are in the order of 10 to 100 ms. But in GPRS the delays are in seconds. The delay class 1 could be used for very delay-sensitive applications that cannot tolerate delays. The delay class 2 can be used if the application exhibit greater delay tolerance. The class 3 is the choice for delay-insensitive applications and class 4 is unspecified and can be used in future.
3.1. Various Steps Involved in this Strategy
♦
Gateway maintains a separate table for each class.♦ Each table has four binary attributes for Mean, 95 Percentile for 128 byte and Mean, 95 Percentile for 1024 byte (eg. Mean_Small, Percentile_Small for SDU size 128 byte, Mean_Large, Percentile_Large for SDU size 1024 byte)
♦ Binary attribute means it can hold either 0 or 1. If expected requirement is met, then it is set to 1, otherwise, it is set to 0. For example, if Mean_Small of class 1 has <0.5 s
then it is set to 1. Otherwise, it is set to 0. Delay
Class
SDU size 128 byte SDU size 1024 byte
Mean 95 percentile Mean 95 percentile 1 <0.5 s <1.5 s <2 s <7 s 2 < 5 s <25 s <15 s <75 s 3 < 50 s <250 s <75 s <375 s 4 Unspecified
95
♦ After a particular data transfer is over; the QoS requirements received by an application are stored in a table.
♦ These stored values are then evaluated.
Table 3. Actual QoS Requirements (Partial)
Delay Class
SDU size 128 byte SDU size 1024 byte
Mean 95 percentile Mean 95 percentile 1 1 1 0 0 2 < 5 s <25 s <15 s <75 s 3 < 50 s <250 s <75 s <375 s 4 Unspecified
In Table 3, row 1 shows the values 1,1,0,1. It means that the flow has experienced QoS for SDU size 128 byte. For the SDU size 1024 byte, there is no QoS. The next section analyzes these issues in detail.
4. Analysis
This section takes few applications for analysis. It shows how the expected QoS requirements differ from actual QoS requirements by using graphs. Using graphs, information can be fetched to improve the various issues related to each application or reliability class and remedial measures can be taken.
The applications like telephony, video conference need delay class 1 as they are highly sensitive to delay. The applications like web access and remote login can use delay class 2 as they are moderately sensitive to delay. The applications like e-mail, file transfer, etc., can use delay class 3 as they are insensitive to delay. This section analyzes sample data transfers with respect to the delay class 1 of Mean SDU size 128 byte. Table 4 shows the value for telephony and video conference applications.
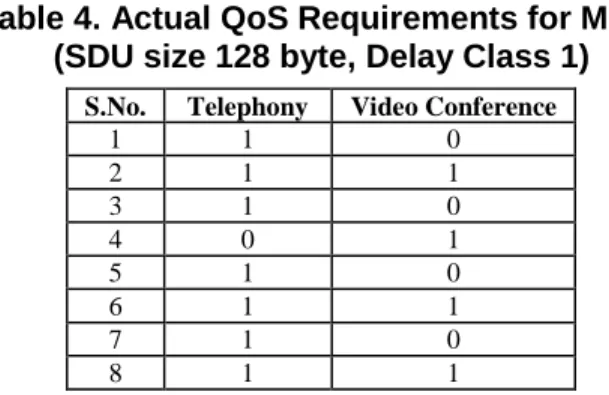
Table 4. Actual QoS Requirements for Mean (SDU size 128 byte, Delay Class 1)
Table 4 shows the delay class 1 actual QoS requirements of the telephony and video conference. It shows the Mean value for the SDU size 128 byte. It also shows the test data for eight data transfers in delay class 1. It reveals that the application, telephony has received higher QoS than the video conference. It also shows that the video conference is very oscillating. In telephony, data transfer 4 is affected. In video conference, data transfers 1, 3, 5 and 7 are affected. In other words, these data transfers have not received QoS. Here, ‘0’ indicates no QoS, ‘1’ indicates QoS.
S.No. Telephony Video Conference
1 1 0 2 1 1 3 1 0 4 0 1 5 1 0 6 1 1 7 1 0 8 1 1
96
0 2 4 6 8
No. of Data Transfer
P e rf o rm a n c e ( H ig h /L o w )
Figure 1. Telephony Application (Reliability Class 1)
0 2 4 6 8
No. of Data Transfer
P e rf o rm a n c e ( H ig h /L o w )
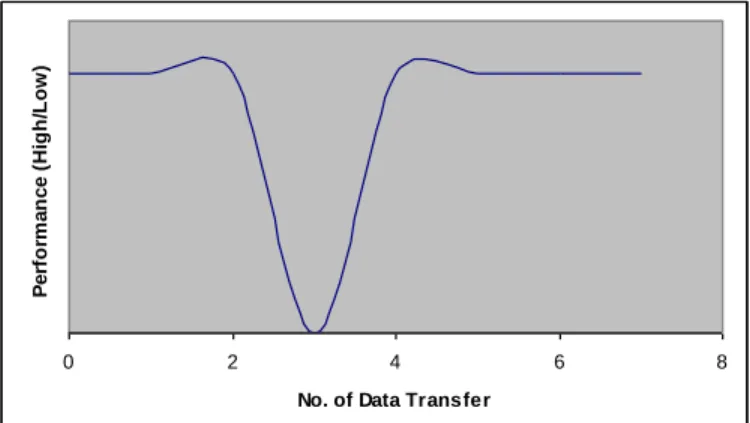
Figure 2: Video Application (Reliability Class 1)
Figure 1 shows that only one transfer has QoS problem. But, Figure 2 shows that the problem very is oscillating. It means that telephony received better QoS than video conference. Both figures show the analysis result very clearly. This is an immense help to understand and analyze the problem well. It also helps to take appropriate measures to reduce or eliminate the problem. The above figures show performance degradation graphically. The following points are outcomes of the above analysis.
♦ Figure 1 shows that telephony has experienced better QoS.
♦ Figures 1 and 2 shows video conference has been affected severely.
♦
Mechanisms responsible for video conference can be strengthened.♦ By keeping track of each flow, nodes that could not provide requirements and nodes that are misbehaving can be identified and corrected.
♦ It is possible to generate graphs for parameter-wise (Mean_Small, Mean_Percentile,
etc.), data-transfer-wise, delay-class-wise, SDU-wise, application-wise data transfers. ♦ Diversified analysis leads to better understanding.
97
5. Conclusion and Future Enhancements
In this paper, we have proposed a novel strategy and done an analysis using sample data. It helps to identify the cause of problem specifically. For example, whether the QoS problem occurs when the SDU size is 128 byte or 1024 byte; during mean delay or 95 percentile delay. It can also identify problem using combination of parameters. The service providers must use this strategy to evaluate the performance of various applications with respect to delay. Depending on the performance evaluation appropriate measures can be taken to reduce or eliminate performance degradation.
The highlights of our QoS strategy is the values are stored in binary (i.e. either 0 or 1). Certainly, this reduces memory requirements and speeds up the execution process. Though this paper has many advantages, it also has few weaknesses as well. If the analysis has to be done in diversified ways, the complexity may be increased. The outcomes of our analysis are theoretical. In future, our strategy may be simulated or implemented to experience the essence of QoS.
References
[1] J. Schiller, “Mobile Communications”, Second Edition, Pearson Education, (2003).
[2] P. C. Newton, E. G. D. P. Raj, L. Arockiam and R. H. Prasath, “NPASA: A Noble Path Selection Algorithm”, Proceedings of International Symposium on Computer Science and its Applications, IEEE CS, (2008)
October 13-15, Australia, pp. 52-55.
[3] F. Palmieri, “GMPLS Control Plane Services in the Next-Generation Optical Internet”, The Internet Protocol Journal, vol. 11, no. 3, (2008), pp. 2- 18.
[4] A. K. Talukder and R. Yavagal, “Mobile Computing”, Tata McGraw-Hill, (2005). [5] A. S. Tanenbaum, “Computer Networks”, Fourth Edition, (2005).
[6] P. C. Newton, “A Contemporary Technique to Guarantee Quality of Service (QoS) for Heterogeneous Data Traffic”, Proceedings of the International Conference on Information Security and Assurance, IEEE CS,
(2008) October 13-15, Australia, pp. 210 – 213.
[7] P. C. Newton and L. Arockiam, “Reliability Analysis for General Packet Radio Service with Quality of Service Support”, International Journal of Wireless Communication, (2009), pp. 79-83.
[8] B. A. Forouzan, “Data Communications and Networking”, Third Edition, Tata McGraw-Hill, (2004). [9] P. C. Newton and L. Arockiam, “A Quality of Service Prediction Technique to Overcome Reliability Problem
in General Packet Radio Service”, Proceedings of National Conference on Advanced Computing, (2009), India, pp. 63-67.
[10] A. Hernández, M. Álvarez-Campana, E. Vázquez and V. Olmedo, “The IP Multimedia Subsystem (IMS) Quality of service and performance simulation”, 14th HP Software University Association Workshop (HP-SUA 2007), (2007) July 8-11, Germany.
[11] M. Danzeisen, T. Braun, D. Rodellar and S. Winiker, “Heterogeneous Communications Enabled by Cellular Operators”, IEEE Vehicular Technology Magazine, vol. 1, no. 1, (2006), pp. 23-30.
[12] A. Anskaitis, D. Gursnys, L. Pavilanskas and A. Kajackas, “Estimation of QoS Dynamics in the Wireless Networks”, Proceedings of the 4th Management Committee Meeting, (2005) October 13-14, Germany. [13] F. Hu and N. K. Sharma, “Priority-Determined Multiclass Handoff Scheme with Guaranteed Mobile QoS in
Wireless Multimedia Networks”, IEEE Transactions on Vehicular Technology, vol. 53, no. 1, (2004), pp. 118-135.
[14] J. C. Francis and M. Abu El-Ata, “Benchmarking Mobile Network QoS”, Proceedings of the 36th Hawaii International Conference on System Sciences, (2002), IEEE CS.
[15] D. Soldani, “Means and Methods for Collecting and Analyzing QoE Measurements in Wireless Networks”, Proceedings of the International Symposium on a World of Wireless, Mobile and Multimedia Networks,
98
[16] P. C. Newton and L. Arockiam, “A Novel Prediction Technique to Improve Quality of Service (QoS) for Heterogeneous Data Traffic”, Journal of Intelligent Manufacturing, vol. 22, no. 6, (2011), Springer Netherlands, pp. 867-872.
Authors
Dr. P. Calduwel Newton is basically a physically challenged person presently working as an Assistant Professor in Computer Science at Bishop Heber College (Autonomous), Tiruchirappalli, Tamil Nadu, India. He has delivered lectures on computer network-related topics and on motivation in various institutions. He has presented / published 36 papers in the International, National and State Level conferences/ journals. His research papers are published by IEEE Computer Society and Springer journals. He has visited Malaysia, Korea, Australia, Singapore, Sri Lanka and China. His research interests are: Quality of Service (QoS) in mobile networks and other related topics. He can be reached at calduwel@yahoo.com.
Dr. L. Arockiam is working as an Associate Professor in the Department of Computer Science, St.Joseph’s College (Autonomous), Tiruchirappalli, Tamil Nadu, India. He has published many research articles in the International/National Conferences/Journals. He is the Principal Investigator for major and minor research projects. He has chaired many technical sessions and delivered invited talks in National and International Conferences. He has authored a book on “Success through Soft Skills”. He has visited Rome and Indonesia. His research
interests are: Software Measurement, Cognitive Aspects in
Programming, Web Mining and Mobile Networks. He can be contacted at larockiam@yahoo.co.in.