Radio Advertising Market
Research
Assessment of the constraints on the price of direct
and indirect radio advertising
Contents
Section
Page
1
Executive Summary
1
2
Introduction 3
3
Background to radio advertising
6
4
Trading radio advertising
11
5
Direct and indirect radio advertising market definition
17
6
Method of analysis
20
7
Competitive constraints on direct radio advertising
27
8
Competitive constraints on indirect radio advertising
49
Annex
Page
1
Inclusion of additional gain in revenue from partial switchers to
other media
68
2
Different values for the average budgets
70
3
Different number of partial and full switchers
72
4
Magnitude of price increase imposed
76
5
Inclusion of cost savings from reduced royalty and licence fee
payments 78
6
Inclusion of cost savings from reduced advertising sales activity 80
7
Profitability analysis
85
8
Calculation of cost savings from reduced indirect radio
advertising sales activity
92
9
Comparison of spend profiles between survey switchers and full
survey sample for sample of direct radio advertisers
95
Market Research Report - Harris Interactive (published separately) Market Research Report - Human Capital (published separately)
Section 1
1
Executive Summary
1.1 Ofcom is the independent regulator and competition authority for the UK communications industries. Ofcom undertook this research to develop its
understanding of the radio advertising industry and the competitive constraints faced by suppliers of radio advertising airtime. In particular Ofcom was interested in
understanding the extent to which pricing in radio advertising markets appears to be affected by other media.
1.2 The Competition Commission last examined the provision of radio advertising in May 2003. Since this time the radio and advertising industry has developed in a number of ways which may have affected the competitive landscape. These developments include:
• a decline in commercial radio advertising revenue;
• the BBC’s increased market share of radio listening;
• the growth in DAB digital radio penetration;
• online and outdoor advertising growth; and
• a decline in press circulation.
This research allows Ofcom to examine the radio advertising industry in the light of these changes.
1.3 Ofcom conducted a survey based programme of qualitative and quantitative
research. The research allowed Ofcom to analyse which media appear to impose the strongest competitive constraint on the pricing of radio advertising. In addition, it outlines the drivers of demand for radio advertising, the decision-making process for media purchasing, advertisers’ attitudes towards radio in the context of other media options, and the impact on the demand for radio advertising following an increase in the relative price of radio advertising.
1.4 In its submissions to the OFT in relation to recent radio mergers, Ofcom has defined two separate radio advertising markets; direct and indirect.
• Direct radio advertising occurs where the advertiser purchases airtime by approaching the sales teams at individual radio stations separately.
• Indirect radio advertising occurs where an advertiser uses a media buying agency to manage its purchase of advertising on radio stations via a radio group’s advertising sales house.
In this research the constraints faced by suppliers of direct radio advertising and indirect radio advertising have been assessed separately.
1.5 Findings from the analysis of direct radio advertising include:
• The pricing of direct radio advertising appears to be constrained by press advertising. As a result, a hypothetical monopoly supplier of direct radio
advertising would not find it profitable to raise prices by 5-10% for a sustained period of time. This result appears to be robust to a range of sensitivity analyses.
• Evidence suggests that direct radio advertisers perceive radio and press advertising as interchangeable.
1.6 Findings from the analysis of indirect radio advertising include:
• Television, online and press advertising pose the strongest competitive constraints on the pricing of indirect radio advertising.
• An increase in the price of indirect radio advertising would result in media buying agencies moving budgets away from radio to a range of alternative media. These alternative media taken together appear to collectively constrain the pricing of indirect radio advertising. As a result, a hypothetical monopoly supplier of indirect radio advertising would not find it profitable to raise prices by 5-10% for a
sustained period of time.
• Media buying agencies appear to have a degree of countervailing buyer power, and therefore, would be likely to try and negotiate down any attempted increase in the price of indirect radio advertising.
1.7 The conclusions of this study are intended to act as a starting point for Ofcom in cases where an understanding of the radio advertising industry and the competitive constraints faced by radio advertising is required. In the context of a complaint, dispute, market review or in providing submissions to the OFT in relation to mergers the precise scope of the relevant product and geographic market would need to be assessed based on the specific circumstances and facts of the particular case in question.
Section 2
2
Introduction
2.1 Ofcom is the sectoral regulatory authority for the radio industry. As sectoral regulator, Ofcom has a number of competition related functions and duties:
2.1.1 Ofcom has concurrent powers with the OFT under the Competition Act 1998 (the "Competition Act") to deal with anti-competitive agreements and conduct by applying Article 81 and Article 82 of the EC Treaty and the Chapter I and Chapter II prohibitions of the Competition Act;
2.1.2 Ofcom also has powers to make a market investigation reference to the Competition Commission where it has reasonable grounds for suspecting that a feature or combination of features of the market in the UK prevents, restricts or distorts competition;
2.1.3 In addition, Ofcom has powers to use conditions in various licences under the Broadcasting Act 1990 and 1996 (the "Broadcasting Acts") to ensure fair and effective competition in the provision of licensed services and connected services;
2.1.4 More generally, Ofcom has a number of duties under the Communications Act 2003. It is Ofcom's duty to further the interests of consumers in relevant markets where appropriate by promoting competition, and to have regard in carrying out its duties to a number of elements as relevant in the
circumstances, including the desirability of promoting competition in the relevant markets; and
2.1.5 Although the OFT has responsibility for merger control in the UK, Ofcom may also be asked by the OFT to provide it with Ofcom’s views on a merger or proposed merger in areas where Ofcom has sector specific knowledge.
2.2 It is important for Ofcom to have a strong evidence base for all areas of its remit. Hence Ofcom has undertaken this study in order to allow it to develop a robust, evidence-based understanding on how purchasing decisions regarding advertising in radio are made, what factors influence that decision and the extent to which pricing in radio advertising markets appears to be constrained by other media.
2.3 In order to understand these issues, Ofcom undertook a detailed, survey-based programme of qualitative and quantitative research.1 The research sought to understand the drivers of demand for radio, the media purchase decision-making process, the attitudes towards radio in the context of other media, and the extent to
1
In the absence of available market data on pricing and switching, the analysis has been conducted using evidence from a market research survey. The SSNIP (small but significant non-transitory increase in price) test methodology adopted by Ofcom necessitated asking respondents what their reactions would be to a hypothetical industry-wide price increase. Survey responses given to hypothetical questions should be treated with caution and the methodological limitations of Ofcom’s approach are set out in section 7.9. The results are presented acknowledging this fact. The research also measured attitudes and behaviours of radio advertising purchasers, which appear to be
consistent with responses given to the SSNIP test questions. In conducting analysis in the context of a specific case, Ofcom would ideally where possible seek to use available information on actual switching behaviour alongside any survey results.
which other media constrain the price of radio advertising, including how advertisers and media buyers (on behalf of their advertising clients) would react to an increase in the relative price of radio advertising. The research gathered the data required to allow Ofcom to analyse what media appear to impose the strongest competitive constraint on the pricing of radio.2
2.4 The provision of radio advertising was last examined by the Competition Commission in May 2003 in the context of the proposed merger between Scottish Radio Holdings plc, GWR Group plc and Galaxy Radio Wales and the West Ltd3 and more recently by the OFT in the context of the proposed merger between Capital Radio plc and GWR Group plc4 in December 2004 and the acquisition by Emap plc of Scottish Radio Holdings plc5 in August 2005. Ofcom has taken the opportunity to undertake this project outside the context and associated statutory time limits of a merger investigation, enabling Ofcom to conduct its research and analysis over a longer timeframe.
2.5 The radio advertising industry in the UK has undergone a number of developments since the Competition Commission last examined the provision of radio advertising in May 2003 which may have contributed to a change in the competitive landscape. Some of the key factors include, but are not limited to:
2.5.1 the increasing listening share of the BBC relative to the commercial radio sector;
2.5.2 a decline in commercial radio advertising revenue;
2.5.3 the increasing development and penetration of DAB digital radio; 2.5.4 the growth in online and outdoor advertising; and
2.5.5 a decline in press circulation.
2.6 The conclusions contained in this report are intended to constitute Ofcom’s starting point in cases where an understanding of the competitive constraints faced by radio advertising is required - whether in the context of a complaint, dispute, market review or in providing submissions to the OFT in relation to mergers. The conclusions do not propose to define the boundaries of the relevant product market. The precise scope of the relevant product market for direct and indirect radio advertising would need to be assessed based on the specific facts and circumstances of the particular case being examined.
2
We have analysed the constraint imposed on the pricing on radio by other media by applying the hypothetical monopolist test. This test is a useful economic tool which considers whether a
hypothetical monopolist supplier of the product or group of products in question (in the present case radio advertising airtime) would find it profitable to raise prices by a small but significant proportion for a sustained period of time. If this course of action is shown to be unprofitable for the hypothetical monopolist, this suggests that the product or group of products in question place a competitive constraint on the price of radio advertising airtime. This test is also known as the SSNIP test (small but significant non-transitory increase in price). This is further explained in section 5.1.
3
The Competition commission report can be found at: http://www.competition-commission.org.uk/rep_pub/reports/2003/479radio.htm
4
The OFT decision can be found at: http://www.oft.gov.uk/NR/rdonlyres/5BCB63D8-3F5F-47AD-B5BE-63834E977AFC/0/capital.pdf
5
The OFT decision can be found at: http://www.oft.gov.uk/NR/rdonlyres/0A5349EE-0001-454A-860F-C4E03326F0F9/0/Emap.pdf and Ofcom’s statutory assessments can be found at:
2.7 This report does not assess the constraints faced by suppliers of radio advertising in one area from suppliers of radio advertising and other forms of media in different geographic areas. The constraints faced by suppliers of radio advertising from suppliers of radio advertising in other areas and from alternative media may vary across the country and across regions. This report does not attempt to reach a view on the scope of the relevant geographic market.
2.8 A view on the product and geographic scope of the relevant market will, of course, need to be formed on a case by case basis by reference to the specific facts or circumstances of the particular case at hand.
2.9 Throughout this report a distinction is made between the two distinct methods
through which radio advertising is sold: direct (or local) radio advertising, and indirect (or national) radio advertising. Direct advertising refers to the situation where the advertiser purchases airtime by approaching the sales team at each individual station, separately station by station. Indirect advertising refers to the situation where an advertiser employs the services of a media buying agency to manage its
purchases of advertising on individual stations or clusters of stations, purchasing this airtime through a single point of sale (the radio group’s advertising sales house). 2.10 The rest of this report is structured as follows:
2.10.1 Section 3 provides a background description of radio advertising; 2.10.2 Section 4 describes how trading in radio advertising takes place;
2.10.3 Section 5 sets out the arguments why direct and indirect radio advertising are in separate relevant product markets;
2.10.4 Section 6 describes Ofcom’s method of analysis;
2.10.5 Section 7 sets out Ofcom’s approach and findings from the quantitative ‘hypothetical monopolist’ test analysis in respect of direct radio advertising, combined with the findings from other quantitative and qualitative survey evidence; and
2.10.6 Section 9 presents the same analysis as Section 8 but in relation to indirect radio advertising.
2.10.7 The appendices contain some of the detail of Ofcom’s hypothetical
monopolist test analysis conducted for direct and indirect radio advertising. 2.10.8 The market research reports based on the surveys conducted by
independent market research consultancies are included as supporting documents. Supporting document volume 1 contains Harris Interactive’s market research report on direct and indirect radio advertising. Supporting document volume 2 contains Human Capital’s market research report of indirect advertising.
Section 3
3
Background to radio advertising
3.1. Brief overview of the advertising industry
3.1 Advertising is an important market as it constitutes one of the major means of funding for the media industry. The advertising industry also plays an important role in the economy, as it provides one of the means for companies in different sectors to compete with each other for consumer spend.
3.2 Total advertising expenditure has increased over time, and it now constitutes a non-negligible share of UK GDP. In 2005, total advertising expenditure was almost £18 billion6, or around 1.6% of GDP.
3.3 Although press and TV remain the two major media in terms of total advertising expenditure, the mix of advertising media has been changing over time and new media have come into play.
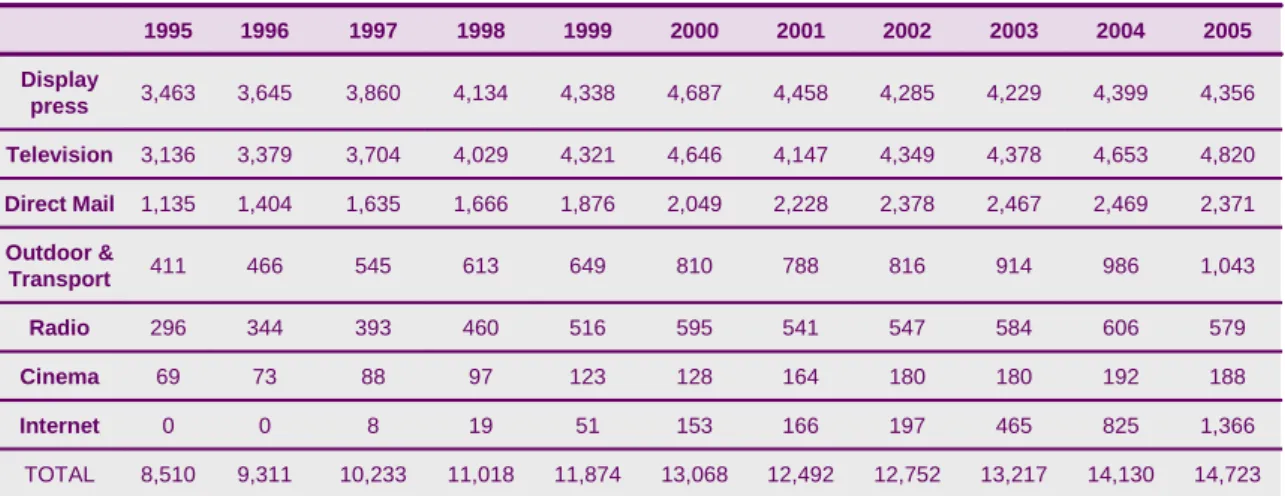
3.4 As shown in Table 1 below, media such as direct mail, outdoor, radio and cinema have gained market share of total display advertising expenditure to the detriment of press and TV advertising. Internet advertising, which first appears in advertising statistics in the second half of the 1990s, has experienced very strong growth.
Table 1: Total display advertising7 expenditure in the UK, percentage of UK total
Source: Advertising statistics yearbook 2006 Note: includes production costs
3.5 On the supply side, there is a range of market players. While some players are only present in one medium, others have interests across different media (e.g. Emap across press and radio).
3.6 On the demand side, advertising is purchased by businesses across different sectors of the economy and products, such as consumables, durables, retail, government or services markets.
6
At current prices, including display and classified advertising, and production costs. Total advertising expenditure excluding classified advertising and including production costs was over £13 billion in 2005.
7
The Advertising Association defines display advertising as all advertising excluding press classified advertising. 9.3% 5.8% 3.5% 1.5% 1.3% 1.2% 0.4% 0.2% 0.1% 0.0% 0.0% Internet 7.1% 7.0% 6.9% 6.4% 6.3% 6.2% 5.5% 5.6% 5.3% 5.0% 4.8% Outdoor & Transport 3.9% 4.3% 4.4% 4.3% 4.3% 4.6% 4.3% 4.2% 3.8% 3.7% 3.5% Radio 1.3% 1.4% 1.4% 1.4% 1.3% 1.0% 1.0% 0.9% 0.9% 0.8% 0.8% Cinema 100% 17.8% 33.2% 35.7% 2001 100% 18.6% 34.1% 33.6% 2002 100% 18.7% 33.1% 32.0% 2003 100% 17.5% 32.9% 31.1% 2004 100% 15.8% 36.4% 36.5% 1999 100% 15.7% 35.6% 35.9% 2000 100% 15.1% 36.3% 39.1% 1996 100% 13.3% 36.9% 40.7% 1995 TOTAL Direct Mail Television Display press 100% 15.1% 36.6% 37.5% 1998 16.1% 16.0% 32.7% 36.2% 29.6% 37.7% 100% 2005 100% 1997 9.3% 5.8% 3.5% 1.5% 1.3% 1.2% 0.4% 0.2% 0.1% 0.0% 0.0% Internet 7.1% 7.0% 6.9% 6.4% 6.3% 6.2% 5.5% 5.6% 5.3% 5.0% 4.8% Outdoor & Transport 3.9% 4.3% 4.4% 4.3% 4.3% 4.6% 4.3% 4.2% 3.8% 3.7% 3.5% Radio 1.3% 1.4% 1.4% 1.4% 1.3% 1.0% 1.0% 0.9% 0.9% 0.8% 0.8% Cinema 100% 17.8% 33.2% 35.7% 2001 100% 18.6% 34.1% 33.6% 2002 100% 18.7% 33.1% 32.0% 2003 100% 17.5% 32.9% 31.1% 2004 100% 15.8% 36.4% 36.5% 1999 100% 15.7% 35.6% 35.9% 2000 100% 15.1% 36.3% 39.1% 1996 100% 13.3% 36.9% 40.7% 1995 TOTAL Direct Mail Television Display press 100% 15.1% 36.6% 37.5% 1998 16.1% 16.0% 32.7% 36.2% 29.6% 37.7% 100% 2005 100% 1997
3.7 The media choice of advertisers appears to be driven by four key factors: 3.7.1 the campaign objectives;
3.7.2 the ability of individual media to reach the target audience;
3.7.3 the media coverage/reach (e.g. whether specific geographic reach or national); and
3.7.4 the campaign budget.
3.8 Ability to reach the target audience and suitability to campaign objectives appear from the research to be the two major drivers for the choice of media. Campaign objectives can dictate target audience, geographic coverage and budget. Budget is not always a primary consideration for advertisers (although it can be for smaller businesses), although the media must be cost-effective.8
3.2. Overview of radio advertising
Trends in radio advertising spend
3.9 As shown in Table 1 above, radio accounts for a small share of total advertising expenditure (just under 4%) following consistent increases in radio’s share of total display advertising expenditure in the late 1990s. Table 2 below shows that between 1995 and 2005, radio advertising revenues more than doubled, growing from £296 million to £579 million.9
Table 2: Total display advertising10 expenditure in the UK, £million
Source: Advertising statistics yearbook 2006 Note: includes production costs
The supply of radio advertising
3.10 The number of commercial radio stations has almost doubled in the last ten years. There were 280 analogue commercial radio stations in 2005. However, a degree of consolidation has also taken place over the last few years, notably with the mergers
8
Supporting document vol 1. For a description of the methodology of this research see section 6.
9
The Advertising Statistics Yearbook 2006, current prices.
10
The Advertising Association defines display advertising as all advertising excluding press classified advertising. 1,366 825 465 197 166 153 51 19 8 0 0 Internet 1,043 986 914 816 788 810 649 613 545 466 411 Outdoor & Transport 579 606 584 547 541 595 516 460 393 344 296 Radio 188 192 180 180 164 128 123 97 88 73 69 Cinema 12,492 2,228 4,147 4,458 2001 12,752 2,378 4,349 4,285 2002 13,217 2,467 4,378 4,229 2003 14,130 2,469 4,653 4,399 2004 11,874 1,876 4,321 4,338 1999 13,068 2,049 4,646 4,687 2000 9,311 1,404 3,379 3,645 1996 8,510 1,135 3,136 3,463 1995 TOTAL Direct Mail Television Display press 11,018 1,666 4,029 4,134 1998 2,371 1,635 4,820 3,704 4,356 3,860 14,723 2005 10,233 1997 1,366 825 465 197 166 153 51 19 8 0 0 Internet 1,043 986 914 816 788 810 649 613 545 466 411 Outdoor & Transport 579 606 584 547 541 595 516 460 393 344 296 Radio 188 192 180 180 164 128 123 97 88 73 69 Cinema 12,492 2,228 4,147 4,458 2001 12,752 2,378 4,349 4,285 2002 13,217 2,467 4,378 4,229 2003 14,130 2,469 4,653 4,399 2004 11,874 1,876 4,321 4,338 1999 13,068 2,049 4,646 4,687 2000 9,311 1,404 3,379 3,645 1996 8,510 1,135 3,136 3,463 1995 TOTAL Direct Mail Television Display press 11,018 1,666 4,029 4,134 1998 2,371 1,635 4,820 3,704 4,356 3,860 14,723 2005 10,233 1997
between GWR/Capital and Emap/SRH. Therefore, audiences today are more fragmented across radio stations (but not across radio groups).
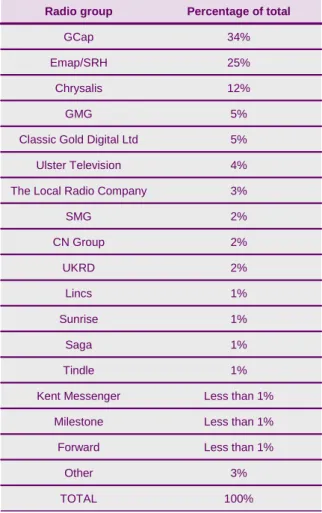
3.11 The major radio groups in the UK by share of radio advertising revenues are GCap, Emap/SRH and Chrysalis. As shown in table 3 below, together they account for almost 75% of UK radio advertising revenues.
Table 3: Share of UK radio advertising revenues 2005*
*Based on gross broadcasting revenue (GBR) Source: Ofcom
3.12 Commercial radio stations derive the majority (around 86%)11 of their total revenues from the sale of airtime to advertisers and sponsors. As shown in table 4, advertising airtime sales account for approximately 86% of total net advertising revenue (NAR), with the remainder mostly accounted for by sponsorship and promotions.
11
Source: Ofcom
2% CN Group
2% UKRD
1% Lincs
1% Sunrise
1% Saga
1% Tindle
Less than 1% Kent Messenger
Less than 1% Milestone
Less than 1% Forward
3% Other
100% TOTAL
2% SMG
3% The Local Radio Company
5% GMG
5% Classic Gold Digital Ltd
4% Ulster Television
12% 25% 34%
Percentage of total
Chrysalis Emap/SRH
GCap
Radio group
2% CN Group
2% UKRD
1% Lincs
1% Sunrise
1% Saga
1% Tindle
Less than 1% Kent Messenger
Less than 1% Milestone
Less than 1% Forward
3% Other
100% TOTAL
2% SMG
3% The Local Radio Company
5% GMG
5% Classic Gold Digital Ltd
4% Ulster Television
12% 25% 34%
Percentage of total
Chrysalis Emap/SRH
GCap
Table 4: Commercial radio station net advertising revenues
Source: Ofcom
NAR = Net advertising revenue
3.13 Commercial production revenues are a very small proportion of the industry total.12 3.14 Ofcom does not regulate the amount of airtime that radio stations can offer to
advertisers. However, standard industry practice involves setting a “ceiling” for the number of minutes of advertising to be broadcast per hour: 9-12 minutes per hour is standard across the industry (although recently GCap has reduced the supply of radio advertising minutage by up to half on its London’s station Capital FM). This ceiling is driven by listeners’ reluctance to tolerate too much advertising, especially given the constraint imposed by the BBC which airs no advertising. This ceiling includes minutes of sponsorship and promotion airtime as well as “traditional” advertising.
3.15 Radio stations sell advertising airtime in two ways: either on a cost per thousand (CPT) basis, or as “spot” advertising. CPT refers to the cost for each thousand people that hear a 30 second advertisement at a certain time (e.g. a cost for each thousand people that hear a 30 second advertisement during next Monday’s breakfast show). Stations also sell spot advertising which gives a total cost to a particular period of airtime (e.g. 30 seconds during next Monday’s breakfast show). 3.16 Sponsorship and promotion (S&P) are relatively new commercial activities in radio.
Industry revenue from these sources is growing quickly. Sponsorship tends to involve a higher level of presenter participation than is the case for traditional advertising. As a result, sponsorship tends to build a stronger relationship with the audience, and is often used by large advertisers on a long-term basis for brand building purposes. Promotions tend to be much shorter, typically lasting for a week or a weekend, and are more focused on immediate sales generation. S&P tends to be sold on the same basis as standard advertising, either on a CPT or spot basis.
3.17 While analogue radio generates the majority of commercial radio advertising
revenues13, the digital radio advertising market is still in its infancy, given the current relatively low listenership to digital services. However, the industry expects that revenues from digital services will increase over the coming years once penetration of digital radio sets and listening to digital services reach higher levels. Digital radio advertising is bought and sold on the same basis as analogue radio advertising. RAJAR14 captures all listening without differentiating between listening on analogue or digital. Consequently for many stations, analogue and digital radio advertising are effectively being sold together.
12
RAB, July 2004
13
In 2005, national and non-national commercial analogue radio net advertising revenues accounted for around £440 million while digital only net advertising revenues accounted for less than £4 million (source: Ofcom).
14
RAJAR (Radio Joint Audience Research Limited) is a company that operates a single audience measurement system for the UK radio industry – BBC, UK licenced and other commercial stations.
100% 16% 84%
2003
100% 16% 84%
2004
Total NAR
Sponsorships & Promotions Advertising revenues
100% 14% 86%
2005
100% 16% 84%
2003
100% 16% 84%
2004
Total NAR
Sponsorships & Promotions Advertising revenues
100% 14% 86%
The demand for radio advertising
3.18 Radio advertisers range across different sectors of the economy. In 2005, the top radio spending sectors were motors, entertainment and media, and retail15.
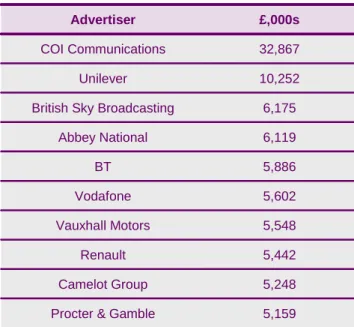
3.19 Radio advertisers also range in size from the Central Office of Information (COI) and Procter and Gamble who spend millions of pounds every year on radio advertising, to small local advertisers who spend less than one hundred pounds per year.
3.20 Table 5 below shows the radio advertising expenditure of the top ten radio
advertisers in 2005. The top ten radio advertisers accounted for over 15% of total radio advertising expenditure in 2005.
Table 5: Top 10 radio advertisers in 2005
Source: Advertising Statistics Yearbook 2006
3.21 Evidence from the Harris Interactive and Human Capital market research reports (see supporting documents vol 1 and vol 2) suggests that radio’s major distinctive characteristics appear to be its wide audience/high penetration and its ability to be target specific audience demographics and/or specific geographic regions. Other appealing characteristics include, among others, the frequency of opportunities to hear, the instant impact, the status symbol for local companies or the speed, short lead times and relatively low cost of advertising production.16 The potential drivers of demand for radio advertising set out above are explored in more detail in the
15
Advertising Statistics Yearbook 2006
16
Supporting document vol 1 and supporting document vol 2. For a description of the methodology of this research see section 6.
5,248 Camelot Group
5,159 Procter & Gamble
5,442 Renault
5,548 Vauxhall Motors
6,119 Abbey National
5,886 BT
5,602 Vodafone
6,175 10,252 32,867
£,000s
British Sky Broadcasting Unilever COI Communications
Advertiser
5,248 Camelot Group
5,159 Procter & Gamble
5,442 Renault
5,548 Vauxhall Motors
6,119 Abbey National
5,886 BT
5,602 Vodafone
6,175 10,252 32,867
£,000s
British Sky Broadcasting Unilever COI Communications
Section 4
4
Trading radio advertising
4.1. Direct and indirect radio advertising
4.1 There are two principal routes to market for advertisers seeking to purchase radio advertising airtime:
4.1.1 “direct advertising”, where an advertiser approaches the sales team at each individual station, separately station by station. The industry typically refers to this type of purchase as “local advertising” as it is the approach generally used by local advertisers who wish to advertise on one or a small number of specific local stations.
4.1.2 “indirect advertising”, where an advertiser employs the services of a media buying agency to manage its purchases of advertising on individual stations or clusters of stations, purchasing this airtime through a single point of sale17 (the radio group’s advertising sales house). This is called “national advertising” by the industry as it is the method typically used by large advertisers who wish to advertise their product generally to customers across large parts of the country.
Market size – direct and indirect radio advertising
4.2 Indirect radio advertising accounts for a larger share of total radio advertising revenues than direct advertising. Table 6 below shows the split of radio advertising revenues for direct and indirect radio advertising.
Table 6: Direct and indirect radio advertising – net advertising revenues* (NAR)
Source: Ofcom
* Net advertising revenue excludes S&P and commissions
4.2. The sale and purchase of radio advertising airtime
4.3 Figure 1 is a stylised representation of the process by which radio advertising is sold. The role of each element in the process is discussed in greater detail below.
17
Though it should be noted that the advertiser will generally still pay a different price for airtime on each individual station that it buys from.
100% 61% 39%
2003
100% 61% 39%
2004
TOTAL Indirect NAR
Direct NAR
100% 63% 37%
2005
100% 61% 39%
2003
100% 61% 39%
2004
TOTAL Indirect NAR
Direct NAR
100% 63% 37%
Figure 1: The radio advertising sales process
Source: Ofcom
The advertiser
4.4 The advertiser is the primary source of a radio station’s income. As explained in paragraph 3.19, radio advertisers range substantially in size. Table 5 in Section 3 shows the advertising spend for the top 10 radio advertisers in 2005.18
4.5 As described above, direct advertisers will tend to deal directly with their local radio station. Indirect advertisers will tend to employ the services of an advertising agency to manage their purchases of advertising on individual radio stations or clusters of stations, who would then purchase the airtime through the radio group’s advertising sales house.19
4.6 Advertisers determine their overall advertising budget. Direct advertisers also decide how much of it they wish to spend on radio. For indirect advertisers this decision is likely to be made jointly with, or solely by the planners at an advertising agency, although some indirect advertisers will have more influence on the media mix than others.
Creative agencies
4.7 Indirect advertisers typically employ the services of creative agencies to take a lead role in developing the creative and branding strategy for an advertising campaign as well as designing and producing the advertisement. Creative agencies may also contribute to the formulation of an advertising client’s media strategy, together with
18
Table 5 shows that the Central Office of Information and Proctor and Gamble spent £33million and £5 million in 2005 respectively.
19
The above does not hold true in all cases for national advertisers. In some cases, even though a large advertiser may use an agency to purchase the airtime, it may also have a direct relationship with a radio group’s sales house. For example, the sales house may pitch for business direct to an
advertiser, who will then use a media buying agency to purchase the airtime from the sales house. Media Buying Agency
•
Media Planning•
Media buyingAdvertiser
Creative Agency
•
Creative strategy•
Design andproduction of advert Radio Group Sales
House
Direct advertising
Indirect advertising
Radio Station
•
Airtime•
Production of advertRadio Station
•
Airtimethe media planners at media buying agencies, where certain creative ideas work better in one medium than another.
Media buying agencies
4.8 Indirect advertisers also generally appoint the services of a media buying agency to ensure that all elements of its advertising campaign are delivered in the most cost-effective way. The advertising client typically issues a media brief to the selected agency who responds with a media plan capable of satisfying the campaign objectives and a proposal for executing this plan in the most cost-effective way by buying the most appropriate media mix. Account executives and media planners liaise with the client and offer specialist advice and expertise as to how the client’s campaign objectives and target audience can be most effectively delivered. This typically includes advice as to the mix of advertising spend on different media. The relative levels of influence exercised by the client and the media buying agencies differ depending on the size, budget and sophistication of the advertiser with larger advertisers typically playing a greater role in the development of the media strategy and decision on the media mix. The process is iterative and subject to ongoing revisions and amendments to reflect changing market conditions.
4.9 Factors influencing the chosen media mix include, but are not limited to: 4.9.1 the campaign objectives;
4.9.2 the target audience;
4.9.3 the target geographic coverage; 4.9.4 the client business requirements; 4.9.5 the product type;
4.9.6 the relative prices of different media; and
4.9.7 the availability and characteristics of different media.
4.10 Once a media mix has been chosen, media buyers purchase advertising from media providers. Many agencies have Heads of particular media, who are responsible for the purchase of advertising and who typically negotiate agency-wide, client-specific or ad-hoc campaign by campaign deals with media providers where the agency enters into such agreements. In some agencies, the Heads of particular media are asked to provide advice by account executives and media planners before a final decision on the media mix is reached.
4.11 The overall media mix for a media buying agency is based on the sum of media mixes for all the individual campaigns across that agency’s portfolio of clients.
4.12 Media buying agencies may also in some cases contribute to the development of the advertising client’s creative strategy.
4.13 The formulation of media and creative strategies is therefore typically a collaborative exercise involving the indirect advertiser, the creative agency and the media buying agency.
4.14 As discussed above, smaller advertisers are unlikely to have the option of using a creative and/or media buying agency. This is for two reasons. First, it is not generally economically viable for agencies to take on the business of smaller, local advertisers as they commit relatively lower budgets towards media advertising than larger, national advertisers. Second, agencies tend to enter into advertising deals that are more sophisticated than the typical needs and requirements of smaller advertisers.
The sales house
4.15 A radio sales house is a single point of contact from which the radio group sells the airtime of a number of stations. The media buyer may buy airtime on one or more of the stations represented by the sales house. This provides convenience and a level of sophistication for a media buyer, and provides the individual radio station with more bargaining power than it would have if it sold advertising separately. A number of sales houses (such as GCap’s Opus) sell advertising on behalf of third party stations in addition to that of their own stations.
The radio station
4.16 A radio station can sell airtime on its own behalf, or its airtime can be sold from a central sales house (if a relationship exists either within the group or externally). As discussed above, smaller local advertisers are likely to demand spot advertising, and are more likely to deal directly with individual stations. Individual radio stations have their own sales staff and may also have some in-house creative staff. This provides the stations with flexibility and allows them to simplify the radio advertising process for smaller or less sophisticated advertisers as they can offer them a complete radio advertising solution, including for example the production of the advertisement, at one point of contact. Larger advertisers usually purchase airtime through media buying agencies, and therefore have no direct relationship with the individual radio station.
4.3. Pricing of radio advertising
4.17 The radio advertising price-setting process is relatively complex. Most radio groups or stations publish a form of “rate card” setting out list prices and reflecting differing levels of demand for particular stations and particular time periods. Although the structure of the rate card varies across the industry, there are a number of common demand factors which tend to be reflected in the rate card. These are:
4.17.1 station or grouping of stations; 4.17.2 season or month;
4.17.3 day of week; 4.17.4 time of day; and 4.17.5 early or late booking.
4.18 The amount paid for a slot on a station or grouping of stations will vary according to a number of factors including the size of the audience (as tracked and measured by RAJAR); the level of demand for advertising in the relevant catchment area (or Measured Coverage Area (MCA)); and the particular demographic that a station is targeting. Although over 90% of advertising airtime is traded on the basis of “all
adults”20, in practice the demographics of a particular station’s listenership will have an influence over the price charged for that station’s advertising airtime. For example, a station that targets a particular demographic which is highly valued by advertisers, would be likely to command higher advertising prices for that specific demographic than a station targeting all adults.
Negotiation of discounts on published rate card prices
4.19 While rate card prices are published by radio stations and radio sales houses and are therefore available as a source of information on prices, the rate card prices are not the actual prices paid by advertisers for radio airtime.21 This is because discounts off the rate card price are generally negotiated between the seller and the buyer. The size of the discount offered, in absolute and relative value terms, will depend on the relative bargaining power of the two parties to the transaction and on the method through which the advertising is purchased (i.e. direct or indirect). Although the starting price on individual stations is essentially the same for either route, as
explained in paragraph 5.6 the final price paid by indirect advertisers will typically be lower than that paid by direct advertisers.
4.20 The more “important” an advertiser is, the bigger the discount it is likely to receive. Importance is not simply a matter of revenue from each advertiser as, for example, a local advertiser that advertises 52 weeks a year may be very important to specific local stations.
4.21 Direct advertisers, who do not use a media buying agency, tend to negotiate for themselves. However, indirect advertisers tend to use the services of a media buying agency to negotiate on their behalf.
4.22 Research indicates that negotiations between media buying agencies and radio group sales houses may lead to a number of different types of deals for radio advertising airtime:
4.22.1 supra-agency deals covering all the media buying activity carried out by a media buying holding group (e.g. Group M) with a specific sales house; 4.22.2 agency-wide “umbrella” deals lasting for a deal round (one year) and
covering all media buying activity carried out by an agency with a specific sales house (such arrangements tend to take the shape of informal commitments as opposed to formal contractual agreements); 4.22.3 client-specific agency deals covering all the media buying activity
conducted by an agency with a specific sales house on behalf of a particular client; and
4.22.4 ad-hoc deals negotiated between a media buying agency and a sales house on an individual campaign by campaign basis.22
4.23 Research suggests that the two major types of deals concluded between media buying agencies and sales houses are:
20
Defined as individuals of 15 years old or older (“15+”).
21
This is supported by research which suggests that “all participants in the qualitative research felt that they could negotiate radio advertising prices and get a good deal”, see supporting document vol 1. For a description of the methodology of this research see section 6.
22
See supporting document vol 2. For a description of the methodology of this research see section 6.
4.23.1 volume deals where the agency commits to spending a certain amount of money with the specific sales house over the period of the deal; and 4.23.2 share deals where the agency commits to spending a certain proportion of
its total radio advertising expenditure with the specific sales house over the period of the deal.23
4.24 Larger media buying agencies tend to be able to negotiate bigger discounts for their clients because of the buying power conferred by the number of clients and value and share of spend that they represent. However, media buyers do not always negotiate for all of their clients together as they can sometimes secure a better deal for a large individual client by negotiating for them separately. Qualitative evidence indicates that media buying agencies will often (although not always) negotiate a rate up-front for radio advertising, based on projected radio advertising spend volume or share of spend, thereby eliminating the need to negotiate separately for each individual radio campaign.
4.25 Direct advertisers usually perceive that they negotiate a deal from the ‘standard’ rate card price, sometimes based on a relationship with the stations or because they perceive the station really wanted their business.24
4.26 The discounts offered by stations or sales houses may take a number of forms including, but not limited to:
4.26.1 percentage discounts on the listed rate card price;
4.26.2 volume discounts based on the number of slots purchased;
4.26.3 percentage discounts on the cost on an advertiser’s last campaign or share of annual spend;
4.26.4 discounts based on a spend volume commitment over a set time period; and
4.26.5 discounts for early bookings.
4.27 Research suggests that many advertisers are not quoted a standard rate card price prior to negotiations and many of those that do negotiate down from a listed rate card price are not aware of the value of the discount agreed. Prices are also often
communicated to advertisers or media buyers face-to-face (rather than on a written contract), further demonstrating the lack of reliance on a standard rate card. 25
Bundling and parallel negotiation of advertising prices for clusters of stations
4.28 Even if sales houses sell the airtime of a cluster of radio stations together, prices are negotiated separately for each radio station within that cluster. Nevertheless, the price for each individual radio station tends to be set in parallel and the airtime on the individual stations is sold as a bundle.
23
Supporting document vol 2. For a description of the methodology of this research see section 6.
24
Supporting document vol 1. For a description of the methodology of this research see section 6.
25
Section 5
5
Direct and indirect radio advertising
market definition
5.1 In previous competition cases relating to the consideration of radio mergers, the Competition Commission (CC) has found that local and national radio advertising constitute separate relevant product markets.
5.2 In its submissions to the OFT in relation to recent radio mergers, Ofcom has defined separate relevant product markets for direct and indirect radio advertising.26 Ofcom’s discussions with stakeholders in the past have indicated that the types of advertising bought under each of these two routes to market have separate and distinct product characteristics and different costs, and that switching between both routes would be costly.
5.3 The characteristics of indirect and direct advertising include:
5.3.1 Indirect advertisers:
a) typically buy a more sophisticated product;
b) buy radio advertising as part of nationwide cross-media campaigns which typically cover many stations, with radio in some cases being used to complement the messages delivered by other media;
c) buy airtime through media buying agencies and radio group advertising sales houses; agencies and national sales houses provide a cost-effective way of purchasing across numerous stations, providing a number of value added services to indirect advertisers; the extensive use of annual contracts gives a degree of buying power to the indirect advertisers/media buying agencies relative to radio advertising sales houses/radio stations;and
d) the prices they pay are typically based on commercial impacts delivered, i.e. a CPT basis27.
5.3.2 Direct advertisers
e) do not normally run sophisticated cross-media campaigns, therefore using agencies is unlikely to be cost-effective for direct advertisers; agencies are typically not interested in providing services to such local advertisers either as it is not cost-effective.
f) typically target a relatively small geographic area using one or a small number of stations only;
g) buy spots28 of airtime rather than commercial impacts; and
27
CPT refers to the cost for each thousand people that hear a 30 second advertisement at a certain time (e.g. a cost for each thousand people that hear a 30 second advertisement during next Monday’s breakfast show).
h) do not generally make use of annual contracts with radio stations.
5.4 Switching between direct and indirect purchases is theoretically possible. However, in practice this is relatively rare because of the presence of barriers to switching. A direct buyer switching to indirect purchasing to avoid a price increase applied to direct advertisers only might in principle gain from the lower prices for airtime paid by a media buying agency. However, Ofcom has been informed in the past that this benefit is likely to be more than offset by the fees and commission that the agency would be likely to charge the advertiser (if, indeed the advertiser were to be accepted as a client at all) to cover the additional costs of servicing small advertisers. The indirect channel is in general designed to deal with large scale advertisers.
5.5 Similarly, if an indirect advertiser was to switch to the direct route to market in order to avoid a price increase applied to indirect advertisers only, it is likely to have to contract separately with a large number of stations, which is likely to lead to high transaction costs. In addition, the indirect buyer may lose the benefit of the
bargaining power that the agency has through contracting across numerous stations at once. Therefore, even if faced with a price increase, it appears that the
advantages derived from purchasing advertising through a media buying agency and dealing with a station’s sales house would outweigh the disadvantages arising from the price increase, and thus switching to the direct channel would be unlikely. The direct channel is in general appropriate for smaller scale advertisers.29
5.6 Ofcom has examined separately the discounts to rate card prices received by direct and indirect advertisers. This analysis has indicated that indirect advertisers
generally receive larger discounts than direct advertisers30. The difference in discounts suggests that radio stations may be able to price discriminate between different buyers to some extent. At the limit, this could mean that there are in fact distinct markets for each individual buyer. However, assessment on the basis of individual buyer markets is unlikely to be practical or appropriate. In addition, Ofcom considers that differential discounts are more accurately characterised as
countervailing buyer power, reflecting the ability of individual advertisers to negotiate prices.
5.7 A further consideration is that it does not appear to be possible to arbitrage between routes. If advertising is purchased directly, the radio station is likely to be able to identify what advertiser will be using the airtime. For the reasons set out in paragraph 5.4 there are barriers that are likely to make it difficult for a direct advertiser to use advertising airtime purchased by media buying agencies.
5.8 The analysis of supply-side substitution between the two routes is not likely to be relevant because most commercial radio stations supply both direct and indirect advertising. As such, any supply-side constraint that could exist is already likely to be present in the market. The exception to this are those national stations that only provide national advertising airtime. In theory, these national stations could supply-side substitute and provide advertising airtime to direct advertisers. However, in practice, for these stations the ability to provide a constraint from the indirect radio advertising market to the direct radio advertising market is likely to be limited. In 28
Spot advertising gives a total cost to a particular period of airtime (e.g. 30 seconds during next Monday’s breakfast show).
29
We note that some buyers purchased radio advertising directly and indirectly according to Nielsen media data (e.g. the COI).
30
After reflecting the fees and commission payable to media buying agencies (estimated by Ofcom to be about 5%), the difference between the cost of buying through the two channels was reduced.
order to be an effective supply-side substitute, these stations would have to charge direct advertisers for the commercial impacts local to their business. If a national station were to charge in this way, it would not be charging these advertisers for the commercial impacts achieved outside of the local areas targeted by the advertisers. As such, national radio stations would be likely to have to forego revenues if they are to provide an effective supply-side constraint to the direct radio advertising market. 5.9 Therefore, Ofcom takes the view that given the evidence it currently has regarding
the likely switching costs between direct and indirect radio advertising, and the different prices paid for both routes (which suggests that radio stations may be able to price discriminate between both routes), direct and indirect radio advertising constitute separate relevant product markets. This conclusion is consistent with previous OFT and CC findings.
Section 6
6
Method of analysis
6.1 Analysing competitive constraints - Description of standard test
6.1 Market definition is carried out by competition and regulatory authorities in order to identify the range of products that constitute the relevant economic market, for the purposes of informing competition assessments and regulatory interventions. Markets are defined according to two dimensions: the relevant product market and the relevant geographic market.
6.2 This report however does not attempt to reach a definitive view on the scope of the relevant market. A view on the relevant market will need to be formed by taking account of the specific facts or circumstances of the particular case at hand. 6.3 Instead, this report is concerned with the constraints that other media place on the
pricing of radio advertising. This report does not assess the constraints faced by suppliers of radio advertising in one geographic area from suppliers of radio advertising in different geographic areas31.
6.4 In assessing the constraint imposed on the pricing of radio advertising by other media it is customary to apply the Hypothetical Monopolist Test or SSNIP (small but significant non-transitory increase in price) test.32 This test starts from the narrowest feasible set of interchangeable products (the focal product) and considers whether a hypothetical monopolist supplier of the focal product in question would find it
profitable to raise prices by a small but significant proportion (typically 5-10%) for a sustained period of time (typically one year). This will depend both on the response and competitive constraint imposed by consumers and suppliers. Hence, the SSNIP test analyses whether consumers would be willing and able to switch to alternative products (demand-side substitution), and whether alternative suppliers who do not currently produce the focal product in question would be willing and able to start supplying it in a relatively short time frame (supply-side substitution).
6.5 From a theoretical point of view, one would apply the SSNIP test by asking whether a hypothetical monopolist of (direct or indirect) radio advertising could profitably raise prices by 5-10%. If, in response to the price increase, the reduction in sales of the product would be large enough that a hypothetical monopolist would not find it profitable to impose such an increase in price, then one would add to the product group the product that is the next-best substitute for radio advertising (e.g. TV advertising).
6.6 The SSNIP question would then be asked for a hypothetical monopolist controlling the expanded product group (i.e. radio advertising and TV advertising). This process would continue until a group of products was identified such that a hypothetical monopolist over that group of products would profitably impose a SSNIP. The relevant product market would normally be considered to be the smallest group of products that satisfies this test.
31
For the rationale as to why we are only considering the product market in this report please see section 7.
32
See OFT guideline on market definition for more details – Market Definition: Understanding Competition Law, Office of Fair Trading.
6.7 However, this approach is difficult to apply in practice, as it would require the SSNIP test question to be applied to increasingly hypothetical scenarios and to be repeated to interviewees possibly several times. Therefore conducting successive SSNIP tests to incrementally add candidate substitute products to the relevant product market would have been feasible but would have been unlikely to provide considered responses. As already explained above, Ofcom’s approach identifies the products which appear to pose the strongest competitive constraint on (direct and indirect) radio advertising, but does not conclude on the issue of market definition.
6.8 The effect of the hypothetical monopolist’s price increase on its profits will depend on:
6.8.1 the gain in sales revenue on units of output for which customers pay the higher price: the more sales volume is retained, the more likely it is that the price increase is profitable;
6.8.2 the loss in sales volume of the product as a result of switching away
following the price increase: the more sales volume lost, the more likely it is that the price increase is unprofitable;
6.8.3 the effect on the hypothetical monopolist’s costs: if the price rise results in a lower sales volume and hence a lower level of production, then this will lead to cost savings. The smaller the cost savings that result from the loss of sales volume, the more likely it is that the price increase will be
unprofitable.
6.2 Lack of transparency and consistency of price and volume data
6.9 Although a number of techniques are in principle available to define relevant markets, the choice of technique will in practice depend on the availability of data. Most of the standard empirical or econometric techniques and tests require the availability of a consistent time-series of price and volume data. However, as discussed in Section 4.3 there is a general lack of transparency and visibility around actual radio
advertising prices and volumes due to the fact that contracts are generally
commercially negotiated bilaterally on a case by case basis. This means that there are no readily available, accessible or consistent measures of prices and volumes over time. As a consequence, econometric techniques and tests typically used for market definition are difficult to apply in practice. These issues are discussed further below.
Lack of transparency and consistency of price data
6.10 For the reasons explained below, transparent and consistent price data is not available:
Deviation between published rate card and actual prices paid
6.11 As explained in section 4.3, most radio groups or stations publish a form of rate card setting out list prices and reflecting differing levels of demand for particular stations and time periods. However, while rate card prices are available as a source of information on prices, the rate card prices are not the actual prices paid by advertisers for radio airtime. This is because discounts off the rate card price are generally negotiated between the seller and the buyer.
Negotiation of discounts on published rate card prices
6.12 Section 4.3 explained that discounts may take a number of different forms (e.g. percentage discounts on the listed rate card price, volume or share of spend discounts, etc), and that the size of the discount offered, in absolute and relative value terms, will depend on the relative bargaining power of the two parties to the transaction and on the method through which the advertising is purchased (i.e. direct or indirect), with the cost to advertisers that purchase advertising indirectly being typically lower than advertising on the same station sold to direct advertisers. As noted in section 4.3, awareness by advertisers of the exact value of discounts agreed appears to be low.
Bundling and parallel negotiation of advertising prices for clusters of stations
6.13 Section 4.3 explained that even when advertising is being purchased from a cluster of stations, the negotiation process will typically involve the agreement of a price on each individual station. Nevertheless, the negotiation sets the price for each
individual station in parallel and the advertising on the individual stations is sold as a bundle. This practice further contributes to the difficulty in comparing, on a like-for-like basis, prices paid for advertising on different stations. For example, it may be that lower prices for individual stations achieved on the purchase of a bundle of stations by a media buying agency reflect larger discounts secured by the media buying agency on account of the size of the overall budget it allocates to that radio sales house. In this case, prices negotiated for stations belonging to different clusters may not be directly comparable as account would need to be taken of the impact on separately negotiated prices of the parallel nature of the negotiation process.
Aggregate demographic measure
6.14 Radio commercial impacts are generally sold on the basis of “all adult” listeners (see section 4.3) rather than audience sub-demographics as is the case for television advertising. However, as the radio station audience is likely to have a particular demographic profile, an advertiser may target a particular audience demographic or combination of demographics by approaching radio stations or clusters of radio stations that attract those audience demographic profiles33. Therefore, although prices are set as all adults across radio stations, a radio station with a more valuable demographic group will be able to command a higher premium. Prices for “all adults” across stations are therefore not comparable on a like-for-like basis as the underlying product is differentiated across stations.
Lack of transparency and consistency of volume data
6.15 As explained in section 3.2, airtime on radio is generally sold either on a CPT basis, or as spot advertising. The CPT is established in relation to the number of
commercial impacts achieved in the previous period. The actual number of impacts achieved in the end may actually be different from the number of impacts purchased in advanced. Therefore, it is likely to be difficult to relate exactly the price or CPT paid for radio advertising airtime to the price implied by the volume of commercial impacts actually achieved (which may differ for a given advertising budget if the volume of
33
A radio station’s audience profile is defined as the station’s total survey area (TSA), i.e. the coverage area within which a radio station’s audience is measured by RAJAR. A station or group of stations’ TSA is used as a proxy for the advertiser’s target audience area which is not directly observable.
commercial impacts acquired deviates from the volume of commercial impacts delivered).
6.16 When advertising is sold on a spot basis, the price relates to a particular period of airtime (e.g. 30 seconds during next Monday’s breakfast show). The same 30 second spot may achieve different number of impacts on different days or weeks.
6.17 Therefore, the fact that the number of impacts advertisers pay for does not
necessarily match the number of impacts actually obtained and that the number of impacts may vary in different days or weeks makes it difficult to compare volumes, and to relate the price to the volume of impacts actually obtained for a given advertising budget.
Conclusion
6.18 Quantitative techniques using time series of historic price and volume data required for the market definition exercise are difficult to apply in practice because there is not a unique and transparent relationship between the price and volume data associated with direct and indirect radio advertising transactions, and this data is not available in a consistent, standardised or comparable way. The lack of a transparent pricing structure resulting from the standard practice of negotiating discounts on dynamic rate cards further limits the comparability of any price data that may be recorded by industry players.
6.19 Because of these factors, Ofcom has had to take a different approach to obtaining pricing and volume data for its analysis of the competitive constraints faced by suppliers of direct and indirect radio advertising. In particular, rather than using revealed preferences based on actual historic data since this data is not available in a sufficiently consistent way, Ofcom has adopted the approach of using stated preferences. In particular, Ofcom has carried out primary research in order to assess what media buying agencies and advertisers state that they would do in the event of particular relative price changes between (direct and indirect) radio advertising and other media.
6.20 Section 6.3 discusses this market research approach and methodology in more detail.
6.3. Qualitative and quantitative primary research
6.21 In order to allow Ofcom to fully understand the attitudes and behaviours of radio advertising buyers, Ofcom commissioned a market research programme.
6.22 The economic analysis necessitated asking respondents about their intentions in a hypothetical situation, where the price of radio advertising increased.
6.23 Stated intentions from survey research should be treated with caution, especially where the hypothetical situation is an unusual or unfamiliar one. Because of this the research programme consisted of both qualitative and quantitative research, which sought to understand how best to ‘frame’ the hypothetical question and also to understand the influencing factors in the purchase decision so that an assessment could be made on the consistency of the responses to hypothetical questions with respondents’ attitudes and actual behaviours.
6.24 The first phase of the research was completed in April 2005. Subsequent analysis of the survey data found that the sample sizes of indirect radio advertisers achieved on
the key questions feeding into the economic SSNIP test model were too small to be able to conduct meaningful and robust analysis34.
6.25 Because of this Ofcom designed a second phase of research, specifically to examine the preferences and behaviours of indirect radio advertisers. This research was conducted amongst a sample of media buying and/or advertising agencies – the sample had a coverage equivalent to over 80% of the indirect radio advertising market in terms of spend value and can be considered as representative of the market as whole.
6.26 The second phase of the research was conducted between March and May 2006.
6.4. Sampling and approach
6.27 This section explains the approach and sample sizes of the surveys used for the direct and the indirect ratio advertising SSNIP test analysis, and how those samples were created.
Phase 1 – survey used for direct radio advertising SSNIP test analysis
6.28 In the first phase of market research interviews were conducted with 500
organisations that buy radio advertising. 331 of these were direct advertisers and the remainder were indirect advertisers (clients) and advertising or media buying
agencies.
6.29 In the first instance, the sample was created by fieldworkers listening to the radio and noting down the names of advertisers. However, as this provides only a ‘snapshot’ in time of radio advertisers, other sampling methods were also used. Additional
samples of advertisers were acquired from a database of purchasing decision-makers (Business Pool – from Wegner Direct marketing), a list of the highest spending radio advertisers (Source: Mediatel) and a sample of companies that had advertised on the radio in the last two years (source: Nielsen media). Where the records did not contain addresses or telephone numbers the list of company names was sent to Dun & Bradstreet for matching with telephone numbers.
6.30 The sample was typed into electronic format and all other sample sources were supplied in electronic format and loaded onto Harris Interactive’s CATI35 system. This system randomly selected companies for interview within each quota cell.36 Where the interviewer failed to make contact with a respondent, repeated attempts (up to 10 times) were made to secure an interview. Once contact was made with a company, the person responsible for the company’s advertising and media spend was selected for interview.
6.31 As the precise profile of the ‘universe’ of direct radio advertisers is unknown (and changing) sample quotas for direct advertisers were not set. As a test for
representativeness, the sample spend profile was compared to the spend profile of direct radio advertisers on Nielsen media’s database. The sample appears to be representative of UK direct radio advertisers, with the following exceptions:
34
The sample source used did not allow identification of whether advertisers were classified as direct or indirect prior to fieldwork. During fieldwork, it became apparent that the approach was an inefficient way of achieving a robust sample of indirect radio advertisers.
35
Computer Assisted Telephone Interview
36
Quotas were set as follows: 450 radio advertisers, 25 media-buying agencies, 25 advertising agencies
6.31.1 the very highest spending direct radio advertisers are not represented by the survey. The Nielsen media database suggests that 11 advertisers account for 12% of spend – these 11 businesses are not represented by the survey; It may be that these high spending direct radio advertisers act and behave more like indirect advertisers; and
6.31.2 analysis also suggests that the survey under-represents the very lowest spenders (£0-£1000 per annum). The Nielsen media database suggests that these account for 2% of the direct radio advertising market spend, so this under-representation would have a negligible impact on the overall spend representativeness and subsequently the SSNIP analysis. 6.32 An analysis of the sample profile shows that those who revealed their budget and
those who answered the SSNIP test question were similar in profile to the entire sample (see Annex 9). This suggests that the conclusions are valid as a broad rule across the market.
Phase 2 – survey used for indirect radio advertising SSNIP test analysis
6.33 The research consisted of a series of face-to-face interviews with Heads of Radio and others at all the “top-spending” media-buying agencies. The interviews were conducted using a mixture of qualitative and quantitative research techniques. This enabled the capture of quantitative data in an environment that allowed the
interviewer to:
6.33.1 ensure the respondent had a full understanding of the questions asked; and 6.33.2 better understand the motivations behind the answers given.
6.34 The research questionnaire / discussion guide was designed with input from: 6.34.1 Ofcom;
6.34.2 The Institute of Practitioners in Advertising;
6.34.3 Human Capital.
6.35 Two pilot interviews were conducted with a media agency to identify issues and hone the questionnaire.
6.36 Nielsen media’s database was used as a sample frame and in total 28 media-buying agencies participated in the research. These included:
6.36.1 The 18 agencies (including PHD) that make up the top 80% of the market when ordered by spend;
6.36.2 Five agencies within the group accounting for 80%-90% of radio spend; 6.36.3 Five agencies within the group accounting for 90%-100% of radio spend,
including two relatively small independents. 6.37 The respondents themselves included:
6.37.1 Heads of Radio (or equivalent) at each agency;