Effect of architectural adjustments on pedestrian flow at
bottleneck
Jianyu Wang
1, Jian Ma
2,*& Peng Lin
31,2School of Transportation and Logistics /Southwest Jiaotong University, Sichuan, China. 3Faculty of Geoscience and Environmental Engineering /Southwest Jiaotong University, Sichuan, China.
*majian@mail.ustc.edu.cn
Abstract – In the last decades, a series of terrible accidents happened within pedestrian crowds, which makes crowd dynamic a significant issue to be investigated. Literature reviews show that pedestrian flow presents different features within different architectural layout. In this paper, pedestrian movement properties at bottleneck are studied by carrying out series of experiments under laboratory condition. The influence of door sizes and exit locations on pedestrian crowd flow is investigated. It was found that larger door width resulted in shorter evacuation time and faster flow rate. By comparing the fundamental diagram among crowd evacuation, the average velocity increases as the width increases under the same density condition. Interestingly, the influence of the boundary layer, as well as the effective width on pedestrian crowd dynamic, was clearly observed. Our results suggest that the combination of exit width and location resulted in a synergistic effect, but the exit widths gradually became the most important factor influencing the flow rate.
Keywords: pedestrian crowd dynamics; door width; exit position; specific capacity; time interval.
1. Introduction
The occurrence of serious accidents within gathering pedestrians in the last decades attracted researchers from different disciplines focusing on crowd dynamics. Studies on crowd accidents show that a series of complex behaviors such as clogging, trampling and crushing at bottlenecks can be observed. It was found that the specific capacity Js, capacity per meter width, is one of the most important characteristics of pedestrian dynamics at the bottleneck.
Summarizing earlier related studies, it can be found that several researchers have performed controlled experiments or empirical observations to collect pedestrian movement data. Kretz et al. [1] studied the pedestrian flow through a bottleneck with 0.40m depth. The Js was calculated based on passing time of participants, and were about 2.20m-1·s-1 in 0.40m width and 1.85m-1·s-1 in 1.00m width.
Daamen et al. [2] performed controlled experiments on the ingress of the crowd into a channel bottleneck with various doorway widths, population composition, stress level and presence of an open door. It was found the average capacities are for all widths lowest for the lowest stress level and highest for the highest stress level, and up to 3.31m-1·s-1 with a greater part of children. Garcimartin et al. [3-5] conducted
controlled experiments where a group of students exits a room through a door with three competitive levels. The average specific flow measured in all the scenarios around Js=4.00m-1·s-1, and the maximum specific flow in high competitive condition was up to 4.50m-1·s-1.
For ethical and moral reasons, sometimes we cannot use people to perform laboratory experiments. As a consequence, biological entities have also been employed in structured experiments to investigate collective dynamics. This kind of method is effective due to the ease of handling and the simplicity of the equipment. Shiwakoti et al. [6-10] studied factors including the escape space, exit position, the placement of cylindrical obstructions and funnel-shaped exit on ants’ collective movement. It was found when the exit is placed at the edge of a wall, the evacuation efficiency is higher when compared with the situation when the exit is placed in the middle of a wall. It was also found an appropriate size barrier placed in front of exit can promote evacuation. Pastor et al. [4] investigated the herd of sheep rushing through a door craving for food. The competitiveness among sheep was stimulated by warm days and cool days. Lin
Although it was found that pedestrian flow presents different features within different architectural layouts, the impact of exit position and varying door widths still needs systematic investigation. What is more, studies performed with biological entities need to be verified with human movement data. Thus in this study, real people will be recruited to participate in structured experiments controlling exit positions and widths in a bi-dimensional building. The aim of this study is to systematically analyze the influence of the bottleneck width and position on pedestrian crowds during emergency condition. In this way, it can contribute to deepening our understanding of the evacuation process. Further, the data and results can be applied to construction design, pedestrian model validation, and even crowd management.
2. Experiment setup
In total 131 college students including 80 boys and 51 girls were recruited as participants in this research. All the participants wore white clothes and each one was given a red hat with a white marker in the center. In this way, these participants can be easily identified, and their trajectory data can be extracted. The design of the experiment was inspired by the researches performed by Pastor [4, 5] and Shiwakoti [6]. We considered more practical pedestrian facility layouts in our experiments. All the participants were ordered to evacuate as fast as possible. During the evacuation process, soft pushing as a way to make their way out was allowed for these participants. In our experiment, we made three architectural adjustments, as presented in Fig. 1(a), (b) and (c).
● Exit in the middle of the wall (Exit in the middle)
● Exit at the corner (Exit at the corner)
● The center of the exit located 1 m away from the side wall (Side exit)
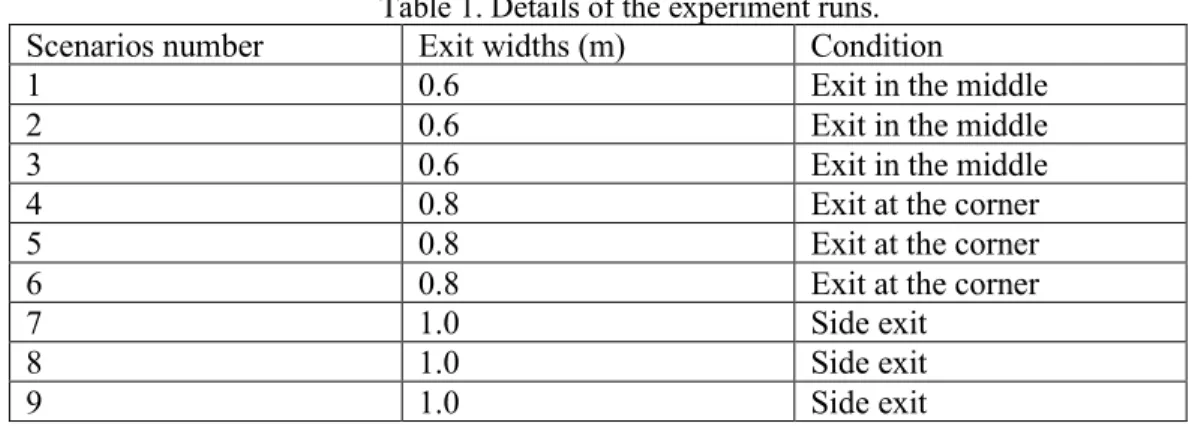
For each architectural adjustment, we tested three different door widths, i.e., 0.6m, 0.8m, and 1.0m. To minimize the impact of randomness in the experiment, six repeated runs were conducted. Therefore, 3×3 ×9=54 group experiments were conducted in all. Table 1 provides the details of these runs.
(a) (b) (c)
8
5
3
w w w/2
m=1.0 waiting area waiting area waiting area
camera 1 camera 2
8 20
exit
2
stopping line
(d)
Fig.1: Experimental setups for the crowd egress experiments. (a) middle exit; (b) corner exit; (c) side exit; (d) the side view of experiment site; where w represents the width of the exit, and m refers to the distance from the edge
wall. The unit in this figure is m.
experimental video recording frames, we first marked out a green line at a height of 1.70m at the exit. In this way, we could manually extract the exact time each person's head passed this line. Thus, the time error of each participant passing the exit can be controlled within 0.04s.
Table 1. Details of the experiment runs.
Scenarios number Exit widths (m) Condition
1 0.6 Exit in the middle
2 0.6 Exit in the middle
3 0.6 Exit in the middle
4 0.8 Exit at the corner
5 0.8 Exit at the corner
6 0.8 Exit at the corner
7 1.0 Side exit
8 1.0 Side exit
9 1.0 Side exit
3. Result and analysis
The total evacuation time for different scenarios is shown in Fig.2. From Fig.2 we can see that the data show distinct variation feature. When the exit width was 0.8m, one or two particular evacuations in the condition of side exit can be faster than those of other conditions. Moreover, the exit position has an effect on the total evacuation time on all the evacuation scenarios. Finally yet importantly, the group evacuation time obviously decreases with increasing door width.
0 20 40 60 80 100
0 10 20 30 40 50 60 Exit in the middle Exit at the corner Side exit
t (s)
Nu
m
be
r of
in
du
vidu
al
0 20 40 60 80 100
0 10 20 30 40 Exit in the middle Exit at the corner Side exit
t (s)
0 20 40 60 80 100
0 10 20 30 40 Exit in the middle Exit at the corner Side exit
t (s)
(a) (b) (c)
Fig. 2: Cumulative number of evacuated pedestrian through the exit. (a)-(c) correspond to 0.60 m, 0.80 m and 1.00 m door width, respectively.
Then, the total evacuation time was statistically analyzed, as presented in Fig.3. With increasing the door width, the mean evacuation time for the three conditions decreases. When the door width was 0.6m, the fastest movement time was about 48.93s for the scenarios where the exit was located in the middle. This value is approximately 4.9% and 9.5% less than that of the other two conditions. While in the 0.80m width and 1.0m width conditions, the differences among the three physical setups can be neglected. For the 0.80m door width, the average time was in the range of 33.57s to 35.60s. For the 1.00 m exit width, the average time ranged from 25.20s to 26.16s.
obviously higher than that of the corner exit (3.18m-1·s-1) and the side exit condition (3.09m-1·s-1). When
the door width was larger (0.8m), the biggest specific capacity was 3.92m-1·s-1 also in the middle
condition, followed by 3.66m-1·s-1 in other condition and 3.39m-1·s-1 in exit at the corner condition. As the
door width increased to 1.0m, the specific capacity was about 4.00m-1·s-1 for middle exit design and side
exit design, while it is just 3.60m-1·s-1 for corner exit design.
20 30 40 50
60 Exit in the middle
Exit at the corner Side exit
1.0m 0.8m
To
tal
evacu
at
io
n
tim
e
(s)
0.6m
Fig.3: Comparison of evacuation time in various conditions
2.8
3.0
3.2
3.4
3.6
3.8
4.0
4.2
4.4
4.6
1.0m
0.8m
0.6m
Exit in the middle Exit at the corner Side exit
J
s(m
-1
·s
-1
)
Fig.4: The average flow rate for 0.6m, 0.8m, and 1.0m, calculated based on the measured specific capacity between the first and last window. The error-bar illustrates the uncertainty of the mean flow rate at the bottleneck.
Interestingly, the average specific capacity from 0.6m to 1.0m width for corner exit scenarios was only about 90% of the ones for the middle exit condition. This may be due to the decrease of the effective width, a result of boundary layer effect. Meanwhile, the average specific capacity of the side exit condition was about 87% to 97% of that in the middle exit condition. This indicates that the combination of exit width and location resulted in a synergistic effect, but the exit widths gradually became the most important factor influencing the flow rate. Further experiments need to be performed to prove this discussion.
velocity are determined. It was found that in Fig.6 the average velocity decreased as the density increases in lower density area and kept around 0.11m/s, 0.14m/s and 0.18m/s from 0.6m to 1.0m door width when the density was large than 4.0per/m2. In other words, the changes of the bottleneck width have an
influence on pedestrian fundamental diagram under room evacuation condition. This is different from the findings in Zhang et al.’s [13] experiments, which is carried out in a long corridor. Reasons for the difference between these two experiments still need further investigation.
8 7 6 5 4 3 2 1 0
8 7 6 5 4 3 2 1 0
Fig.5: The extracted full trajectories of all subjects from exit at the corner with 1.0m door width。
0 1 2 3 4 5 6 7 8 9 10
0.0 0.1 0.2 0.3 0.4 0.5
≥
w=0.6m
w=0.8m
w=1.0m
Ve
lo
city
(m
/s)
Density (per/m-2)
Fig.6: Comparison of fundamental diagrams among the three-door sizes in exit at the corner.
4. Conclusion
In this study, we present a series of laboratory pedestrian experiments to analyze the effect of architectural adjustments on pedestrian flow at bottlenecks. In total, 54 runs were performed by changing the door width and exit position. The whole process of the experiments was recorded by cameras and the pedestrian trajectories were extracted by PeTrack. It is found that irrespective of the exit locations, the greater width cases resulted in shorter movement time in all the repeated experiments. Based on the calculation of instantaneous flow rate, the measured specific capacity Js are 3.09-3.61m-1·s-1, 3.38-3.92m-1·s-1 and 3.59-4.07m-1·s-1, respectively for 0.6m-1.0m door width. In comparison to previous
evacuation. Moreover, the influence of the boundary layer (i.e. the effective width) on the evacuation process was clearly observed in our experiments. Here, we can hypothesize that the combination of exit width and location resulted in a synergistic effect, but the exit widths gradually became the most important factor influencing the flow rate. The final observation of this study is that the average velocity increases with the increase of exit width under the same density condition. This may challenge the former assumption that pedestrian fundamental diagram is barely influenced by building layout. It should meanwhile be noted that our findings are restricted to the limit door sizes and locations. In order to identify the transition point and optimum architectural adjustments, more evidence is needed and the author will conduct new sets of experiments in subsequent studies.
Acknowledgments
The supports from the National Natural Foundation of China under Project Nos. 71473207 and 71871189 are deeply acknowledged.
References
[1] Kretz T, Grünebohm A and Schreckenberg M 2006 Experimental study of pedestrian flow through a bottleneck Journal of Statistical Mechanics: Theory and Experiment P10014-P
[2] Daamen W and Hoogendoorn S P 2010 Emergency Door Capacity: Influence of Door Width, Population Composition and Stress Level Fire Technology 4855-71
[3] Garcimartín A, Pastor J M, Martín-Gómez C, Parisi D and Zuriguel I 2017 Pedestrian collective motion in competitive room evacuation Scientific Reports 7
[4] Pastor J M, Garcimartin A, Gago P A, Peralta J P, Martin-Gomez C, Ferrer L M, Maza D, Parisi D R, Pugnaloni L A and Zuriguel I 2015 Experimental proof of faster-is-slower in systems of frictional particles flowing through constrictions Phys Rev E Stat Nonlin Soft Matter Phys 92062817
[5] Garcimartín A, Parisi D, Pastor J, Martíngómez C and Zuriguel I 2016 Flow of pedestrians through narrow doors with different competitiveness Journal of Statistical Mechanics: Theory and Experiment 13
043402
[6] Shiwakoti N, Sarvi M and Burd M 2014 Using non-human biological entities to understand pedestrian crowd behaviour under emergency conditions Safety Science 661-8
[7] Burd M, Shiwakoti N, Sarvi M and Rose G 2010 Nest architecture and traffic flow: large potential effects from small structural features Ecological Entomology 464–8
[8] Shiwakoti N and Sarvi M 2013 Understanding pedestrian crowd panic: a review on model organisms approach Journal of Transport Geography 2612-7
[9] Shiwakoti N, Sarvi M, Rose G and Burd M 2011 Animal dynamics based approach for modeling pedestrian crowd egress under panic conditions Transportation Research Part B: Methodological 45
1433-49
[10] Shiwakoti N, Tay R, Stasinopoulos P and Woolley P J 2017 Likely behaviours of passengers under emergency evacuation in train station Safety Science 9140-8
[11] Lin P, Ma J, Liu T, Ran T, Si Y and Li T 2016 An experimental study of the “faster-is-slower” effect using mice under panic Physica A: Statistical Mechanics and its Applications 452157-66
[12] Boltes M, Seyfried A, Steffen B and Schadschneider A 2010 Automatic extraction of pedestrian trajectories from video recordings Springer 43-54