www.jyoungpharm.org | www.phcog.net
INTRODUCTION
Cosmetics, also known as makeup, are a substance used to enhance the beauty and appearance of the body. Nowadays people treasure their cosmetics and cannot imagine life without it. But, the beautiful face of cosmetics has an ugly truth on the other side.
Personal care products (e.g. deodorant, toothpaste, soap, shampoo) are constantly used nowadays. Nevertheless, synthetic compounds present in Personal care products can affect people’s health and the environment.1 Phthalates are one such category, occur as key components in plastics in many consumer products. The main phthalates in cosmetics and personal care products are DBP in nail polish, DEP in lotions and DMP in hair care products. DBP is also used as plasticizers.2 Often their presence are not notified on labels.3
The European Commission has determined that there is sufficient evidence that Phthalates lead to endocrine disruption in living organism.4 In addition, the Endocrine Disruption Exchange (TEDX) includes DEP5 and DBP6 as endocrine disruptors.
Two decades of research suggest that phthalates disrupt hormones, which can lead to harm during critical periods of development. Pregnant women’s exposure to the phthalates have been associated with a shortened distance between the anus and genitals in their male babies, indicating a feminization had occurred during prenatal genital development.7,8 The female reproductive system may be less sensitive to phthalate exposure than the male reproductive system, although a few studies have found female reproductive effects. Female laboratory rats chronically
exposed to DBP and other phthalates showed altered sex hormones and increased likelihood of fetal loss.9 Hence, the importance for develop-ment of simple and cost-effective method for estimation of DMP, DEP and DBP in Personal care products was raised.
There are many works of literature available on analysis of DMP, DEP and DBP that mainly deals with the estimation in environmental samples like water, sewage, dust, soil, sludge, toys10-20 food products21-23 and in biological samples24-27 employing HPLC, Gas Chromatography, LC/GC coupled with Mass Spectrometer, Capillary electrophoresis. The number of analytical methods reported on analysis of phthalates in personal care products are limited and as there are no reports of RP-TLC/Densitom-etry method for estimation of these toxic (infertility effect) phthalates in personal care products with the aid experimental design for robustness study, the current method is planned and executed.
Over the past decade, RP-TLC/Densitometry method has been success-fully used in the analysis of pharmaceuticals, plant constituents and bio macromolecules.28 Nowadays they are widely employed for the quanti-fication of drugs because of its low maintenance cost, less analysis time, minimal consumption of mobile phase per sample, need for simple, rapid and easy sample clean-up procedures. The basic advantage in selecting this powerful visualization technique is due to its accuracy, preciseness, specificity, sensitivity and reproducibility.29
CCD with the aid of Response surface methodology (RSM) is a method used after identifying the critical factors affecting a response. RSM can
Application of Experimental Design to Develop a Robust RP-TLC/
Densitometry Method for Quantification of Phthalates in
Person-al Care Products
Jayaseelan Kavitha1 and Karunanidhi Santhana Lakshmi*
1Department of Pharmaceutical Analysis, SRM College of Pharmacy, SRM University, Kattankulathur, Kancheepuram District–603 203, Tamilnadu, INDIA.
ABSTRACT
Objective: A rapid, simple and economic RP-TLC/Densitometry method for the simultaneous quantification of Phthalates, namely Dimethyl Phthalate (DMP), Diethyl Phthalate (DEP) and Di-n-butyl Phthalate (DBP) in Personal care products was developed and validated. Central Composite design (CCD) with three factors and one response is employed to study the robustness of the developed method. Method: The best chromatographic separation was achieved using Methanol: Toluene: Hexane: GAA (6:2:1:1 v/v/v/v) as the solvent system at 275 nm. The developed method was examined for validation parameters like linearity, specificity, precision, accuracy and robustness. Results: The method was found linear over a wide range of 2.0–200 ng/band with a regression coefficient of 0.999, 0.998 and 0.998 for DMP, DEP and DBP respectively. Limit of detection (LOD) and Limit of Quantification (LOQ) was found to be 0.035 and 0.106 ng/band, 0.072 and 0.218 ng/band 0.076 and 0.232 ng/band for DMP, DEP and DBP respectively. The %RSD for Precision studies for DMP, DEP and DBP were found to be 1.63 – 1.82, 1.13 – 1.52 and 1.58-1.60 respectively. Accuracy, ascertained by employing % Recovery was calculated and found between 97-103% w/w. CCD generated and carried out proves the method
devel-oped was robust. Conclusion: All the validation parameters were reported to be within the acceptance limit. The proposed and developed RP-TLC/ Densitometry method can be applied for routine analysis of DMP, DEP and DBP in Personal care products and can also be extended to the analysis in pharmaceuticals and food products.
Key words: Phthalates, Endocrine disruptor, Central Composite design, RP-TLC/Densitometry, Validation, Personal care products.
Correspondence :
Karunanidhi Santhana Lakshmi, Department of Pharmaceutical Analysis, SRM College of Pharmacy, SRM University, Kattankulathur,
Kancheepuram Dist – 603 203, Tamil Nadu, INDIA.
Phone no: 9094903309
Email: [email protected]
DOI: 10.5530/jyp.2017.9.35
be used for hitting a target, maximizing or minimizing a response, reducing variation, making a process robust, and seeking multiple goals.30 Thereby, it is envisaged to develop and validate a simple, swift and economic RP-TLC/Densitometry method employing CCD for robustness testing. Special attention was paid in quantification of DMP, DEP and DBP in 30 different personal care products (synthetic and herbal) procured from local markets in and around Chennai.
MATERIALS AND METHODS
Chemicals and ReagentsStandard DMP, DEP and DBP (Table 1) were purchased from S.D.fine chemicals, India. 30 different personal care products were purchased from local markets. Methanol and n-hexane were purchased from Merk, India. All other solvents used were of analytical grade. Distilled water (Double distilled) was used throughout the analysis.
Instrumentation and chromatographic conditions
Chromatographic separation was performed on RP-TLC/Densitom-etry plates (Merk, Germany) precoated on Aluminum sheets with Silica gel 60 F254. The plates after prewashing with methanol were activated at 105 ˚C for 15 mins before chromatographic separation. The prepared standards and extracted sample solutions were spotted in the form of rectangular bands of 5 mm width with a Camag 100 µl syringe using a Camag Linomat V applicator at a constant rate of application of 150 nL/ second. Ascending development was carried out employing Methanol: Toluene: Hexane: GAA (6:2:1:1 v/v/v/v) as solvent system in a Camag twin trough glass chamber, with a tightly fitted lid, previously saturated with the vapours of mobile phase for 30 mins at room temperature (25 ± 2˚C). The plates are subjected to development to a distance of about 8 cm. The developed plates were dried in the current of air. Densitometric detection was carried out at 275 nm, employing Camag TLC scanner III, in the absorbance mode operated by winCATS software.
Preparation of standard solutions
A stock solution containing 1 mg/ml is prepared by dissolving 100 mg of DMP, DEP and DBP in 100 ml of hexane, individually and in combina-tion. The stock solution was suitably diluted with hexane to yield a series of concentration ranging from 2.0-200 µg/ml for the calibration curve. Seven point calibration curves was built up by spotting 1 µl of each of the prepared standard solutions to obtain concentrations in the range of 2.0–200 ng/band.
Determination of Absorption maximum (λ max)
The stock solutions of DMP, DEP and DBP were diluted separately to get a concentration of 10 µg/ml using methanol. The solutions were indi-vidually scanned in the UV region from 400-200 nm.
Extraction of DMP, DEP and DBP from cosmetic preparations
The content of phthalates present was estimated by standard addition method. Thirty cosmetic products (including shampoo, cream, lotion, toothpaste, hair gel and nail polish) were procured from the local mar-kets in and around Chennai city. Individually, 5 g of the sample was weighed, followed by extraction with 15 ml of hexane and the mixture was homogenized under sonication for 20 mins, after which the volume was made up to 100 ml with hexane. The above solution was mixed well and filtered through 0.22 µm Millipore membrane filter and were spiked with series of mixed standard solutions. The resultant solution is utilized for further analysis.
Method validation
The developed method was validated to ascertain the following param-eters.
Linearity
Linearity is evaluated by determining the response (peak area) at seven different standard concentrations of 2.0, 6.25, 12.5, 25, 50, 100 and 200 ng/band. Peak area versus concentration was subjected to linear regres-sion equation to calculate regresregres-sion and correlation coefficient data’s. LOD and LOQ
LOD of an individual analytical procedure is the lowest amount of analyte in a sample which can be detected but not necessarily quantitated as an exact value.
LOQ of an analytical procedure is the lowest amount of analyte in a sample, which can be quantitatively determined with suitable precision and accuracy.
The formula 3.3σ/S and 10 σ/S was planned to be employed, to calculate LOD and LOQ respectively, where σ is the residual error and S stands for the slope of the calibration curve.
Precision
The method was evaluated for precision (inter and intraday), by carrying out analysis of concentration at 25 µg/ml (six times) for DMP, DEP and
Table 1: General Properties of DMP, DEP and DBP
Ingredient name
IUPAC name
Molecular Structure
Molecular Formula
Molecular
weight Appearance
Specific
gravity Solubility λmax
Maximum allowable limit in cosmetic
product
DMP
Dimethyl benzene-1,2-di carboxylate
C10H10O4
194.184 g/
mol Colorless, oily liquid 1.188g/ml at 20ºC
Soluble in Methanol, ethanol,
ether, acetone and Insoluble in
water
277nm
Maximum concentration
(total phthalate content) not
exceeding 0.1% w/w. 275nm
DEP Diethyl benzene-1,2-dicarboxylate C12H14O4
222.24
g/mol Colorless, oily liquid 1.118g/ml at 20ºC
272nm DBP 1,2-Benzenedicarboxylic acid dibutyl ester C16H22O4
278.35 g/mol
Colorless to faint yellow oily liquid
DBP, individually. The results obtained results were expressed as %RSD of peak area.
Accuracy
The placebo samples are spiked at three different levels (2.0, 25 and 200 µg/ml for DMP, DEP and DBP) of standards and extracted by employing the same procedure involved in the extraction of DMP, DEP and DBP from personal care products. At each level of the amount, three determinations were performed. This was done to check the recovery of DMP, DEP and DBP at different levels from personal care products.
Experimental design for robustness testing
Robustness is checked by employing CCD. CCD approach connects a fractional factorial including incomplete block design to avoid extreme vertices and to present an approximately rotatable design with two levels per factor. The factors selected are the content of organic phase (total volume of methanol) (A), development distance (B) and bandwidth (C). Based on the three factors selected, twelve experiments with two center point CCD model were constructed (Table 5) and executed. The nominal values for all these three factors were 6.0 ml, 8 cm and 5 mm respectively. Statistical analysis of ANOVA was performed using Design Expert (Version 7.1.6, Stat-Ease Inc., Minneapolis, MN, USA) software, to compute the significance of the difference in mobile phase composition as a part of robustness study.
RESULTS
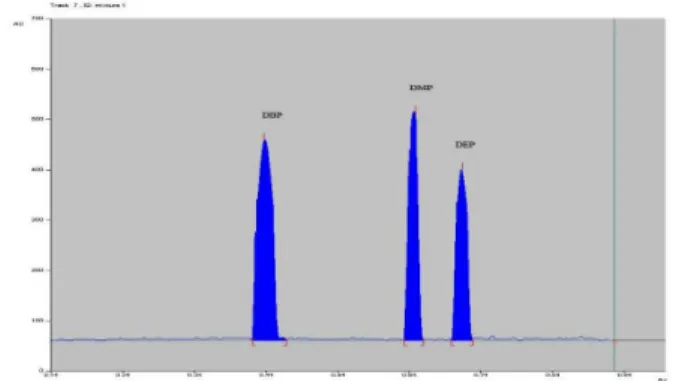
The λmax of DMP, DEP and DBP was found to be 277 nm, 275 nm and 272 nm respectively and the wavelength selected for detection of DMP, DEP and DBP was 275 nm. The applied chromatographic conditions permitted a good separation of DMP, DEP and DBP (Rf of 0.45 ± 0.027, 0.65 ± 0.011 and 0.72 ± 0.031 for DBP, DMP and DEP respectively – Figure 1), as well as for quantification of DMP, DEP and DBP in various personal care products. No drug decomposition was observed during the analysis. The developed RP-TLC/Densitometry method was validated for the param-eters reported below.
Method validation
DMP, DEP and DBP were chromatographed using the optimized mobile phase. Linearity of the developed method was observed by plotting peak area versus concentration in the studied range of 2.0 - 200 ng/band for DMP, DEP and DBP individually. A linear response was observed over the examined concentration range which resulted in a correlation coef-ficient (r2) of 0.999, 0.998 and 0.998 for DMP, DEP and DBP respectively. LOD and LOQ were ascertained from the calibration curve at three and ten times of the noise level and was predicted as 0.035, 0.106 ng/band for DMP 0.072, 0.218 ng/band for DEP and 0.076, 0.232 ng/band for DBP respectively.
The peak purity of DMP, DEP and DBP was ascertained by comparing the spectra at peak-start, peak-apex and peak-end positions of the spec-tral band. The performed inter and intraday precision is evaluated by analyzing the obtained %RSD value at the concentration level of 25 µg/ml (six times) for DMP, DEP and DBP. The %RSD was found to be less than 2%. (Table 2)
Accuracy of the analytical method was preceded by performing recovery studies (standard addition method) at three different levels of spiked concentrations and the result was found to be satisfactory. The amount of drug added and determined and the % recovery are listed in Table 3. The overall results of RP-TLC/Densitometry method validation was represented in Table 4.
Experimental design for robustness testing
CCD was selected due to its flexibility. All the experiments in the model were performed in a randomized manner. The results were shown in Table 5. The experimental results obtained were computed. The equation models for Y for DMP, DEP and DBP were shown in Table 6. The positive sign indicates synergistic effect, were as negative indicates antagonistic effect. To evaluate the effect of factors selected upon response (retention factor) of DMP, DEP and DBP, response surface plots were constructed. Figure 2 (a, b & c) shows that change in the content of organic phase (methanol content) has the most significant effect on retention factor and development distance has very mild effect on retention factor. Whereas, the other examined factor, i.e., bandwidth was not found to have any significant effect on response. Variation in retention factor was observed due to change in the ratio of methanol (increase in methanol content in mobile phase) increases the retention factor) content in the mobile phase, which is considered acceptable, as evidence created from the plot and the developed method is reported robust.
Estimation in personal care products
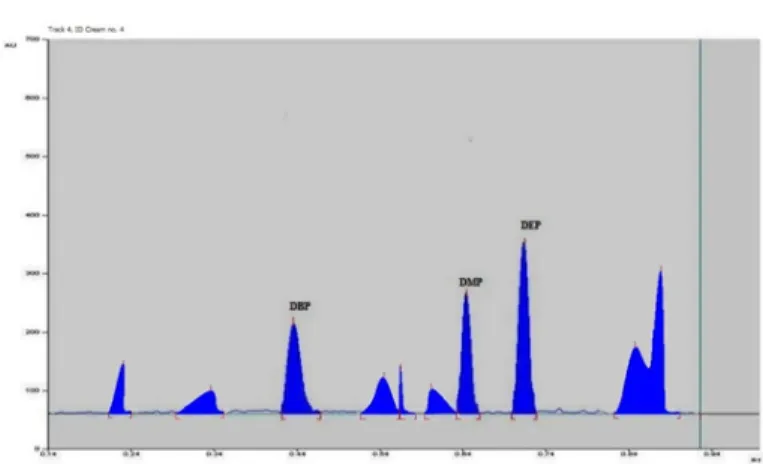
The content of DMP, DEP and DBP in 30 different marketed personal care products after extraction was analyzed employing the validated method, showed two peaks at Rf value of 0.46, 0.65 and 0.73 for DBP, DMP and DEP respectively (Cream no. 4), which was found same as the Rf value of standards (Figure 3).
The concentration of DMP, DEP and DBP predicted were found well below the maximum allowable limit in the cosmetic product. (Figure 4)
DISCUSSION
The optimized method was validated and the results could be discussed stating each and every parameters under validation. The correlation coefficient (r2) value obtained was above 0.998, which signifies the
Table 2: Precision study of Phthalates
Repeatability Drug Concentration (µg/ml) (Mean ± SD)*
n= 6 %RSD
Intra-day DMP 25 102.54 ± 1.87 1.82
DEP 25 100.85 ± 1.57 1.55
DBP 25 98.57 ± 1.56 1.58
Inter-day DMP 25 103.05 ± 1.68 1.63
DEP 25 101.47 ± 1.14 1.13
DBP 25 97.58 ± 1.57 1.60
*(Mean ± SD) of six determinations
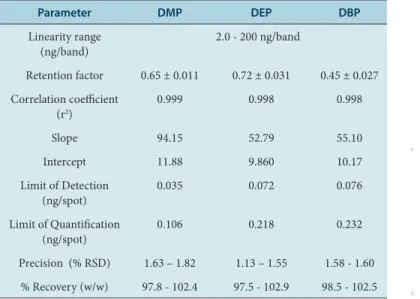
Table 4: Overall Results of RP-TLC/Densitometry method validation
Parameter DMP DEP DBP
Linearity range
(ng/band) 2.0 - 200 ng/band
Retention factor 0.65 ± 0.011 0.72 ± 0.031 0.45 ± 0.027 Correlation coefficient
(r2) 0.999 0.998 0.998
Slope 94.15 52.79 55.10
Intercept 11.88 9.860 10.17
Limit of Detection
(ng/spot) 0.035 0.072 0.076
Limit of Quantification
(ng/spot) 0.106 0.218 0.232
Precision (% RSD) 1.63 – 1.82 1.13 – 1.55 1.58 - 1.60 % Recovery (w/w) 97.8 - 102.4 97.5 - 102.9 98.5 - 102.5
Figure 2: Three-dimensional (3D) plots of the RSM and Perturbation plots for Rf value of DMP (a), DEP (b) and DBP (c)
Table 5: Design of CCD and their response
Run A Organic Phase (ml)
B Developing Distance (cm)
C Band Size
(mm) DMPRf of RDEPf of RDBPf of
1 5.00 9.00 4.00 0.59 0.65 0.38
2 6.00 8.00 5.00 0.65 0.72 0.45
3 5.00 7.00 4.00 0.58 0.66 0.38
4 7.00 7.00 4.00 0.71 0.78 0.51
5 6.00 8.00 5.00 0.65 0.72 0.45
6 6.00 8.00 5.00 0.65 0.72 0.45
7 7.00 9.00 6.00 0.72 0.8 0.51
8 6.00 8.00 5.00 0.65 0.72 0.45
9 5.00 7.00 6.00 0.57 0.65 0.38
10 7.00 7.00 6.00 0.71 0.79 0.5
11 6.00 8.00 5.00 0.65 0.72 0.45
12 6.00 9.68 5.00 0.66 0.71 0.43
13 4.32 8.00 5.00 0.55 0.63 0.37
14 6.00 8.00 3.32 0.65 0.72 0.45
15 6.00 6.32 5.00 0.66 0.73 0.46
16 6.00 8.00 6.68 0.65 0.72 0.46
17 7.00 9.00 4.00 0.72 0.79 0.5
18 6.00 8.00 5.00 0.65 0.72 0.45
19 7.68 8.00 5.00 0.74 0.81 0.52
20 5.00 9.00 6.00 0.58 0.65 0.39
Table 6: Predicted Response Models and Statistical Parameters obtained from ANOVA for CCD
Response (Rf value)
Type of
model Polynomial equation model for Y
Model
P value %CV
Adequate Precision DMP Linear +0.24+0.00158A+0.047B+0.00517C <0.0001 2.14 21.47
DEP Quadratic +0.54+0.064A+0.049B+0.038C+0.011AB+0.063AC+ 0.029BC-0.00684A2+0.02770B2+0.0941C2
0.0024 1.87 19.56
DBP Linear +0.24+0.0045A+0.012B+0.0180C 0.0067 2.41 31.487
Table 3: Recovery study of Phthalates from spiked samples
Ingredient Spiked level (µg/ml)
Shampoo
(n=3) Lotion (n=3) Tooth paste (n=3)
DMP 2.0 101.4±1.2 102.4±2.5 99.7±2.2
25 100.5±3.4 100.8±3.1 100.2±1.4 200 97.8±1.7 99.7±1.1 98.7±2.9
DEP 2.0 98.4±2.1 100.5±2.6 102.9±1.7
25 100.6±1.8 99.8±1.2 100.5±2.9 200 97.5±1.5 100.6±2.2 99.7±1.0
DBP 2.0 98.6±4.1 101.9±1.5 99.8±2.5
CONCLUSION
A well validated RP-TLC/Densitometry method for routine analysis of DMP, DEP and DBP in personal care products with the aid of CCD for robustness study have been developed. Employment of minimal analysis time, using lesser quantity of mobile phase and need for minimum sample clean-up procedure unlike HPLC and other advanced analytical techniques with low maintenance cost per analysis adds up credit to the current study. Finally, the proposed method satisfies the main goal of quantifying DMP, DEP and DBP present in various cosmetic products with accuracy, specificity and sensitivity, which was found to be well within the maximum allowable limits for cosmetics. The quantified amount helps use in basic understanding of our daily exposure to these harmful ingredients and thereby its exposure can be planned and reduced to build up a healthy lifestyle.
ACKNOWLEDGEMENT
The Authors are grateful to the management of SRM College of Pharmacy, SRM University, for providing necessary facilities to carry out this research work successfully.
CONFLICT OF INTEREST
The authors reports on conflict of interest on the study.
ABBREVIATION USED
DMP: Dimethyl Phthalate; DEP: Diethyl Phthalate; DBP: Di-n-butyl Phthalate; CCD: Central Composite design; GAA: Glacial acetic acid;
LOD: Limit of Detection; LOQ: Limit of Quantification; RSD: Relative standard deviation; RSM: Response surface methodology.
REFERENCES
1. Suzuki EY, Soldati PP, Chaves MGAM, Raposo NRB. Essential Oil from Origanum vulgare Linnaeus: An Alternative against Microorganisms responsible for Bad Perspiration Odour. J Young Pharm. 2015;7(1):12-20.
2. Patel DH, Patel MP, Patel MM. Formulation and Evaluation of Drug-free Ophthalmic Films Prepared by Using Various Synthetic Polymers. J Young Pharm. 2009;1(2):116-20.
3. Julia RB. Chemical Exposures: The Ugly side of Beauty products. Environ Health Perspect. 2005;113(1):1-24.
4. European Commission. List of 146 substances with endocrine disruption classi-fications prepared in the expert meeting 2014. [cited 2014 August 13]; Available from: http://ec.europa.eu/environment/archives/docum/pdf/bkh_annex_13.pdf.
5. The Endocrine Disruption Exchange (TEDX). Diethyl phthalate 2014. [cited 2014 August 13]; Available from: http://endocrinedisruption.org/popup-chemical-details?chemid=527.
6. The Endocrine Disruption Exchange (TEDX). Dibutyl phthalate 2014. [cited 2014 August 13]; Available from: http://endocrinedisruption.org/popup-chemical-details?chemid=510.
7. Swan SH, Main KM, Liu F, Stewart SL, Kruse RL, Calafat AM, et al. Decrease in anogenital distance among male infants with prenatal phthalate exposure. Environ Health Perspect. 2005;113(8):1056-61. Available from: http://www.ncbi. nlm.nih.gov/pmc/articles/PMC1280349/pdf/ehp0113-001056.pdf.
8. U.S. Consumer Product Safe Commission Directorate for Health Sciences. Report to the U.S. Consumber Product Safety Commission Chronic Hazard Advisory Panel on Phthalates and Phthalate Alternatives 2014. [cited 2014 August 18]; Available from: http://www.cpsc.gov/PageFiles/169902/CHAP-RE-PORT-With-Appendices.pdf.
9. Gray LE. Chronic Di-n-butyl phthalate exposure in rats reduces fertility and alters ovarian function during pregnancy in female Long Evans hooded rats. Toxicol Sci. [Internet]. 2006 August [cited 2006 August 18];93:189-195. Available from: http://toxsci.oxfordjournals.org/content/93/1/189.full.pdf+html.
10. Oscar B, Alberto Z, Alberto N, Jose LV. Sensitive gas chromatographic-mass spectrometric method for the determination of phthalate esters, alkylphenol, Bisphenol A and their chlorinated derivatives in wastewater samples. J Chrom A. 2006;1121(21):154-62.
11. Richard G, Min-Jian W, Emma P, Angus JB. Analysis of 4-nonylphenols, phthal-ates, and polychlorinated biphenyls in soils and biosolids. Chemosphere. 2005; 61(9):1336-44.
12. Aparicio I, Santos JL, Alonso E. Simultaneous sonication-assisted extrac-linearity of the method within the specified range of 2.0 - 200 ng/band.
The obtained LOD and LOQ proves the sensitivity of the developed method. From the obtained %RSD values, it is evident that the method shows acceptable precision in regards to sample application and repeat-ability of peak area measurement. Accuracy of the proposed method was ascertained by recovery studies employing standard addition method, which gave a recovery between 97-103% w/w, hence proves its accuracy. CCD was employed for robustness testing. All the experiments in the model were performed in a randomized manner. The positive sign indicates synergistic effect, were as negative indicates antagonistic effect which is represented in the polynomial equation model for Y. The response surface and perturbation plots obtained evidences the most significant factor on response. Change in the content of organic phase (methanol content) has the most significant effect on retention factor and development distance has a very mild effect on retention factor. Whereas, the other examined factor, i.e., bandwidth was not found to have any significant effect on response. Variation in retention factor was observed due to change in the ratio of methanol (increase in methanol content in mobile phase) increases the retention factor) content in the mobile phase, which is considered acceptable. The sample preparation technique employed for extraction of phthalates gave a good recovery of phthalates in the presence of complex matrix and the obtained results evidently proves that DMP, DEP and DBP where loaded in most of the cosmetic products like shampoo, lotion, nail polish, toothpaste and creams, selected for analysis. It is found that DEP is predominately found in most of the personal care products under investigation.
Figure 3: Densitogram of extracted sample solution containing mixture of DMP, DEP and DBP (Cream no. 4)
for determining phthalate esters in wine samples by solid-phase extraction and gas chromatography coupled with Iron- trap mass spectrometer detector. Anal Bioanal Chem. 2012;402(3):1373-81.
23. Ying G, Kurunthachalam K. Challenges encountered in the analysis of phthalate esters in foodstuffs and other biological matrices. Anal Bioanal Chem. 2012; 404(9):2539-54.
24. Antonia MC, Ryan SA, Manori JS, Arnetra RH, Larry LN. Automated solid phase extraction and quantitative analysis of human milk for 13 phthalate metabolites. J Chrom B. 2004;805(1):49-56.
25. Koichi I, Migaku K, Fumio O, Yoshihiro Y, Hiroyuki N. Column-switching high-performance liquid chromatography electrospray mass spectrometry coupled with on-line of extraction for the determination of mono- and di-(2-ethylhexyl) phthalate in blood samples. Anal Bioanal Chem. 2003;375(4):527-33.
26. Hanne F, Niels J, Anna-Maria A. Correlations Between Phthalate Metabolites in Urine, Serum and Seminal Plasma from Young Danish Men Determined by Isotope Dilution Liquid Chromatography Tandem Mass Spectrometry. J Anal Toxicol. 2010;34(7):400-10.
27. Manori JS, James LP, Larry LN, Antonia MC. Cross validation and ruggedess testing of analytical methods used for the quantification of urinary phthalate metabolites. J Chrom B. 2008;873(2):180-6.
28. Girish PK, Muddukrishna BS. Stability Indicating HPTLC Determination of Triamcinalone Acetonide in Bulk Drug and Sterile Injectable Suspension. J Young Pharm. 2016;8(4):430-5.
29. Gaurav MD, Sandeep PZ, Pratip KC, Hemant DU. Solicitation of HPLC and HPTLC Techniques for Determination of Rutin from Polyalthia longifolia
Thwaites. Pharmacognosy Res. 2014;6(3):234-9.
30. Kannissery P, Abu TM, Naseem AC, Shahid HA, Javed A. Pharmaceutical product development: A quality by design approach. Int J Pharm Invest. 2016;6(3):129-38.
tion and determination by gas chromatography–mass spectrometry, of di-(2-ethylhexyl)phthalate, nonylphenol, nonylphenol ethoxylates and polychlorinated biphenyls in sludge from wastewater treatment plants. Anal Chim Acta. 2007; 584(2):455-61.
13. Jidong L, Yaqi C, Yali S, Shifen M, Guibin J. Analysis of phthalates via HPLC-UV in environmental water samples after concentration by solid-phase extraction using ionic liquid mixed hemimicelles. Talanta 2008;74(4):498-504.
14. Francisco JLJ, Soledad R, Dolores PB. Determination of phthalate esters in sewage by hemimicelles-based solid-phase extraction and liquid chromatography– mass spectrometry. Anal Chim Acta. 2005;551(1-2):142-9.
15. Derek M, Ed S. Analytical methods for PCBs and organochlorine pesticides in environmental monitoring and surveillance: a critical appraisal. Anal Bioanal Chem. 2006;386(4):769-789.
16. Qiuhua W, Min L, Xiaoxing M, Weina W, Chun W, Xiaohuan Z, et al. Extraction of phthalate esters from water and beverages using a graphene-based magnetic nanocomposite prior to their determination by HPLC. Microchim. Acta. 2012; 177(1):23-30.
17. Elefteria P, Dionissios M, Nicolas K. Monitoring the sonochemical degradation of phthalate esters in water using solid-phase microextraction. Chemosphere. 2004;54(7):849-57.
18. Mir AF, Mohammad RAM. Air-assisted liquid–liquid microextraction method as a novel microextraction technique; Application in extraction and preconcentration of phthalate esters in aqueous sample followed by gas chromatography–flame ionization detection. Anal Chim Acta. 2012;728:31-8.
19. Yan-Bo L, Qiong-Wei Y, Bi-Feng Y, Yu-Qi F. Fast microextraction of phthalate acid esters from beverage, environmental water and perfume samples by magnetic multi-walled carbon nanotubes. Talanta 2012;90:123-31.
20. EarlsAO, Axford IP, Braybrook JH. Gas chromatography–mass spectrometry determination of the migration of phthalate plasticisers from polyvinyl chloride toys and childcare articles. J Chrom A. 2003;983(1-2):237-46.
21. Zhiyong G, Sui W, Danyi W, Meili W, Huina Z, Panpan G, et al. Development and application of a method for analysis of phthalates in ham sausages by solid-phase extraction and gas chromatography–mass spectrometry. Meat Sci. 2010;84(3):484-90.
22. Mario VR, Ivan N, Giuseppe C, Pasquale A. Evaluation of an analytical method
Article History: Submission Date: 26-11-16; Received Date: 11-02-17; Acceptance Date: 14-02-17.