RESULTS OF ECONOMIC ACTIVITY IN
S.C. URBANPROAS LLC CRAIOVA
Pânzaru R.L., Medelete D.M.
Faculty of Agronomy, University of Craiova
Key words: expenses, profit and loss, income, profit, revenue
ABSTRACT
The results translate into real business activity created and services provided. They are designed to meet consumption needs in society.
These results, subject to the existence market reach consumers through the sale and purchase, so through their expression monetary funds. Therefore, the results of the company have, on the one hand a physical expression, on the other hand, a monetary expression.
Physical expression is done through natural-physical units used to measure the quantity of goods produced by the enterprise. These units vary depending on the specific physical goods produced (meters, liters, pairs etc.). And measurement units used in natural-conventional, in cases when there are goods of the same type but with different characteristics.
Expression of cash (money) is undertaking more comprehensive results. Thus, the overall results may be expressed through turnover, the final results on the indicator value added tax results through net profit.
INTRODUCTION
The unit was established in 2003 (November 20), having as main activity is trade that corresponds to NACE group 742, and the main activity is coded to Class 7420 "activities of architecture, engineering and technical consulting services related thereto." During its existence, the company can run and other activities classified as follows: NACE groups 201 – 205; 300, 361, 366, 371 and 372; 451 455; 501 – 505, 511 – 515, 518 519, 521 – 527, 551 -555; 602, 631 - 634; 701 – 702, 711 – 714, 741 – 748; 930.
At establishment, the unit decided a share capital of 2,000,000 ROL, divided into 20 shares (ROL 100,000 each).
Constitutive Act contains rules on how to increase or decrease the capital, says the person in charge of management of the company, the arrangements for the transfer of shares, how to achieve effective management, ways to use the benefits, the establishment of reserve funds amortization fixed assets, relationships with third parties, merger, demerger, dissolution, property insurance, dispute resolution.
From the time of incorporation to date, the company has undergone some transformations that are reported in addenda.
In 2008, the Trade Register Office attached to Dolj Court issued a Foundation Certificate certifying the address where is the registered office of the company and that it meets the specific operating activity declared: CAEN code 7112 Activities engineering and related technical consultancy.
METHOD AND MATERIAL
In the literature, it records a complex of methods used to quantify phenomena that occur on farms.
For the work, they are determined according to the methodology recommended and performed indicators, grouped into three categories:
indicators of income - turnover, production sold, revenues from the sale of goods, income subsidies, net turnover, income related to the cost of production in progress, other operating income, operating income, interest income, income financial and other financial income, income from investments, income from other investments and loans, value adjustments on financial assets and investments held as assets, extraordinary income, total revenues;
indicators expenses: raw materials and other material expenses, expenses (water, energy), total expenses materials and related goods, wages, security charges, staff costs, adjustments for property, other operating expenses (external services, other taxes - taxes - payments, damages donations transferred assets), total operating expenses, interest expense and other financial expense, total financial expenses, extraordinary expenses, total expenses;
profitability indicators: profit or loss from operations, profit or loss Financial profit or loss Current profit or loss Extraordinary profit or loss Gross profit tax, net profit or loss, the rate of profit or loss from operations, profit rate or current loss rate of profit or financial loss, loss of profit or extraordinary rate, gross profit or loss rate, the rate of net profit or loss.
RESULTS AND DISCUSSIONS
Table 1 shows the indicators of income for the years 2012, 2013 and 2014.
Table 1. Indicators of income
-lei-No. Specification
2012 2013 2014 Average**
Eff.* Eff.* 2013
/2012** Eff.*
2014
/2013** Eff.
Average /2014 1. Production sold 41030 19150 46,67 50100 261,62 36760 73,37
2 Net turnover
(Equal to 1) 41030 19150 46,67 50100 261,62 36760 73,37
I Operating income
(Equal to 2) 41030 19150 46,67 50100 261,62 36760 73,37
3 Interest income - 41 100 - - 13,67
-4 Other incomes - - -
-II Financial income
(3+4) - 41 100 - - 13,67
-III Extraordinary
income - - -
-IV Total income
(I+II+III) 41030 19191 46,77 50100 261,06 36773,67 73,40
*extracts from the profit and loss account (2012 – 2014) **own calculation;
The first indicator of income is the production sold. This indicator varied unevenly the level of 41030 lei in 2012, being followed by a value of 19150 lei for 2013 (-53.33% in dynamic), then the indicator increase to 50100 lei at 2014 (overrun by 2.61 times the reporting base). In these circumstances the average period reached 36760 lei, which resulted in a decrease of 26.63% compared with the previous term of the dynamic series.
Sold production was identical to the turnover since the company did not record any income from the sale of goods and income from subsidies.
production and turnover since the company did not record any income related to the cost of production in progress and no other income.
The unit recorded interest income of only 41 lei in 2013.
The Company has not recorded other financial income and as a result total revenue were: 41030 lei in 2012; 19191 lei in 2013 (46.77% compared to previous year); 50100 lei in 2014 (+ 161.06% compared to the reporting base); 36773.67 lei for the period average (73.40% against the comparative limit).
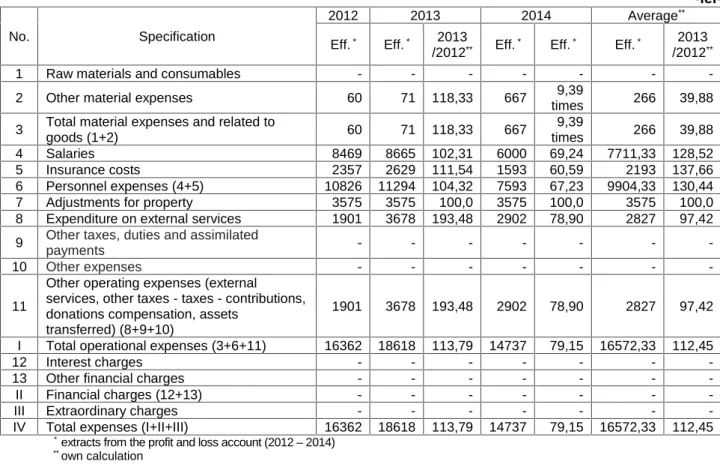
Table 2 shows the level of indicators of expenditure for the period under review. Refer to operating expenses, financial expenses, extraordinary expenses and total expenses.
Table 2. Indicators of spending
-lei-No. Specification
2012 2013 2014 Average**
Eff.* Eff.* 2013
/2012** Eff.* Eff.* Eff.*
2013 /2012**
1 Raw materials and consumables - - -
-2 Other material expenses 60 71 118,33 667 9,39
times 266 39,88
3 Total material expenses and related to
goods (1+2) 60 71 118,33 667
9,39
times 266 39,88 4 Salaries 8469 8665 102,31 6000 69,24 7711,33 128,52 5 Insurance costs 2357 2629 111,54 1593 60,59 2193 137,66 6 Personnel expenses (4+5) 10826 11294 104,32 7593 67,23 9904,33 130,44 7 Adjustments for property 3575 3575 100,0 3575 100,0 3575 100,0 8 Expenditure on external services 1901 3678 193,48 2902 78,90 2827 97,42
9 Other taxes, duties and assimilated
payments - - -
-10 Other expenses - - -
-11
Other operating expenses (external services, other taxes - taxes - contributions, donations compensation, assets
transferred) (8+9+10)
1901 3678 193,48 2902 78,90 2827 97,42
I Total operational expenses (3+6+11) 16362 18618 113,79 14737 79,15 16572,33 112,45
12 Interest charges - - -
-13 Other financial charges - - -
-II Financial charges (12+13) - - -
-III Extraordinary charges - - -
-IV Total expenses (I+II+III) 16362 18618 113,79 14737 79,15 16572,33 112,45
*extracts from the profit and loss account (2012 – 2014) **own calculation
The Company has not recorded expenses for raw materials and consumables.
Other material costs have an average of 266 lei (-60.12% dynamic), with participation in the level of temporal sequence of 60 lei in 2012; 71 lei in 2013 (+ 18.33%); 667 lei in 2014 (9.39 times exceeded the previous term dynamic of the series).
The unit did not record expenditure on goods and did not benefit from trade discounts. Following this situation, the total expenditure relating to goods and materials was identical to the situation for other expenses specified materials.
Wages increased from 8469 lei in 2012 to 2.31% in 2013 (8665 lei) and then decreased by 30.76% for 2014 (6000 lei). The average of period exceeding the compared term with 28.52% - 7711.33 lei.
Insurance spending have averaged 2193 (+ 37.66% over the reporting basis), with extremes of 1593 lei in 2014 and 2629 lei in 2013 (+ 11.54% in dynamics).
the overruns of reference terms as follows: 4.32% for 2013 and 30.44% in the period average. If evolution is decreasing 2014: -32.77% versus the reference term.
Another item of expenditure is known as adjustments for property, indicator which has a linear regression. Year indicator level was constant for the period 2012 - 2014 lei 3575 respectively.
Expenditure on external services were 1901 lei in 2012, increased by 93.48% in 2013 (3678 lei) and decreased by 21.10% in 2014 (2902 lei), while the average period was lower by 2.58% over the reporting limit (2827 lei).
The Company has not recorded expenses with other taxes, duties and assimilated payments or item "other expenses". Under these conditions, the indicator other operating expenses, was identical to the situation specified for external services expenses.
Total operating expenses were based on total expenditure relating to goods and materials, personnel costs, adjustments for property and other operating expenses. Based on indicator values, previously named, has been reached sequential levels of: 16362 lei in 2012; 18618 lei for 2013 (+ 13.79% in dynamics); 14737 lei at the level of 2014 (-20.85% compared to term of reference); 16572.33 lei for average of the period (+ 12.45% in dynamics made). These values noted uneven trend in operating expenses for the period considered.
The Company has not recorded financial expenses and any extraordinary expenses, which determined that the level of total expenditure are identical to the total operating expenses.
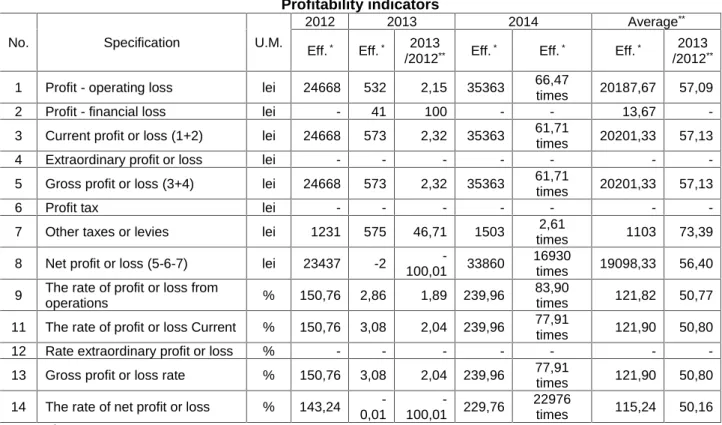
Table 3 shows the level of profitability indicators for the period under review.
The operating profit is characterized by an average of 20187.67 lei (-42.91% compared to 2014), resulting from the sequential annual value levels of 24668 lei in 2012, 532 lei specific to 2013 (-97.85% vs. previous year) and 35363 lei corresponding to the year 2014 (outrunning of 66.47 times the baseline).
Financial income was recorded only in 2013-41 lei. Following this situation, average of the period reaches 13.67 lei.
Table 3. Profitability indicators
No. Specification U.M.
2012 2013 2014 Average**
Eff.* Eff.* 2013
/2012** Eff.* Eff.* Eff.*
2013 /2012**
1 Profit - operating loss lei 24668 532 2,15 35363 66,47
times 20187,67 57,09
2 Profit - financial loss lei - 41 100 - - 13,67
-3 Current profit or loss (1+2) lei 24668 573 2,32 35363 61,71
times 20201,33 57,13
4 Extraordinary profit or loss lei - - -
-5 Gross profit or loss (3+4) lei 24668 573 2,32 35363 61,71
times 20201,33 57,13
6 Profit tax lei - - -
-7 Other taxes or levies lei 1231 575 46,71 1503 2,61
times 1103 73,39
8 Net profit or loss (5-6-7) lei 23437 -2
-100,01 33860
16930
times 19098,33 56,40
9 The rate of profit or loss from
operations % 150,76 2,86 1,89 239,96
83,90
times 121,82 50,77
11 The rate of profit or loss Current % 150,76 3,08 2,04 239,96 77,91
times 121,90 50,80 12 Rate extraordinary profit or loss % - - -
-13 Gross profit or loss rate % 150,76 3,08 2,04 239,96 77,91
times 121,90 50,80
14 The rate of net profit or loss % 143,24 -0,01
-100,01 229,76
22976
times 115,24 50,16
Current profit appears as the sum of operating profit and profit financially. So we talk about values of 24668 lei in 2012, 573 lei for 2013, 35363 lei in the year 2014 and of 20201.33 lei for average of the period. Dynamic indicator is characterized by values above par of the constituent indices in 2014 (outrunning of 61.71 times the comparator) and subunit for other components (2.32% in 2012 and 57.13% for the review period average).
Gross profit is equal to the current profit, as the company has not recorded an extraordinary profit or loss
The company did not pay income tax but pay "other taxes" which stood at 1231 lei in 2012, 571 lei in the year 2013 (-53.29% dynamic) 1503 lei in 2014 (outrunning to Terms of reference of 2.61 times). In these circumstances the average period was 1103 lei, a level that was lower with 26.61% to the reporting base.
Net profit or loss is characterized by an average of 19098.33 lei, while the profit occurred in 2012 and 2014, 23437 and 33860 lei respectively, and in 2013 has been a loss of 2 lei.
Operating profit rate was 150.76% in 2012, 2.86% for 2013, 239.96% in 2014 and 121.82% for the average of the period. The evolution over time of the indicator takes the form uneven, with decreases in 2013 and average of the period, and very spectacular increases in the year 2014.
It can be seen that the current profit rate is higher than the previous indicator, for 2013 (because at the time the company recorded a financial profit of 41 lei) - 3.08%. As for 2012 and 2014 do not show differences compared with the previous indicator, reaching an average of 121.90%. Dynamic is similar to that shown for operating profit rate.
The gross profit rate is equal to the current rate of profit since the company did not record extraordinary profit or loss.
Last profitability indicator refers to the rate of net profit or loss. It can be seen that this indicator has averaged 115.24% (below the level of 2014 with 49.84%). This is due to the 143.24% specific rate of 2012, -0.01% characteristic situation for 2013 and the level of 229.76% characteristic of 2014.
CONCLUSIONS
- in total revenue structure (figure 1), prevailing operating revenues with 99.60%,
Fig.4.1. The ratio of total income and its main components (%)
TOTAL INCOME OPERATING INCOME FINANCIAL INCOME INTEREST INCOME
100 99,6 0,4
financial income is only 0.40% of the total. Operating revenue components are represented only by net turnover - 99.60%;
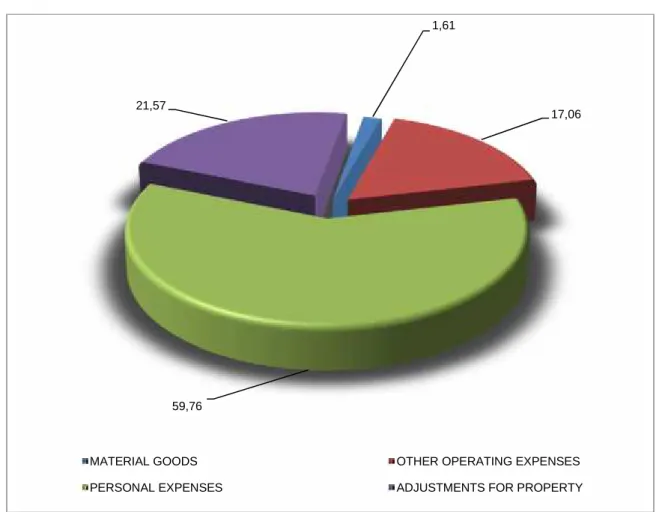
- total expenditure are identical to the operating expenses. In total operating expenditure structure, prevailing personnel costs - 59.76%, followed by adjustments on assets - 21.57% Other operating expenses - 17,06%. The lowest share is held by expenses related to materials and goods (1.61%) - Figure 2;
Fig. 2. Total expenditure structure (%)
- unit recorded operating profit and financial profit - 20187.67 respectively 13.67 lei, which make up the current profit - 20201.33 lei;
- given that the unit has not recorded profits or extraordinary losses, there is similarity between current profit and the profit, the latter decreasing by taxes paid (1103 lei) so as to arrive at net profit of 19098.33 lei. It is pointed out that in 2013 has been recorded a loss of 2 lei;
- with poor outcomes stands 2013 and with best results 2014 year;
- it requires greater attention on administration expenses and paying attention to customer portfolio for the convenient of economic results.
BIBLIOGRAPHY
1. Dima I. C., 2000, Company's management, Publisher Scrisul Românesc, Craiova
2. Goagără D., 2012, Elements of accounting agrarian university for distance learning manual, Publisher Universitaria, Craiova
1,61
17,06
59,76 21,57
MATERIAL GOODS OTHER OPERATING EXPENSES
3. Neagu Cibela, 2004, Company's management, Publisher Tritonic, București 4. Nicolescu O., Verbancu I., 2002, Management and Efficiency, Publisher Nova,
București
5. Pânzaru R.L., Medelete D. M., Ştefan G., 2011, Management and marketing for land measurements, Publisher Universitaria Craiova