Volume 3, Number 1, 2020, pp. 1-18.
p-ISSN: 2614-7483, e-ISSN: 2614-7475, DOI: https://doi.org/10.12928/joves.v3i1.2085.
Received March 31, 2020; Revised April 28, 2020; Accepted April 28, 2020
Development of Learning Devices of Basic Electronic Virtual
Laboratory Based on PSPICE Software
Muchlas*, Pramudita Budiastuti
Universitas Ahmad Dahlan, Jl. Ahmad Yani, Tamanan, Banguntapan, Bantul, DIY Indonesia *Corresponding author, e-mail: [email protected]
Abstract
The availability of modules to support basic electronic practices based on virtual laboratories has not yet met the needs. The purpose of this development research is to produce basic electronic practice learning devices based on the PSPICE application program. The development procedure uses ADDIE (analysis, design, development, implementation, evaluation). ADDIE is used to direct the design process as specified. Product performance was tested using ongoing formative evaluation. The product feasibility test uses a comparative analysis of the results of the PSPICE experiment against the theory. The results show that all modules developed can display the same characteristics as their theoretical character. The results show that the modules have very good performance. Modules are suitable for use as a medium for basic electronic practice using PSPICE-based virtual laboratories. The products are in the form of electronic circuits with 31 schematic PSPICE formats. Product results to support basic electronic practices covering topics: capacitor filling and discharging, RC circuits, diode characteristics, wave forming circuits, rectifier circuits, voltage clamp, voltage circuits, transistor characteristics, and amplifier transistor.
Keywords: basic electronics, PSPICE software, virtual laboratory
How to Cite: Muchlas & Budiastuti, P. (2020). Development of learning devices of basic electronic virtual laboratory based on PSPICE software. Journal of Vocational Education Studies, 3(1), 1-18. DOI: https://doi.org/10.12928/joves.v3i1.2085.
INTRODUCTION
Science and technology are developing very rapidly. The development of science and technology entered the 4th phase, called Industry 4.0. Industry 4.0 brings up smart factories in all sectors of the industry based on cyber-physical systems, internet of things, cloud computing, and cognitive machines. The progress of the industrial revolution is a factor in increasing labor market demands for the qualifications of graduates of technical higher education. The skills that are relevant and adaptive to the industrial world are the demands of the workforce needs of employers. Lewis (2018), a content marketing manager from LinkedIn, said that in addition to 10 technical skills, there are four soft skills, namely leadership, communication, collaboration, and time management. The four soft skills are needed by the business world and the industrial world in this era.
Virtual laboratories can improve students' understanding of practical material (Colace, Santo, & Pietrosanto, 2004), more efficient (Saleh et al., 2009), easier and more flexible than hands-on (Bailey & Freeman, 2010). In addition, practices with an online learning approach using virtual laboratories can also be held collaboratively (Muchlas, 2015). Collaborative online learning through virtual laboratories can develop soft skills such as leadership, communication, collaboration, and time management as the demands of the modern industrial world.
virtual laboratory devices has not met expectations, especially practical learning. This is a new level of science that must be developed and solved (Prakash, 2013)
Specifically, for basic electronics practices, there are currently many tools that can be used to build virtual laboratories, and one of them is the PSPICE application program. However, the availability of software-based modules to support the practice of basic electronics is still lacking. Based on this fact, it is necessary to develop virtual laboratory modules based on PSPICE application programs to support the implementation of basic electronic practices based on virtual laboratories.
Ma & Nickerson (2006), Krivickas & Krivickas (2006), and Lustigova & Lustig (2009) mentioned that in addition to hands-on laboratories there are other types of laboratories namely virtual laboratories and remote labs. The last type of laboratory requires the support of various information technology applications. Virtual laboratories can support conceptual understanding, the development of design, and professional skills (Ma & Nickerson, 2006). In addition, it has advantages for concept validation, no time and physical limitations, pedagogical aspects are better than other types, a safe environment for dangerous, flexible and simple experiments, sufficient reinforcement through the use of animation and virtual reality software (Elawady & Tolba, 2009).
Ma & Nickerson (2006) stated that the procurement and operating costs of hands-on laboratories are more expensive than virtual laboratories. It is because their real nature requires a large space, laboratory materials, and a large allocation of time for lecturers or instructors (Philippatos & Moscato, 1971; Hessami & Sillitoe, 1992; Farrington et al., 1994). In addition, students feel uncomfortable working in hands-on laboratories (Cruickshank, 1983; Magin & Reizes, 1990; Dobson et al., 1995). Hands-on laboratories are not able to provide students with special needs (Colwell et al., 2002), and cannot serve the needs in the implementation of distance learning (Shen et al., 1999; Watt et al., 2002). Virtual laboratories have good feasibility to consider as a means of supporting practical activities.
The implementation of a virtual laboratory is to use a simulator. Things that need to be considered in designing a virtual laboratory based on simulators include (1) attributes, (2) accuracy, (3) delivery modes, (4) learning strategies, (5) models and components, (6) providing learning objectives and instructions for use (Alessi & Trollip, 2001).
PSPICE is a simulator application software that provides analog and digital electronic circuit analysis facilities (Cadence Design Systems, 2016). Tobin (2007) taught the basic principles of engineering that always have less time to teach. Such a situation results in students not gaining a good understanding of engineering practices and design techniques. PSPICE can help students understand the basic concepts of electronic engineering, and practice it well. Besides using PSPICE, it can test and simulate each subsystem and can estimate problems that arise when several subsystems are connected. It is often found that in real systems students have difficulty measuring the input and output impedances of an electronic circuit. In fact, information on the value of the impedance is needed to understand the effects of loading a system by other sub-systems. Through PSPICE, students can easily measure the input and output impedance of a circuit. In general, research opinion above has found that PSPICE can provide valuable experience for students, which is not easily obtained in practice using real laboratories.
Kashif & Saqib (2008) in their research found that students were satisfied with the use of PSPICE software as a medium for power electronics practice. Simulations using PSPICE can improve the ability of students to learn and understand the concept of electronics which is demonstrated by increased analysis and design skills.
Development of Learning Devices Muchlas & Budiastuti
benefits. The research found that at the end of the project, students felt many benefits from using virtual laboratories such as being able to verify answers and fix them quickly and using Multisim to solve electronic circuit problems. Aguilar-Peña et al. (2016) in his research on developing blended learning devices, found that using PSPICE students gained a good understanding of photovoltaic cells, modules, or generators. Through the use of PSPICE, the characteristics curve of a photovoltaic system and basic parameters such as voltage, current, power, and energy can be easily obtained by students for further analysis and representation. This research found a reality that the simulation environment based on PSPICE application formed a virtual laboratory for electronics practice. Dak, Khoje & Pardeshi (2017) stated that laboratories in education are the ideal place for students to practice concepts through experimental activities. The research found the use of different software, including PSPICE, can help students improve the effectiveness of learning electronic concepts and their application in the real world.
LITERATURE REVIEW
In the context of this study, resources can be seen as tangible assets that are adequately provided by the school to be used by teachers and students for effective teaching and learning to take place in TVET institutions. Resources have been classified into the physical facilities and instructional resources (Kigwilu & Akala, 2017). Physical facilities are tangible assets that can easily be seen and observed in TVET institutions. They include entrepreneurship resource centers, staff quarters, workshops, laboratories, equipment, lecture halls, lecture rooms, ICT centers, libraries, health-care centres, hostels, lecturers’ offices, sports grounds, structures, et cetera. These physical facilities can contribute directly or indirectly to the teaching and learning processes in TVET institutions. They provide TVET institutions the conducive environment and atmosphere for teaching and learning effectiveness to take place (Abdullahi, Yusoff, & Gwamna, 2017).
influence effective teaching and learning in TVET institutions. As such, the effective teaching and learning in TVET institutions can only be possible when instructional resources are always utilized.
The inadequacy of physical facilities can seriously compromise the role of instructional resource utilization in teaching and learning process in TVET programs. Particularly, lack of modern instructional resources hinders teaching and learning of skill courses (Bandele & Faremi, 2012). In many developing nations, instructional resources are lacking for successful educating and learning in TVET establishments (Wondaferew, 2012). In Nigeria, for instance, Okwudishu (2005) and Gambari & Okoli (2007) affirmed that the non-utilization of instructional resources in TVET institutions has hampered teachers teaching and students learning activities. The study conducted by Okolocha & Nwadiani (2015) have also found that the instructional resources for teaching of vocational business education courses as regards the perception of business education lecturers are rarely used in both colleges of education and universities in South-South, Nigeria.
A review of the literature, as exemplified above, simply reveals that many authors (i.e. Yara & Otieno, 2010; Owoeye & Yara, 2011; Moochi, 2012; Osarenren-Osaghae & Irabor, 2012; Oguntuase, Awe & Ajayi, 2013) have investigated the influence of resource adequacy and utilization on curriculum implementation. However, none of these authors and researchers, nor more current investigations (Chukwunwendu, 2015; Munguti, 2016; Omae, et al., 2016; Chepkonga, 2017; Kigwilu & Akala, 2017; Ubulom & Ogwunte, 2017; Dhakal, 2017; Mutindi, 2018) on curriculum implementation specifically assessed the level of resource adequacy and utilization for teaching and learning effectiveness in TVET programs. Hence, the need for the extant study is informed by the limitations of earlier and more current articles, which suggests a need for further research on resource adequacy and utilization for teaching and learning in TVET programs.
RESEARCH METHOD
This study uses the development of ADDIE (analysis, design, development, implementation, evaluation) in directing the product creation process to meet the expected specifications
Development Procedure
Analysis
Development of Learning Devices Muchlas & Budiastuti
laboratory. Based on the analysis that has been done, the use of products developed as learning media in the classroom, practical tools in the laboratory, and independent learning takes 90 minutes.
Design
The design step begins with determining the type of media used by the PSPICE software. Furthermore, hardware and software supporting PSPICE were formulated. To support the design process, a literature exploration was conducted as a basis for selecting the appropriate form of basic electronic practice module design. Through library exploration, electronic circuit design has been collected for the development of practice modules for all topics.
Development
This phase of the activity begins with determining the type of hardware, software, and development base that will be used to build the simulator. The development of this learning tool considers the aspects of cost efficiency, flexibility of use, and attractiveness of use. Therefore media in the form of a simulator was chosen. Through this stage, the formulation of media elements is carried out and integrated into one unified PSPICE software practice module. At this stage of development, the determination of component values is used to construct the circuit and its simulation parameters.
Implementation
The activity at this stage is to socialize the PSPICE-based virtual laboratory that was developed so that it can be used by lecturers/teachers and students/students. In this implementation phase, the developer/researcher provides the necessary assistance and support.
Evaluation
In this phase, evaluation is carried out on the student and the learning program. Evaluation involves the use of a developed PSPICE-based virtual laboratory, product care, and product revisions. All processes from analysis to an evaluation form a progressive cycle to ensure the availability of the media.
Product Testing
The product is tested through formative evaluation with stages: (1) ongoing evaluation by the developer while the development process is in progress, to ensure all components can function properly (2) alpha testing by experts and beta testing by prospective users. To provide input for improvement/revision so that the quality media (Surjono, 2017). Summative evaluation is used to determine the effectiveness of learning. This research is only conducted ongoing evaluation test to ensure that all the series developed to provide good performance. The testing criteria use a comparative theory that has been presented in the literature review. The performance of the circuit that has been developed has a good status, so it is appropriate to use if the character displayed is the same or not significantly different from the theory.
RESULTS AND DISCUSSION
Product Development
Product Performance
This research conducts on-going product testing. On-going tests to ensure that all electronic circuits developed can work properly.
Capacitor Filling and Discharging Circuit Performance Test
Experiments using PSPICE for charging capacitors produce an output graph, as shown in Figure 1. Based on Figure 1, we see the capacitor charging voltage. The results show the same form in the form of an exponential rise to the graph obtained theoretically. The tested RC circuit value is 1ms, at t = RC = 1ms, the value of the capacitor charging voltage is 6.33V from 10V, this value is in accordance with theoretical computation when at t = RC the value is 63% of the capacitor source voltage. The results comparison chart also shows that when t = 5RC = 5ms, the capacitor starts to be fully charged, and this is in accordance with the theoretical model of the voltage value at the capacitor charging.
Figure 1. Comparison of the voltage curve and current of a capacitor charging SPICE experimental results and theoretical.
Figure 1 shows the capacitor charging current curve through the PSPICE experiment, whose form is exponentially down. In addition, when t = RC = 1ms, the capacitor current value of the PSPICE experimental results is 0.371mA from 1mA, this condition is in accordance with the theoretical calculation that when t = RC the capacitor current is 37% of the maximum current. Through the Figure 1 (bottom) is also shown when t = 5RC = 5ms, the current capacitor starts at 0, which indicates that the capacitor is fully charged. Experiments using PSPICE for the capacitor discharge circuit, resulting in a voltage curve and capacitor current shown in Figure 2.
Development of Learning Devices Muchlas & Budiastuti
Figure 2 shows that the discharge curve of the capacitor discharge from the PSPICE experiment, which is an exponential function, goes down according to the theory as the right-hand picture. When t = RC = 1ms, the capacitor voltage becomes 0.371 V from 10V, this shows the same character as the theoretical character, and the voltage becomes 0.37 Vi, or 37% of the initial condition voltage. The discharge current character shows the same state between the results of PSPICE and the theory; both of them are exponentially upward functions. In the capacitor discharge current curve when t = RC = 1ms, the current value is -0,371mA from -1mA. This shows the same character as the character of terrorism, which is worth 37% of the maximum current. Figure 2 shows the voltage and current character of the results of PSPICE when t = 5RC = 5ms. The starting voltage is completely empty, and the current starts to zero, a state also occurs in the theoretical character of the capacitor voltage and current discharging. On the basis of a comparison of the results PSPICE and theoretic character, it is showing the same characteristics. It can be stated that the capacitor charging and discharging circuit developed through this research, is suitable to be used as a virtual laboratory support module for basic electronics practice.
RC Circuit Performance Test
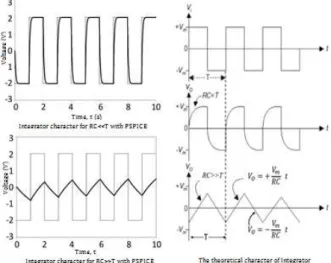
Figure 3 shows an integrator that is given a box-shaped voltage input from PSPICE and results from theoretical computing.
Figure 3. Integrator character with square wave input (thick line: output voltage; thin line: input voltage)
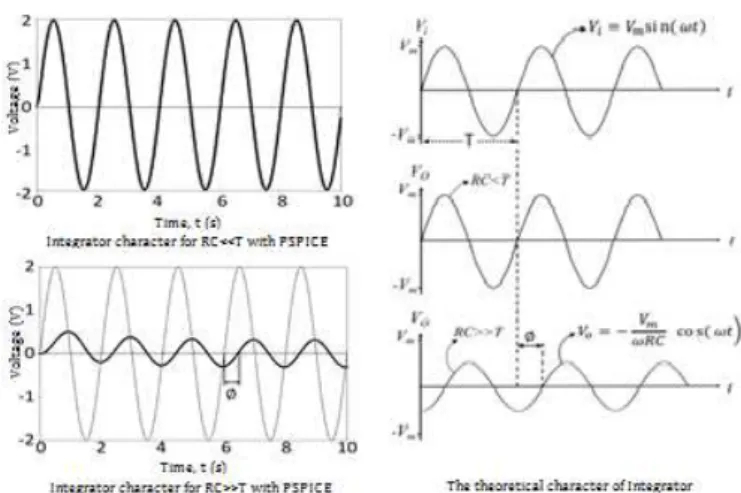
Figure 4. Integrator character with sine wave input (thick line: output voltage; thin line: input voltage)
In Figure 4 (bottom left) the integrator character of the results of experiments with PSPICE if given input in the form of sine for RC >> T so that the output voltage will be delayed by 90o with respect to the phase of the input voltage. But if RC << T the top left
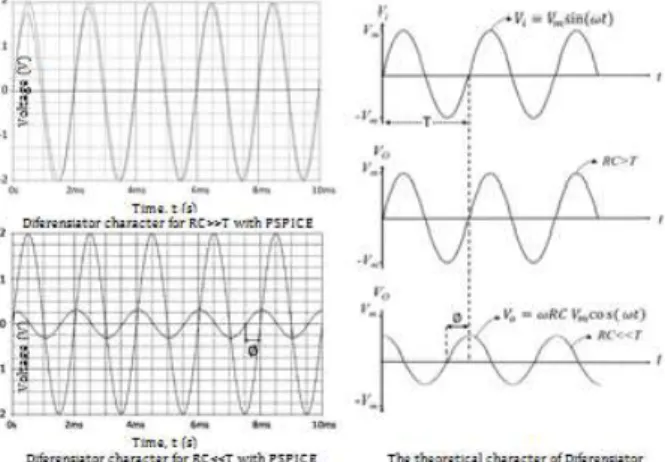
picture, the phase output voltage is almost the same as the input voltage phase. This condition is in accordance with the theoretical character of the lower right integrator image, for RC >> T and the middle right for RC << T. The integrator character of the PSPICE experimental results and the theoretical character with the square and sine wave inputs, for RC >> T and RC << T have high matches. It can be stated that the series of integrators resulting from the development of this study is feasible to be used as a virtual laboratory support module for electronic practice. Furthermore, the comparison of the characteristics of the differential set of experimental results with PSPICE is shown in Figure 5. Figure 5 shows that for RC << T the character of the differentiator can convert a square wave into a pulse of differentiation with a height twice the input voltage. As for the RC >> T state, the output differentiator is in the form of a defective box waveform. This character is in accordance with the theoretical character shown in Figure 7, lower right for RC << T and middle right for RC >> T.
Figure 5. Differentiator character with square wave input
Development of Learning Devices Muchlas & Budiastuti Figure 6. The differential character with sine wave input
In Figure 6 (bottom left) shows the differentiator character with PSPICE for sine wave input when RC << T. The output voltage precedes 90o to the input voltage phase.
While if RC >> T (top left figure), the phase of the output voltage is almost the same as the phase of the input voltage. This indicates a good differentiator circuit because the character's appearance matches the theoretical character, as shown in the lower right picture for RC << T and the middle right picture for RC >> T conditions. Based on the comparison between the character of the results of the PSPICE experiment and the character of the theory shows the two have high similarity. It can be stated that the developed differentiator circuit is suitable for use as a practice module supporting basic virtual electronic laboratories.
The results of the PSPICE experimental character of the low pass filter and high pass filter are shown in Figure 7.
Figure 7. Frequency response of low pass and high pass filter results from PSPICE experiments
Based on the amplitude response of the low pass filter results of experiments with PSPICE, the cut-off frequency is 1KHz, and the circuit output voltage is 0.707 V from 1 V (top left figure). Meanwhile, the phase response looks at different phase output voltage to the input voltage. At very low frequencies can be seen the phase difference of 0o, at a
cut-off frequency of -45o, and at a very high frequency, the phase difference is -90o (top right
frequency of 0.707 V. It same value as the value given by the character of the theory. Based on the phase response at very low frequencies, the phase difference is 90o, the cut-off
frequency is 45o, and at high frequency the phase difference is 0o. Based on the results of
this experiment, the high pass filter series developed very well. The character is in accordance with the character of the theory so that it can be used for basic virtual laboratory electronics practice.
Diode Characteristics Performance Test
The diode characterization series consists of forward and backward bias. The results of the two characterization experiments using PSPICE are shown in Figure 8.
Figure 8. Results of measurement of 1N4002 diode characteristics using PSPICE In general, the characteristic curve of diode 1N4002 shows the similarity to the theoretical curve. In the area of forward bias, diode current in the form of an exponential function, rising to the voltage with Vγ = 0.69V is almost the same as the theoretical value
ranging from 0.6 to 0.7 Volts for silicon diodes. In the reverse bias, the current is so small that it reaches a breakdown voltage of -100V according to the datasheet. Through the forward bias curve, the forward voltage value is 0.96V for the forward current of 1A. This value is almost the same as the value of the datasheet that is at 1A forward current for 25oC temperature, forward voltage of 1N4002 diode is 0.93 to 1.1V. The results of the
1N4002 diode characterization experiment using PSPICE produce the same curves and parameters with the theoretical characteristics and character set by the factory so that the series of development results is feasible to be used in basic virtual electronics laboratory practices.
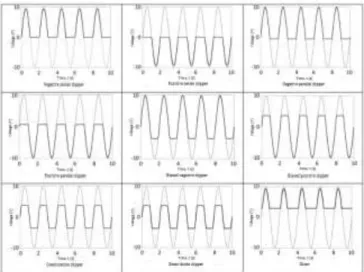
Test Performance of Wave Forming Circuits
Experiments using PSPICE for wave-forming circuits produce the character of the circuit as shown in Figure 9.
Development of Learning Devices Muchlas & Budiastuti
Based on Figure 9, the characteristics of all the wave-forming circuits with PSPICE are the same as the theoretical characteristics. This indicates that the wave-forming circuits using PSPICE are suitable for use in basic electronic practice.
Test Rectifier Circuit Performance
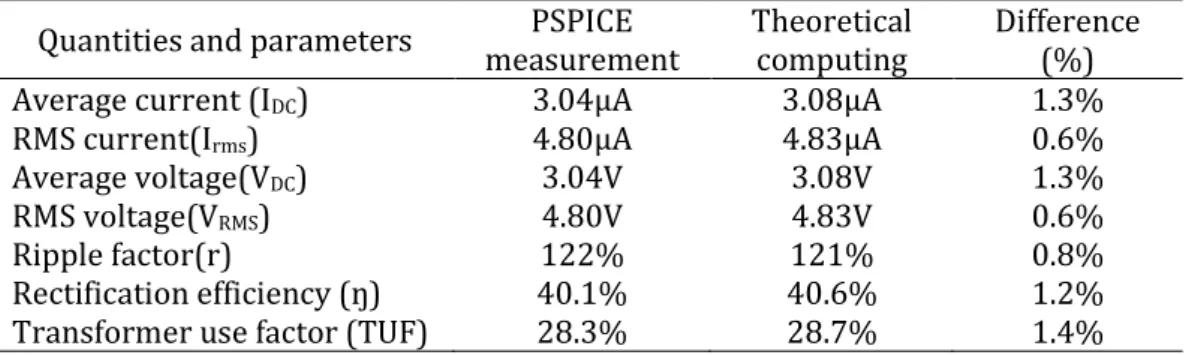
The results of experiments with PSPICE for a half-wave rectifier are presented in Table 1.
Table 1. Quantities and parameters of the half-wave rectifier with a light load for Im =
9,665μA and Vm = 9,665V
Quantities and parameters measurement PSPICE Theoretical computing Difference (%) Average current (IDC) 3.04µA 3.08µA 1.3%
RMS current(Irms) 4.80µA 4.83µA 0.6%
Average voltage(VDC) 3.04V 3.08V 1.3%
RMS voltage(VRMS) 4.80V 4.83V 0.6%
Ripple factor(r) 122% 121% 0.8%
Rectification efficiency (ŋ) 40.1% 40.6% 1.2% Transformer use factor (TUF) 28.3% 28.7% 1.4%
In Table 1, a half-wave rectifier with a light load from the PSPICE experiment can display current and voltage and performance parameters that are the same as the theoretical character. The percentage difference of all quantities and parameters used as a comparison value is below 5%, a condition that shows the nature of the PSPICE series is the same as the nature of theoretical computing. For full load operation, the maximum value of the full load with PSPICE is 9.05V, according to theoretical calculations of 9.09V or only 0.4% difference. The results of the PSPICE experiment for a full-wave rectifier are shown in Table 2.
Table 2. Quantities and parameters of the full-wave rectifier with a light load for Im =
9,665μA and Vm = 9,665V
Quantities and parameters measurement PSPICE Theoretical computing Difference (%) Average current (IDC) 6.07µA 6.16µA 1.4%
RMS current(Irms) 6.79µA 6.83µA 0.6%
Average voltage(VDC) 6.07V 6.16V 1.4%
RMS voltage(VRMS) 6.79V 6.83V 0.6%
Ripple factor(r) 50.1% 48.2% 4%
Rectification efficiency (ŋ) 79.9% 81.1% 1.5% Transformer use factor (TUF) 56.6% 57.3% 1.2%
Based on Table 2, the voltage, current, and circuit performance parameters using PSPICE are almost the same as theoretical computational values where the percentage difference value is less than 5%. For full load operations, the full-wave rectifier also provides the same output voltage values as theoretical calculations, both of which have a minimal difference of 0.4%. Table 3 results of the bridge rectifier PSPICE experiment.
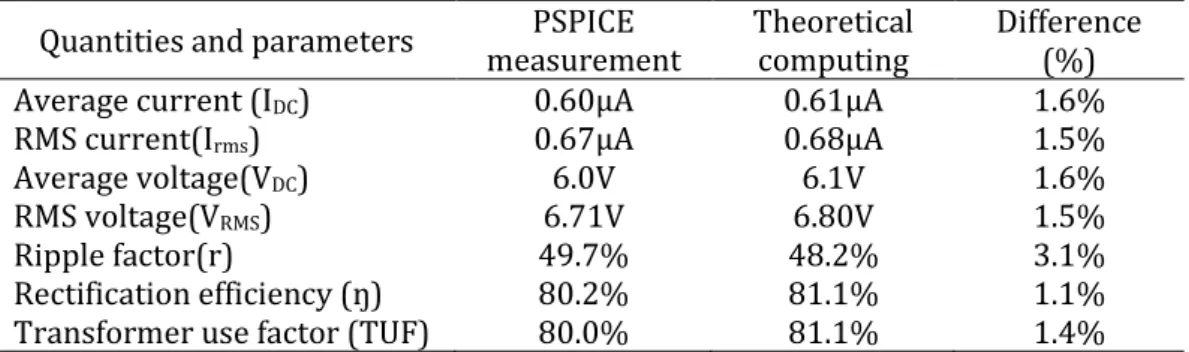
Table 3. Quantities and parameters of the bridge rectifier with a light load (RL = 10MΩ) for
Im = 0.9565µA and Vm = 9.565V
Quantities and parameters measurement PSPICE Theoretical computing Difference (%) Average current (IDC) 0.60µA 0.61µA 1.6%
RMS current(Irms) 0.67µA 0.68µA 1.5%
Average voltage(VDC) 6.0V 6.1V 1.6%
RMS voltage(VRMS) 6.71V 6.80V 1.5%
Ripple factor(r) 49.7% 48.2% 3.1% Rectification efficiency (ŋ) 80.2% 81.1% 1.1%
Transformer use factor (TUF) 80.0% 81.1% 1.4%
Theoretical ripple factor can be calculated, which is equal to 1.3%. Based on experiments found the value of Vr,rms = 0.1074V, and VDC = 8.9839V, so the ripple factor
value of the measurement results is r = 𝑉𝑟,𝑟𝑚𝑠
𝑉𝐷𝐶 =
0,1074
8,9839= 0,012 = 1,2%. This shows that the
value of the ripple factor using PSPICE is almost the same as the theory value. The results comparison of experiments with the theory concluded that the rectifier circuit that includes half wave, full wave, bridge, and filter capacitors in this study is very feasible to use for basic electronics practice based on the PSPICE virtual laboratory.
Test Performance of Voltage Clamp Circuits and Multipliers
The results of experiments using the PSPICE clamp circuit are shown in Figure 10. In Figure 10 the clamper circuit shows the same character curve to the character theory. In negative clamper, when both experimental and theoretical shows that the stressed clamp occupies a new baseline at a level around -Vm, the positive clamper occupies a level close
to +Vm.
Development of Learning Devices Muchlas & Budiastuti
is indicated by the new baseline clamping results occupying around the -Vm -Vb value for
the negative clamper with pretension and around +Vm +Vb for the positive clamper for
pretending. Based on this analysis, it can be concluded that all the clamper series tested in this study are very good. Their character is in accordance with their theoretical character so that it can be used for basic electronic practices of PSPICE-based virtual laboratory.
The results of experiments with PSPICE to characterize the voltage doubler are shown in Figure 11.
Figure 11. The character of the voltage doubler using PSPICE and computational theory In Figure 11 (left) shown after going through a transient state, approximately t> 0.2 s, the voltage multiplier circuit provides a direct voltage output almost twice the maximum input voltage. The voltage doubled is less than 2Vm. A voltage drop of 2Vγ occurs because
the voltage is clamped by diode D1 and rectification by D2, each diode provides a reduction of Vγ. Based on the results of the analysis of the voltage multiplier circuit twice
gives excellent performance and the same character with the character of the theory. So it is feasible to use the basic electronics practice based on PSPICE.
Figure 12 presents the results of the characterization of a quadruple voltage multiplier using PSPICE.
Figure 12. The character of the quadruple voltage using PSPICE and computational theory After going through a transient time, approximately t> 0.8 s, the voltage multiplier circuit gives an output in the form of a direct voltage whose value is almost four times the maximum input voltage. In this quadruple, the output voltage has decreased by practically 4Vγ from the ideal state of 4Vm due to the input voltage being doubled clamped twice by
diodes D1 and D3 (reducing voltage -2Vγ) and rectification by diodes D2 and D4 (lowering
voltage -2Vγ again). So that the overall voltage multiplier operation is four times, the
circuit output drops by 4Vγ. Based on the analysis of the voltage multiplier circuit four
as the theoretical character, so that it can be used in the practice of basic electronics using PSPICE.
Test Performance of Transistor Characterization Circuits
The results of the characterization of 2N2222 transistors using PSPICE are shown in Figure 13. In Figure 13 shows that the characteristics of the common emitter transistor with PSPICE are the same as the theoretical characteristics. The 2N2222 transistor will provide a DC gain of β = 160 for VCE = 10V and IC = 1mA. Output characteristics of transistor
2N2222 PSPICE experiment results show that drawing lines from VCE = 10V and IC = 1mA
will cut both at the point located on the IB curve = 6μA, so that the resulting value β = 𝐼𝐶
𝐼𝐵 =
1𝑚𝐴
6 𝜇𝐴= 167. The resulting DC current gain value is the same as the datasheet value, and this
is in accordance with the theoretical parameters.
Figure 13. Characteristics of 2N2222 transistor with PSPICE
Transistor input characteristics indicate compatibility with theoretical characteristics. The curve forms an upward exponential function as a diode character curve, and this is based on the meeting of the base-emitter, which has diode-like properties. Installing a higher VCE voltage gives the appearance of a right shift curve, and this is according to the results of the theoretical computation. The input character curve shows that the cut-in voltage is magnitude around the value of the diode cut-in voltage converging like a character theory. Based on the analysis results that have been outlined, it can be stated that the design of the diode characterization series tested shows very good performance. The transistor input and output characteristic curves with PSPICE show valid results, so that the sequence can be used in basic electronics practice.
Test Performance of Common Emitter Amplifier Circuits
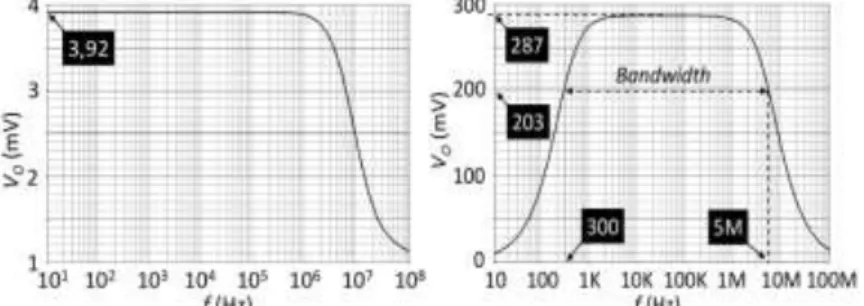
Through the PSPICE experiment, an amplitude response can be generated from the amplifier circuit being tested, as shown in Figure 14.
Figure 14. The amplitude response of common emitter amplifiers for Vi = 1mV: (a)
without bypass capacitors (left); (b) with bypass capacitors (right)
Development of Learning Devices Muchlas & Budiastuti
on equation the voltage gain value 𝐴𝑉= 𝑅𝐶
𝑟𝑡𝑟+𝑅𝐸=
8 𝑥 103
26+2 𝑥 103= 3,9. A comparison of PSPICE
voltage gain and computational voltage gain theory shows almost the same value. It can be concluded that the design of the common emitter amplifier tested provides good performance because it provides a voltage gain according to the design. Based on the amplitude response in Figure 14 right, the voltage gain jumps very high at Av = 287 after
the circuit is fitted with a bypass capacitor. In theory, if the circuit is fitted with a bypass capacitor, then at a high frequency the RE resistor is mounted in parallel to the capacitor as it is short-circuited, this corresponds to the voltage gain being, 𝐴𝑉=
𝑅𝐶
𝑟𝑡𝑟 =
8 𝑥 103
26 =
307,7. It is seen that the voltage gain value of the experimental results is almost close to the theoretical calculation value with a percentage difference of 6.7%. The slight difference due to the value of rtr is assumed to be constant, whereas in reality, its value changes with
temperature. Through this test, it is known that the effective gain is 0.707 from the maximum gain of Av = 203, which corresponds to the cut-in frequency fc = 300 Hz. This
value is the same as the theoretical calculation when the amplifier is designed. The amplitude response in Figure 14 shows the working area (bandwidth) of a very wide circuit that is 300Hz up to 5MHz according to the 2N2222 transistor datasheet. Based on the discussion that has been described, it can be stated that the amplifier circuit provides excellent performance. The characteristics obtained reflect a high degree of compatibility with the nature of the theory so that it can be used in basic electronics practice using a PSPICE-based virtual laboratory.
CONCLUSIONS
This research resulted in learning devices in the form of electronic circuits in the schematic format PSPICE totaling 31 types of supporting the implementation of virtual laboratories in the practice of basic electronics. The learning tools produced are in the form of practical modules with the topics: Capacitor Filling and Discharging, RC Circuits, Diode Characteristics, Wave Forming Circuits, Rectifier Circuits, Clamp Circuits and Voltage Multipliers, Transistor Characteristics, Transistor Strengthening Circuits. Each topic includes guidelines for PSPICE practice and operation.
All electronic circuits developed as learning devices in this study work well. The characteristics displayed have a high degree of compatibility with the characteristics of the theory, so that each series is feasible to be used as a medium of basic electronic practice to support the implementation of virtual laboratories through PSPICE software.
ACKNOWLEDGEMENT
The author would like to express gratitude to Dr. Budi Santosa. M.Pd. for valued discussion in this work. Thank you also to the students and lectures of the Electrical Engineering Department of Universitas Ahmad Dahlan, who has participated in the product socialization.
REFERENCES
Abdullahi, I., Yusoff, W. Z., & Gwamna, E. (2017). A review of physical and non-physical facilities performance on student satisfaction in Northern Nigerian Universities. Soc Sci, 12(4), 600-8.
Akinfolarin, C. A., Ajayi, I. A., & Oloruntegbe, K. O. (2012). An Appraisal of Resource Utilization in Vocational and Technical Education in Selected Colleges of Education in Southwest Nigeria. Education, 2(1), 41-45.
Alessi, S. M., & Trollip, S. R. (2001). Multimedia for learning: Methods and development. Boston: Allyn and Bacon.
Ayuba, U., & Gatabazi, P. (2010). The role of technical and vocational education and training (TVET) in human resources development: The case of Tumba College of Technology (TCT). Rwanda: Tumba College of Technology.
Bailey, C., & Freeman, M. J. (2010). A java bread-board simulator: Digital circuit simulation with an open-source toolset. IADIS International Journal on Computer Science and Information System, 55(1), 13–25.
Bandele, S., & Faremi, Y. (2012). An investigation into the challenges facing the implementation of technical college curriculum in South West, Nigeria. Journal of Education and Practice, 3(12), 8-13.
Cadence Design Systems. (2016). PSPICE User Guide (Product Re). San Jose: Cadence Design Systems, Inc.
Chepkonga, M. C. (2017). Influence of learning facilities on provision of quality education in early childhood development centres in Kenya. International Journal of Education and Research, 5(6), 15-26.
Chukwunwendu, A. F. (2015). New dimensions in sourcing and utilization of resource materials for effective teaching and instruction in technical vocational education and training (TVET) in Nigeria. Education Journal, 4(6-1), 24-30.
Colace, F., Santo, M. De, & Pietrosanto, A. (2004). Work in progress - virtual lab for electronic engineering curricula. 34th Annual Frontiers in Education (pp. 22–24). Savannah: Frontiers in Education.
Colwell, C., Scanlon, E., & Cooper, M. (2002). Using remote laboratories to extend access to science and engineering. Computers & Education, 38(1-3), 65-76.
Cruickshank, W. M. (1983). Learning disabilities: A neurophysiological
dysfunction. Journal of Learning Disabilities, 16(1), 27-29.
Dak, R., Khoje, S., & Pardeshi, P. J. (2017). A review on cost-efficient virtual laboratory: A teaching aid. In 2017 International Conference on Computing Methodologies and Communication (ICCMC) (pp. 663–667). Erode: IEEE.
Dhakal, K. R. (2017). Availability and utilization of instructional materials in teaching geography in secondary schools. The Third Pole: Journal of Geography Education, 17, 51-58.
Dobson, E. L., Hill, M., & Turner, J. D. (1995). An evaluation of the student response to electronics teaching using a CAL package. Computers & Education, 25(1-2), 13-20.
Elawady, Y. H., & Tolba, A. S. (2009). Educational objectives of different laboratory types: a comparative study. International Journal of Computer Science and Information Security (IJCSIS), 6(2), 89–96.
Farrington, J. K., Martz, E. L., Wells, S. J., Ennis, C. C., Holder, J., Levchuk, J. W., ... & Madden, J. M. (1994). Ability of laboratory methods to predict in-use efficacy of antimicrobial preservatives in an experimental cosmetic. Appl. Environ. Microbiol., 60(12), 4553-4558.
Development of Learning Devices Muchlas & Budiastuti
Hooker, M., Mwiyeria, E., Waweru, S., Ocharo, M., Bassi, R., Palmer, L., & Clarke, D. (2011). TVET ICT baseline survey. TVET Institutions in Kenya, MOHEST & GESCI, Nairobi. Indoshi, F. C., Wagah, M. O., & Agak, J. O. (2010). Factors that determine students’ and
teachers’ attitudes towards Art and Design curriculum. International Journal of Vocational and Technical Education, 2(1), 9-17.
Kashif, S. A. R., & Saqib, M. A. (2008). The use of Simulink and PSPICE as educational tools in the teaching of power electronics. Australian Journal of Electrical and Electronics Engineering, 4(1), 55–61.
Kelani, R. A. (2007). Assessment of the adequacy and utilization of woodwork equipment for acquisition in technical colleges in Lagos and Ogun States. Master’s Thesis, University of Nigeria.
Kigwilu, P. C., & Akala, W. J. (2017). Resource utilisation and curriculum implementation in community colleges in Kenya. International Journal for Research in Vocational Education and Training (IJRVET), 4(4), 369-381.
Krivickas, R. V., & Krivickas, J. (2006). Laboratory instruction in engineering education.
Global Journal of Engineering Eduation, 11(2), 191–196.
Lewis, I. (2018). The student experience of higher education (Vol. 16). Routledge.
Lustigova, Z., & Lustig, F. (2009). A new virtual and remote experimental and environment for teaching and learning science. In A. Tatnal & A. Jones (Eds.), Education and Technology for a Better World, 9th IFIP TC 3 World Conference on Computers in Education (pp. 75–82). New York: Springer.
Ma, J., & Nickerson, J. V. (2006). Hands-on, simulated, and remote laboratories: A comparative literature review. ACM Computing Surveys, 38(3), 1–24.
Magin, D. J., & Reizes, J. A. (1990). Computer simulation of laboratory experiments: An unrealized potential. Computers & Education, 14(3), 263-270.
Moochi, O. (2012). Availability, acquisition and Utilisation of instructional resources for teaching Geography in selected secondary schools in Central Kisii District (Master’s Thesis, Kenyatta University).
Muchlas. (2015). Developing a teaching model using an online collaboration approach for a digital technique practical work. The Turkish Online Journal of Educational Technology, 14(3), 63–69.
Munguti, S. (2016). Learning resources and students’ academic performance in geography in Makueni county, Kenya (Doctoral dissertation).
Mupinga, D. M., Busby, J. R., & Ngatiah, J. W. (2006). Postsecondary technical and vocational education institutions in Kenya: Needs and challenges. International Journal of Vocational Education and Training, 14(1), 21-35.
Mutindi, K. Z. (2018). Teacher Qualification And Its Influence On The Use Of Instructional Resources In Ecde Centres In Kericho County, Kenya. European Journal of Education Studies.
Okolocha, C. C., & Nwadiani, C. O. (2015). Assessment of Utilization of ICT Resources in Teaching among Tertiary Institution Business Educators in South Nigeria. Journal of Education and Learning, 4(1), 1-10.
Omae, D. O., Onderi, P. O., Mokogi, H. M., Bantu, E., Barongo, S., Miroro, R. S., & Evans, M. N. (2016). Factors Affecting the Utilisation of Time as a Selected Teaching/Learning Resource in Public Day Secondary Schools in Nyacheki Division, Kisii County, Kenya. American Journal of Education and Learning, 1(1), 16-24.
Osarenren-Osaghae, R. I., & Irabor, Q. O. (2012). Availability and adequacy of human and material resources for the teaching and learning of skill-based courses in Nigeria public universities. Journal of Sociology and Social Anthropology, 3(1), 15-27.
Owoeye, J. S., & Olatunde Yara, P. (2011). School facilities and academic achievement of secondary school agricultural science in Ekiti State, Nigeria. Asian social science, 7(7), 64-74.
Philippatos, G. C., & Moscato, D. R. (1971). Effects of constrained information on player decisions in experimental business simulation: Some empirical evidence. Journal of the ACM (JACM), 18(1), 94-104.
Prakash, G. V. (2013). Fundamental concepts of semiconductors. Retrieved from https://nptel.ac.in/courses/115/102/115102025/
Rahman, M. Z. (2014). Teaching electrical circuits using a virtual lab. In Transit: The LaGuardia Journal on Teaching and Learning, 6, 85–92.
Saleh, K. F., Mohamed, A. M., & Madkour, H. (2009). Developing virtual laboratories environments for engineering education. International Journal of Arts and Sciences, 3(1), 9–17.
Shen, H., Xu, Z., Dalager, B., Kristiansen, V., Strom, O., Shur, M. S., ... & Ytterdal, T. (1999). Conducting laboratory experiments over the Internet. IEEE transactions on education, 42(3), 180-185.
Surjono, H. D. (2017). Multimedia Pembelajaran Interaktif Konsep dan Pengembangan
(Edisi Pertama). Yogyakarta: UNY Press.
Tobin, P. (2007). The role of PSPICE in the engineering teaching environment. In
International Conference on Engineering Education – ICEE 2007. Coimbra: University of Coimbra.
Ubulom, W. J., & Ogwunte, C. P. (2017). Evaluation of teacher-centered and learner-centered methods for instructional delivery of senior secondary schools financial accounting in Rivers State. International Journal of Innovative Finance and Economics Research, 5(3), 81-88.
UNESCO, (2010). EFA Global Monitoring Report 2010: Reaching the Marginalized. Oxford University Press, Oxford.
Watt, S., Simpson, C., McKillop, C., & Nunn, V. (2002). Electronic course surveys: does automating feedback and reporting give better results?. Assessment & Evaluation in Higher Education, 27(4), 325-337.
Wondaferew, A. (2012). Factors influencing the quality of training: Technical and vocational education in Addis Ababa. Korea Review of International Studies, 15(1), 49-63.