An Artificial Neural Network Framework for
Pedestrian Walking Behavior Modeling and Simulation
Peter M. Kielar, André Borrmann
Chair of Computational Modeling and Simulation, Technische Universität München Arcisstrasse 21, Munich, Germany
[email protected]; [email protected]
Abstract– Movement behavior models of pedestrian agents form the basis of computational crowd simulations. In contemporary research, a large number of models exist. However, there is still no walking behavior model that can address the various influence factors of movement behavior holistically. Thus, we endorse the use of artificial neural networks to develop walking behavior models because machine learning methods can integrate behavioral factors efficiently, automatically, and data-driven. In this paper, we support this approach by providing a framework that describes how to include artificial neural networks into a pedestrian research context. The framework comprises 5 phases: data, replay, training, simulation, and validation. Furthermore, we describe and discuss a prototype of the framework.
Keywords: Pedestrian Simulation, Framework, Artificial Neutral Network, Walking Behavior
1. Introduction
The research on pedestrian walking properties identified various influence factors on movement behavior. Researchers apply these findings and develop operational models that describe peoples’ walking behavior [1, 2, 3, 4]. In computational crowd simulation, operational models are used as low-level behavior units. These models predict the movement of pedestrians in crowd simulation; thus are concerned with microscopic interactions of pedestrians. Microscopic aspects comprise, for example, how the velocity of pedestrians changes in different density situations. In general, the goal of microscopic behavior simulations is to identify macroscopic (emerging) movement patterns [5, 6] for crowd behavior predictions.
Most walking models define equations to calculate pedestrian movement behavior [7, 8, 9, 10]. Typically, the models’ equations are fully designed by the researchers. However, the research on walking behavior discusses various influence factors on movement behavior. The challenging task is to combine all of these behavior aspects into consistent and valid equations that can predict operational behavior accurately. However, contemporary research still did not find the optimal behavior model. The large number of existing walking models in the pedestrian dynamics literature point to this subtle issue. Thus, an individually designed model might not be an optimal solution to model operational behavior. A promising approach to overcome this issue is the application of machine learning methods that derive models based on data. This means that the modeling of the agents’ walking behavior is delegated to a machine learning method and is not directly carried out by a researcher. To evaluate this concept, we developed a framework that embeds the artificial neural network (ANN) methodology in the pedestrian research domain. We also provide an example implementation of the framework and an ANN.
2. Related work
This research provides an approach for the application of ANNs in operational behavior modeling. However, literature shows that the application of ANN in operational behavior modeling is not new.
by a virtual experiment. The input of the ANN is the relative position of the agent as well as the terrain altitude and the cell-coverage in proximity to the pedestrian.
In the research of [11], a multi-layer perceptron ANN is used to model the operational behavior of pedestrians in continuous space for a bidirectional flow at a crosswalk. The input data comprises the features of the agent’s movement and perception. The output of the ANN estimates the horizontal and vertical velocity of a pedestrian agent for the next simulation time step. The training data was acquired via camera and augmented by an artificial agent sensing data. The sensing data comprises the relative distance and velocity of the 5 nearest pedestrians in front of a pedestrian agent.
These papers showed that it is possible to apply ANNs in a pedestrian dynamics environment to simulate operational behavior.
Here, we define a framework that embeds an ANN for walking behavior modeling and simulation. This framework is a useful guideline for pedestrian dynamics researchers that like to include ANNs in their methods. Thus, we are concerned with providing an ecosystem for implementing ANN approaches.
3. Integrating artificial neural networks in pedestrian research
In this section, we provide the details on the developed framework and discuss a prototype implementation of the method. In this context, we also show a case study using data from a laboratory experiment.
3.1. Framework overview
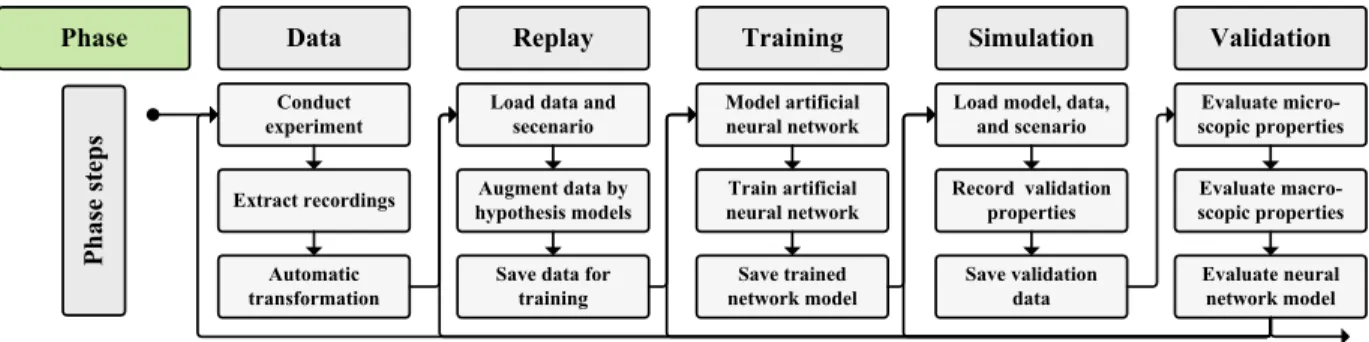
The framework comprises multiple phases. Figure 1 gives an overview of the phases and the process. The first phase is the data phase. In the data phase laboratory or standardized field experiments are conducted to provide pedestrian movement data. The processed data is given to the replay phase. Here, a pedestrian simulation uses the experiment trajectory data and augments it to provide additional information of pedestrians. The augmented data samples are given to an ANN for training. The trained ANN is integrated as operational model into the pedestrian simulator in the simulation phase. The simulator uses the model to realize operational behavior in test cases. In the validation phase, well-known methods for model validation are applied to evaluate the capabilities of the developed ANN model.
Conduct experiment Data Extract recordings Automatic transformation Replay
Augment data by hypothesis models Load data and
secenario
Save data for training Training Train artificial neural network Model artificial neural network Save trained network model Simulation
Record validation properties Load model, data,
and scenario Save validation data Validation Evaluate macro- scopic properties Evaluate micro-scopic properties Evaluate neural network model Phase Phase steps
Fig. 1: The workflow of the framework. Five phases provide the basis of the concept. Each phase has three steps and is applied in a different technological and mathematical context. It is possible to restart the process at any given
previous phase in case a phase indicates issues.
3.2. Data phase
the ANN training results negatively. In addition to the participants’ movement data, the geometrical layout of the experiment is needed. The layout mostly includes the boundaries and obstacles.
Our tests with the data phase and the training of the ANN showed that we can improve the training phase later on if additional information beyond the participants’ trajectories are given. We identified that the shoulder positions, the velocity, and the head-direction can improve the ANN training. Regarding the layout of the experiment, it is highly beneficial to identify the height of obstacles. If the height is not given, the agent might appear to overlap with the walls, which is not true for small obstacles.
3.3. Replay phase: basis
In this phase, the movement of the participants of the laboratory experiments is replayed in a pedestrian simulation. This is done to compute additional information based on the egocentric perspective of the participants. These information are basically data that a person can acquire from his or her visual perception but cannot be captured by a top-down camera. This data augmentation enables to enrich the input data set for training an ANN. For the replay phase, we use the pedestrian simulation framework MomenTUM.
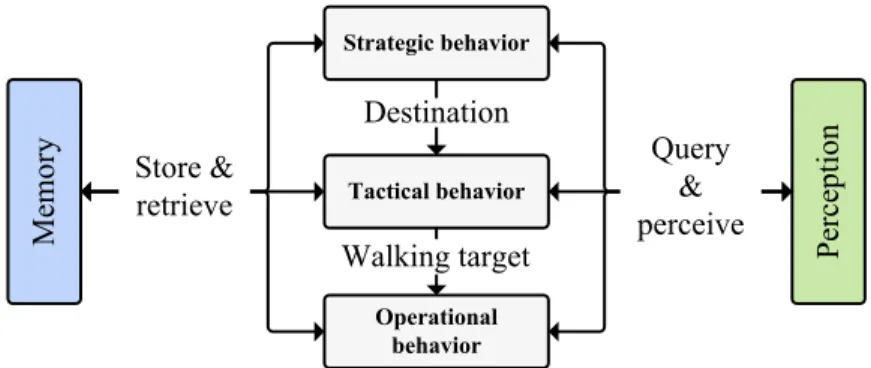
Walking behavior is only a single aspect of the rich characteristic of pedestrian dynamics. For example, we can identify queuing and navigation behavior as additional mechanisms of pedestrian behavior [3, 19]. Operational behavior, which is in focus here, is heavily related to tactical behavior, memory, and perception (see Fig. 2). Therefore, a realistic simulation of operational behavior uses additional information beyond the movement properties that can be extracted by data of a typical movement experiment.
The augmentation of the data is done by classical models. These classical (bottom-up) design models implement assumptions of aspects of pedestrian behavior without machine learning methods. Here, we name these models hypothesis models. In the following section, we give details of the hypothesis models and data augmentations of our prototype implementation of the framework.
Operational behavior Tactical behavior Strategic behavior
Perception
Memory Walking target
Query & perceive Store &
retrieve
Destination
Fig. 2: A simplified visualization of the basic building blocks of pedestrian behavior. Operational behavior is directly dependent on the perception, memory, and tactical aspects of this pedestrian behavior architecture [1, 2, 3,
4, 14]. Memory, perception, and tactical information cannot be acquired easily in the data phase.
3.4. Replay phase: hypothesis models
The trajectory data of the experiments is used to guide the movement of the agent through the replay. If not given, we need and compute the current velocity of an agent for each time step. The velocity can be computed using the positions over time. We can extract the head direction of the participations if the laboratory experiments include markers for this. However, if no head-direction is given, the velocity vectors are a good substitution.
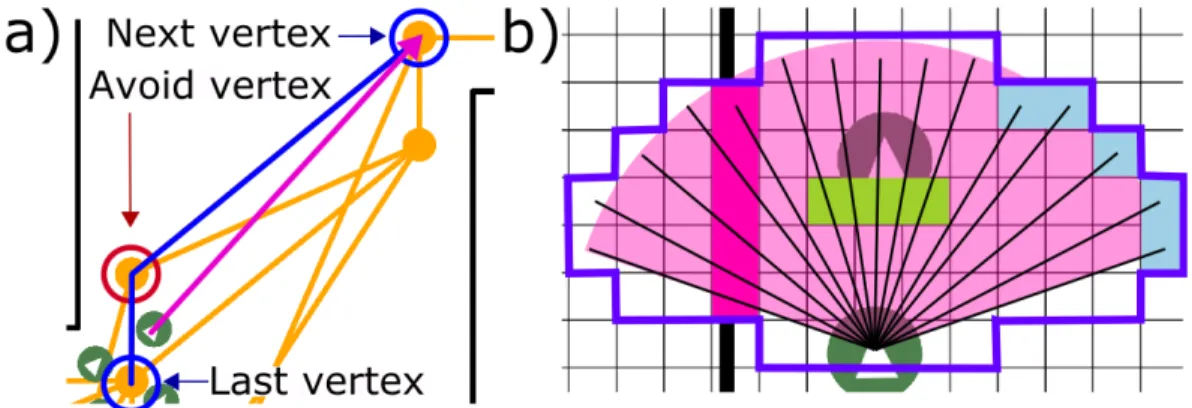
assumption of how the participants determine a walking target. We apply a graph-based model that includes a graph-generation schema and a routing method [18]. This provides sufficient detail for our purpose. It is important to note that the model should not provide a fixed position as input for an ANN but an egocentric perspective towards the walking target. This is realized by computing the relative angle and distance to the walking target position that is given by the navigation model. A schematic overview of the navigation hypothesis model is given in Fig.3 a).
The perception model should provide perceptual information for each computed time step in the replay phase. Models that apply a sweep-line method are sufficient for this purpose. However, the accuracy of the underlying grid and the stepwise angle change for the sweep have direct influence on the training success later on. Regardless of the realization of the perception model, it must provide egocentric information of the agent view. This would be the distance and the relative direction angle of a perceived object or free area. An overview of the applied perception model is given in Fig. 3 b).
Fig. 3: Examples of how the navigation a) and perception b) hypothesis models. a) the navigation hypothesis model operates on a routing graph (orange). The agent’s walking target is the next visible vertex alongside the graph towards the agent’s destination (top blue circle). The agent avoids simple vertex hopping (red circle) alongside the graph. This method guides operational behavior to be goal directed. b) the perception hypothesis model is based on a
perception arc (light pink) that originates in an agent. However, we avoid numerical inaccuracies and generate a fixed number of perceptual points. Thus, we identify all border cells of a circle. The border cells are the destinations
of perception rays that start from the agent’s position. If a ray hits a target or its destination it extracts data, e.g. the distance to the collision cell. The parameters of the perception model in our prototype framework is an arc of 120°, a
perception distance of 5.0 m, and a cell size of 0.1 m.
3.5. Replay phase: output data
The simulation framework MomenTUM exports the data of the replay phase for each agent and for each time step. All exported data items form part of the training data. We marked the relative heading-change and the velocity magnitude of the training data as training ground truth variables. Thus, the ANN will use the training data as exercise information to predict the ground truth variables. The training data comprises the last velocity, the last heading-change, the current distance to the walking target, and the relative direction to the walking target of an agent. Furthermore, the perception information of the object closest to the agent will be used. Here, the information is the distance and the relative angle to the closest object.
Each data set is generated for each agent and each time step. The time step discretization is 0.04 seconds, a value that is based on the time resolution of the video data. The time step is an important value because it shapes the classification set due to the velocity and heading change measuring points. We tested different time steps in values from 0.08 to 0.52, but could find benefits in higher values; thus, we used 0.04 seconds.
pedestrian agent in the replay is close to the boundary of the camera range, this agent may miss to perceive other agents that are outside of cameras view. These kind of situation must be avoided for data quality. A solution is to ignore trajectory data points of the experiment that are closer to the camera boundaries as the perception distance of an agent.
3.6. Training phase
For the purpose of applying the ANN in pedestrian dynamics, the input and the output data of the ANN are highly important aspects. We believe that these interfaces incorporate most pedestrian domain-knowledge and are crucial for an ANN to be able to learn pedestrian operational behavior. Thus, the given prototype ANN is a case study of how to approach the application of ANNs in a pedestrian dynamics context and therefore will cover only minor aspects of pedestrian movement behavior.
For our prototype ANN definition, we followed the approach of [11] and modeled a multi-layer perceptron ANN. We used TensorFlow and its Python API [15]. The ANN’s goal is to compute a joint classification of each agents’ egocentric velocity magnitude and movement direction change. Thus, we did not compute a regression. A regression showed to be highly inaccurate due to noise in the training data. We decided on the hyper-parameter, data processing, and the ANN architecture as follows:
• We normalized the input data of the replay phase in the range [0.0, 1.0].
• The number of training data points for each agent and each time step of the replay data is 6, which define the number of input neurons.
• Based on the data by UG 140 [13], we extracted 38599 training samples that provide a time sampling discretization of the pedestrian walking behavior of 0.04 seconds. Furthermore, we extended the data to 77198 samples by flipping all data regarding the walking axis of each individual agent.
• The number of output neurons is defined by the joint classification of velocity and movement direction change pairs. For our prototype, we define 2 velocity classes and 41 movement direction change classes. However, we ignore all classes that cover less than 0.5% of the data to avoid noise. Thus, we actually have 6 classes, which cover 97.92% of the data and define the number of output neurons.
• Furthermore, we oversampled classes [25] due to imbalanced data.
• The activation function in the last layer is a Softmax function [21]. This function computes the most likely class based on the last hidden layer output and set the value of the output neuron that represents this class to 1.0, otherwise 0.0. The loss value for optimizing the network is computed by a cross entropy that is applied on the Softmax output.
• The number of hidden layers is 2 and the number of neurons for each hidden layer is set to 60.
• The activation function in the hidden layers is a leaky ReLu [20] with alpha and the initial weights between neurons that are connected with these functions are in range of a normal distributed in ]0.0, 0.1].
• A bias neuron that is initialized with 0.0 is given for each matrix multiplication between layers.
• We applied 150 epochs, a mini batch size of 1000, and 5% dropout on all connections of the ANN that applied a leaky ReLu activation function. We randomized input data but homogenized the class occurrences in the training and evaluation data. The training and evaluation split is set 90% to 10%.
• We used the ADADELTA Optimizer [23] for the training.
3.7. Simulation phase
The simulation phase comprises the automatic integration of the trained ANN model into a pedestrian simulator and to run test simulations. We used the built-in method of TensorFlow to store the trained ANN model and the TensorFlow Java API to import the model into MomenTUM.
In the simulation phase, a set of standardized test scenarios should be used to calculate validation data for the ANN model. However, for the initial purpose to check whether the ANN model is able to provide basic operational pedestrian behavior, we applied the scenarios of the training data. Here, the trajectory data provides the start positions of the agents in the test simulations. From the starting position of each agent, the ANN will guide the agents’ operational behavior. The hypothesis models are used to generate the perceptual and navigation data for each pedestrian for each time step. This data and the movement information of an agent are given to an embedded ANN as input information. The agent’s ANN predicts the operational behavior for the next time step by a classification. The simulator translates the predicted class into new velocity magnitude and body rotation for each agent for each time step.
3.8. Validation phase
The validation phase comprises a microscopic and macroscopic validation and applies the data of the trajectory and layout data of scenarios used in the simulation phase.
Fig. 5: a) a visualization of the experimental data of UG 140 [13]. b) a single ANN controlled pedestrian walking alongside the corridor. c) two ANN controlled pedestrians walking alongside the corridor and a single pedestrian standing still. Here, the ANN provides corrected behavior for first pedestrian but incorrect for the second. This situations can be seen quite often with the given ANN. d) is similar to c). Here, the situation is reversed, the first
pedestrian is capable to avoid the standing person and reach the goal but the other agent behaves incorrect. This indicates that the behavior is not stable but a good starting point for further improvements.
The macroscopic validation is scenario dependent and compares emerging patterns of the simulation and the real pedestrian movement of an experiment. Here, one method is to compare the fundamental diagram that can be extracted by real and simulated trajectory data. Another example is to evaluate whether lane formation occur in the simulation and the experiments.
If the validation of the ANN model does not provide qualitative and quantitative operational pedestrian behavior, one has to repeat the framework process at one of the previous phase. Here, the identification of the root cause of model issues is highly dependent on the experiences regarding the combination of machine learning and pedestrian dynamics. For example, the ANN structure, the experimental data, or the hypothesis models could be insufficient.
In our prototype application of the proposed framework, we evaluated the microscopic properties of the ANN model of Sec. 3.6. Figure 4 shows snapshots of a replay and diverse results for the scenario UG 140 [13]. Some of the predicted trajectories provide realistic behavior but some violate the physical properties of pedestrian walking. We identified that we miss to train the ANN with a large data basis of balanced and standardized trajectory data. This would have improved the results. Nonetheless, we could show that the ANN framework for pedestrian operational behavior modeling and simulation is a promising method.
4. Conclusion, discussion and further research
In this paper, we provided a framework that integrates artificial neural networks (ANNs) into a pedestrian simulation context. The framework gives guidelines of how to embed an ANN based pedestrian walking model into a pedestrian simulation workflow. The framework defines 5 phases: data, replay, training, simulation, and validation. Furthermore, we discussed a prototype implementation of our framework and a model that uses the framework to simulate operational behavior of agents by a data-driven ANN.
The described approach has two important advantages. The first is that researcher can avoid individually designed mathematical models of pedestrian walking. The diverse influence factors on pedestrian walking behavior are complex and a bottom-up defined behavior model might not cover all walking behavior aspects that are hidden in experimental data. Using the developed framework, researchers can delegate the walking behavior modeling to an ANN. The second advantage it that one can define hypothesis models that support the ANN walking model. Hypothesis models augment experimental data as input for the ANN. Thus, hypothesis models provide a method for behavior and cognition hypothesis testing. For example, the perception model that augments the data in the replay phase plays a mandatory role for the ANN to be able to learn and generalize the movement behavior. We could use a perception model that includes attention aspects. This model may improve or worsen the learning capabilities of the ANN because the model may or may not capture important features of pedestrian perception. This will give evidence whether assumptions of the hypothesis model is well-chosen or insufficient for pedestrian dynamics.
pedestrian dynamics applications. Another promising improvement is to use eye-tracking methods on the participations in the experiments [17]. This technology will provide additional data and will improve the perceptual and navigational hypotheses. If high quality and automatically evaluable eye-tracking data is given, research could replace the hypothesis models with a machine learning approach.
References
[1] S. P. Hoogendoorn, and P. H. L. Bovy, „Pedestrian route-choice and activity scheduling theory and models”, Transportation Research Part B: Methodological, vol. 38, no. 2, pp. 169-190, 2004.
[2] M. Bierlaire, and T. Robin, „Pedestrians Choices” in Pedestrian Behavior: Models, Data Collection and Applications, H. Timmermans, Ed. Emerald Group Publishing, 2009, pp. 1-26.
[3] P. M. Kielar, „Kognitive Modellierung und computergestützte Simulation der räumlich-sequenziellen Zielauswahl von Fußgängern“, Ph.D. Dissertation, Technische Universität München, 2017.
[4] P. M. Kielar and A. Borrmann, „Spice: A Cognitive Agent Framework for Computational Crowd Simulations in Complex Environments“, Autonomous Agents and Multi-Agent Systems, DOI: 10.1007/s10458-018-9383-2, 2018.
[5] D. Helbing, L. Buzna, A. Johansson, and T. Werner, „Self-organized pedestrian crowd dynamics: Experiments, simulations, and design solutions“, Transportation Science, vol. 39, no. 1, pp. 1-24, 2005. [6] A. Portz, and A. Seyfried, „Analyzing Stop-and-Go Waves by Experiment and Modeling“, in
International Conference on Pedestrian and Evacuation Dynamics, 2010, pp. 577-586.
[7] D. Helbing, and P. Molnár. „Social force model for pedestrian dynamics“, Physical Review E, vol. 51, no. 5, pp. 4282-4286, 1995.
[8] M. Moussaıïd, D. Helbing, and G. Theraulaz, „How simple rules determine pedestrian behavior and crowd disasters“, Proceedings of the National Academy of Sciences, vol. 108, no. 17, pp. 6884-6888, 2011.
[9] J. Pettré, D. Wolinski, and A.-H. Olivier, „Velocity-Based Models for Crowd Simulation“, in
International Conference on Pedestrian and Evacuation Dynamics, 2014, pp. 1065-1078.
[10] V. J. Blue., and J. L. Adler, „Cellular automata microsimulation for modeling bi-directional pedestrian walkways“, Transportation Research Part B: Methodological, vol. 35, no. 3, pp. 293-312, 2001.
[11] Y. Ma, E. W. M. Lee, and R. K. K. Yuen, „An Artificial Intelligence-Based Approach for Simulating Pedestrian Movement”, IEEE Transactions on Intelligent Transportation Systems, vol. 17, no. 11, pp. 3159-3170, 2016.
[12] P. Shao, „A more realistic simulation of pedestrian based on cellular automata,” in IEEE International Workshop on Open-source Software for Scientific Computation, 2009, pp. 24-2.
[13] C. Keip and K. Ries, „Dokumentation von Versuchen zur Personenstromdynamik“, Technical Report, Project Hermes, 2009.
[14] P. M. Kielar, D. H. Biedermann, and A. Borrmann, „MomenTUMv2: a modular, extensible, and generic agent-based pedestrian behavior simulation framework“, Technical Report, Technische Unversität München, 2016.
[15] M. Abadi et al., „TensorFlow: Large-Scale Machine Learning on Heterogeneous Systems“, Whitepaper, https://www.tensorflow.org/, 2015.
[16] W. Shao and D. Terzopoulos. „Autonomous pedestrians“, Graphical Models, vol. 69, no. 5-6, pp. 246-274, 2007.
[17] S. Schwarzkopf, et al., „What Lab Eye Tracking Tells us about Wayfinding: A Comparison of Stationary and Mobile Eye Tracking in a Large Building Scenario“, in International Workshop Eye Tracking for Spatial Research in conjunction with COSIT, pp. 31-36, 2013
[19] P. M. Kielar and A. Borrmann, „Coupling Spatial Task Solving Models to Simulate Complex Pedestrian Behavior Patterns“, in International Conference on Pedestrian and Evacuation Dynamics, 2016, pp. 229-235.
[20] A. L. Maas, A. Y. Hannun, and Y. Ng. Andrew, “Rectifier nonlinearities improve neural network acoustic models”, in Proc. ICML, vol. 30, no. 1, pp. 3-11, 2013
[21] C. M. Bishop, Machine learning and pattern recognition, Springer, 2006. [22] M. A. Nielson, ANNs and Deep Learning, Determination Press, 2015.
[23] M. D. Zeiler, „ADADELTA: An Adaptive Learning Rate Method”, arXiv:1212.5701, 2012.
[24] S. Holl, „Methoden für die Bemessung der Leistungsfähigkeit multidirektional genutzter Fußverkehrsanlagen“, Ph.D. dissertation, Bergische Universität Wuppertal, 2016