advances.sciencemag.org/cgi/content/full/sciadv.abc1463/DC1
Supplementary Materials for
Mandated Bacillus Calmette-Guérin (BCG) vaccination predicts flattened curves
for the spread of COVID-19
Martha K. Berg
*, Qinggang Yu, Cristina E. Salvador, Irene Melani, Shinobu Kitayama
**Corresponding author. Emails: [email protected] and [email protected]
Published 31 July 2020, Sci. Adv.6, eabc1463 (2020) DOI: 10.1126/sciadv.abc1463
This PDF file includes:
Supplementary text
Tables S1 to S8
Fig. S1
Mandated Bacillus Calmette-Guérin (BCG) vaccination predicts flattened curves for the spread of COVID-19
Supplementary Materials
Supplementary analysis 1. Weighting country data based on underreporting index We estimated a linear mixed model that was identical to that used in our main analysis, except that reporting index was included as a weighting factor in the model predicting the
number of cases. Results were consistent with our main analysis, demonstrating that our effects are robust against differences in reporting quality across countries (see Table S3).
77 countries were included in this analysis. We found a significant main effect of day, b = 0.112, p < .001, reflecting an exponential increase in cases over time. This increase was
qualified by a significant interaction between day and the contrast between current and non-current BCG policy. Specifically, the growth rate of COVID-19 cases was significantly slower in countries with mandated BCG vaccinations, compared to countries without mandated BCG vaccinations, b = -0.030, p = .006. Countries that once had such policies but terminated them before 2000 were not significantly different in growth rate from those that never instituted
mandatory BCG vaccinations, b = -0.006, p = .716. In sum, our focal effect was no different with reporting index added as a weighting factor. See Table S3 for full regression table.
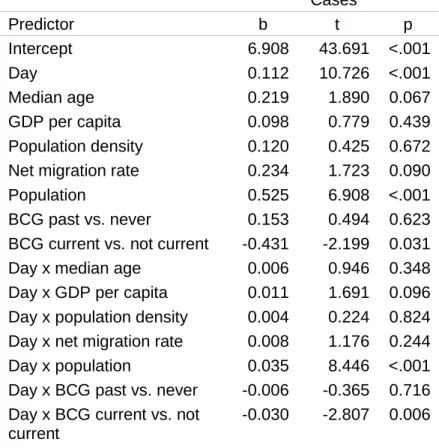
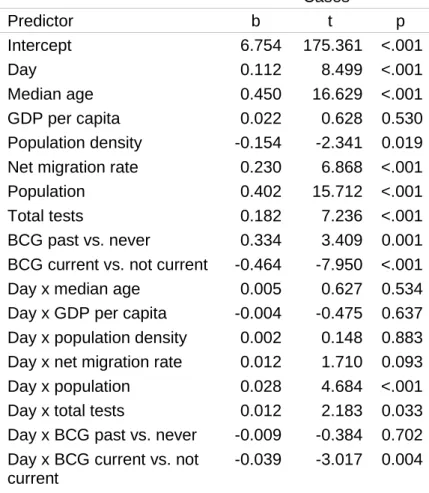
Supplementary analysis 2. Controlling for the total number of tests
We estimated linear mixed models that were identical to those used in our main analysis, except that the total number of tests for each country was included as a covariate in the model predicting the number of cases. Results were consistent with our main analysis, demonstrating that our effects are robust against differences in testing availability across countries (see Table S4).
64 countries were included in this analysis. We found a significant main effect of day, b = 0.112, p < .001, reflecting an exponential increase in cases over time. This increase was
qualified by a significant interaction between day and the contrast between current and non-current BCG policy. Specifically, the growth rate of COVID-19 cases was significantly slower in countries with mandated BCG vaccinations, compared to countries without mandated BCG vaccinations, b = -0.039, p = .004. Countries that once had such policies but terminated them before 2000 were not significantly different in growth rate from those that never instituted
mandatory BCG vaccinations, b = -0.009, p = .702. In sum, our focal effect was no different with total tests added as a covariate. See Table S4 for full regression table.
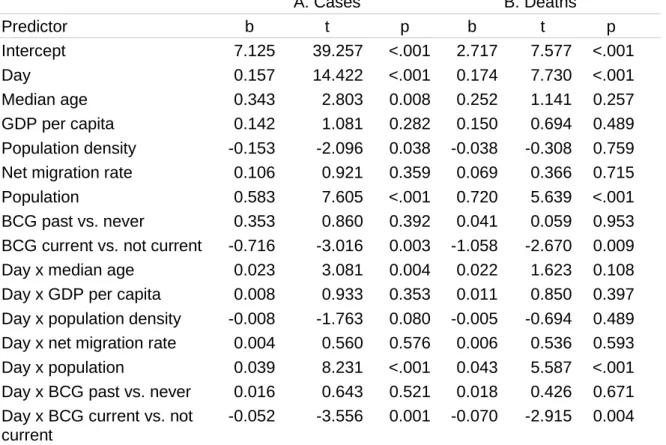
Supplementary analysis 3. Robustness check with 15-day time window
To test the robustness of our models, we conducted a set of analyses only using the first 15 days of data (rather than the first 30). The 15-day cutoff allowed us to examine more
exclusively than the 30-day cutoff the very first phase of the outbreak in each country. Because our primary analysis included only countries that reported at least 15 days of eligible data, the same set of countries was included here (see Table S1 for full list for each analysis). All patterns were identical to the primary analyses.
A. Confirmed cases
We found a significant main effect of day, b = 0.157, p < .001, reflecting an exponential increase in cases over time. This increase was qualified by a significant interaction between day and BCG policy. Specifically, the growth rate of COVID-19 cases was significantly slower in countries with mandated BCG vaccinations, compared to countries without mandated BCG vaccinations, b = -0.052, p = .001. Countries that once had such policies but terminated them before 2000 were not significantly different in growth rate from those that never instituted mandatory BCG vaccinations, b = 0.016, p = .521. In sum, our focal effect was no different with
a shorter time window. See Table S5-A for full regression table and Figure S1-A and B for growth curves.
B. Deaths
Similarly, we found a significant main effect of day, b = 0.174, p < .001, reflecting an exponential increase in deaths over time. This increase was qualified by a significant interaction between day and BCG policy. Specifically, the growth rate of COVID-19 deaths was significantly slower in countries with mandated BCG vaccinations, compared to countries without mandated BCG vaccinations, b = -0.070, p = .004. Countries that once had such policies but terminated them before 2000 were not significantly different in growth rate from those that never instituted mandatory BCG vaccinations, b = 0.018, p = .671. In sum, our focal effect was no different with a shorter time window. See Table S5-B for full regression table and Figure S1-C and D for growth curves.
Supplementary analysis 4. Testing cultural dimensions
We first dummy-coded BCG status (BCG currently mandated vs. BCG not currently mandated). We then tested each variable that varied significantly as a function of BCG policy status as an additional covariate in our primary models, to test our key finding (the interaction between day and the primary BCG contrast) would be observed after controlling for the cultural dimension. Since the cultural indices were not available for all the countries included in the main analyses, and moreover, different indices were available for different sets of countries, each cultural dimension was analyzed separately so as to preserve the maximal number of countries.
A series of t-tests revealed that countries that currently mandate BCG (compared to all others) were significantly lower in individualism, whereas they were higher in power distance (Table S6).
A. Confirmed cases
To test whether the cultural dimensions shown to vary between the countries that differed in the BCG policy status might explain the effect of BCG policy status, we repeated the analyses reported in the main text with each of the cultural dimensions included as a covariate (see Tables S7-A and S8-A). 65 countries were included in each analysis. The key interaction between day and BCG policy status (contrasting countries that currently mandate BCG with those that do not) remained statistically significant when either individualism or power distance was added as a covariate.
B. Deaths
We conducted the same two analyses to test whether individualism and power distance qualified the effect of BCG on the increase in deaths over time (see Tables S7-B and S8-B). 64 countries were included in each analysis. The key interaction between day and BCG policy status (contrasting countries that currently mandate BCG with those that do not) remained statistically significant when either individualism or power distance was added as a covariate. Supplementary analysis 5. Predicting US cases and deaths if BCG were mandated
We estimated the numbers of confirmed cases and deaths estimated for the U.S. if it had instituted a mandatory BCG vaccination policy decades ago. To do this, we used the "predict" function in R. In particular, we plugged the value of each predictor for the U.S. into the regression equation. The value for day was set at 14.5, corresponding to the centered value of day 30, the final U.S. data point (on April 1 and March 29, 2020, for the analysis of confirmed cases and deaths, respectively). The BCG vaccination policy status was set to be equal to the countries that currently have mandatory BCG vaccination policies. The values for all other predictors were taken from available current U.S. values. The output gives the predicted number of cases (using the confirmed cases model) and deaths (using the deaths model) after natural log transformation. We thus calculated the numbers on their original scale by exponentiating our
predicted value. This analysis applied to the number of cases yielded a predicted value of 11.621, which translates to 111403.711 cases (compared to the actual 213372 cases reported in the US by April 1). This analysis applied to the number of deaths yielded a predicted value of 6.149, which translates to 468.038 deaths (compared to the actual 2467 deaths reported in the US by March 29).
Table S1. List of all countries included in analysis of cases and deaths, with the date set as day 1 in each country. Countries with dates entered in columns 2 and 3 are those included in our analysis of cases and deaths, respectively.
Country
Date of first 100 cases
Date of first
death BCG policy status
Afghanistan 3.27.20 3.22.20 Currently mandated
Albania 3.23.20 3.11.20 Currently mandated
Algeria 3.21.20 3.12.20 Currently mandated
Angola 3.29.20 Currently mandated
Argentina 3.20.20 3.8.20 Currently mandated
Armenia 3.19.20 3.26.20 Currently mandated
Australia 3.10.20 3.1.20 Mandated in the past
Austria 3.8.20 3.12.20 Mandated in the past
Azerbaijan 3.26.20 3.13.20 Currently mandated
Bangladesh 4.6.20 3.18.20 Currently mandated
Belarus 3.30.20 3.31.20 Currently mandated
Belgium 3.6.20 3.11.20 Never mandated
Belize 4.6.20 Currently mandated
Benin 5.7.20 4.6.20 Currently mandated
Bolivia 3.31.20 3.29.20 Currently mandated
Bosnia and Herzegovina 3.22.20 3.21.20 Currently mandated
Botswana 3.31.20 Currently mandated
Brazil 3.13.20 3.17.20 Currently mandated
Bulgaria 3.20.20 3.11.20 Currently mandated
Burkina Faso 3.24.20 3.18.20 Currently mandated
Burundi 4.13.20 Currently mandated
Cambodia 3.29.20 Currently mandated
Cameroon 3.29.20 3.25.20 Currently mandated
Canada 3.11.20 3.9.20 Never mandated
Central African Republic 5.8.20 5.23.20 Currently mandated
Chad 5.2.20 4.28.20 Currently mandated
Chile 3.16.20 3.22.20 Currently mandated
China 1.22.20 1.23.20 Currently mandated
Colombia 3.19.20 3.22.20 Currently mandated
Costa Rica 3.21.20 3.19.20 Currently mandated
Cote d’Ivoire 3.27.20 3.29.20 Currently mandated
Croatia 3.19.20 3.19.20 Currently mandated
Cuba 3.28.20 3.18.20 Currently mandated
Denmark 3.10.20 3.14.20 Mandated in the past Dominican Republic 3.21.20 3.17.20 Currently mandated
Ecuador 3.18.20 3.14.20 Mandated in the past
Egypt 3.14.20 3.8.20 Currently mandated
El Salvador 4.9.20 3.31.20 Currently mandated
Equatorial Guinea 4.24.20 4.22.20 Currently mandated
Estonia 3.14.20 3.25.20 Currently mandated
Ethiopia 4.18.20 4.5.20 Currently mandated
Finland 3.13.20 3.21.20 Currently mandated
France 2.29.20 2.15.20 Currently mandated
Gabon 4.17.20 3.20.20 Currently mandated
Gambia 3.23.20 Currently mandated
Georgia 3.30.20 4.4.20 Currently mandated
Germany 3.1.20 3.9.20 Mandated in the past
Ghana 3.26.20 3.21.20 Currently mandated
Greece 3.13.20 3.11.20 Currently mandated
Guatemala 4.10.20 3.16.20 Currently mandated
Guinea 4.4.20 4.15.20 Currently mandated
Guinea-Bissau 4.29.20 4.26.20 Currently mandated
Guyana 5.10.20 3.12.20 Currently mandated
Haiti 5.4.20 4.5.20 Currently mandated
Honduras 3.29.20 3.26.20 Currently mandated
Hungary 3.21.20 3.15.20 Currently mandated
India 3.14.20 3.11.20 Currently mandated
Indonesia 3.15.20 3.11.20 Currently mandated
Iran 2.26.20 2.19.20 Currently mandated
Iraq 3.13.20 3.4.20 Currently mandated
Ireland 3.14.20 3.11.20 Currently mandated
Israel 3.12.20 3.21.20 Mandated in the past
Italy 2.23.20 2.21.20 Never mandated
Jamaica 4.15.20 3.19.20 Currently mandated
Japan 2.21.20 2.13.20 Currently mandated
Jordan 3.22.20 3.27.20 Currently mandated
Kazakhstan 3.26.20 3.20.20 Currently mandated
Kenya 4.2.20 3.26.20 Currently mandated
Kuwait 3.14.20 4.4.20 Currently mandated
Kyrgyzstan 3.31.20 4.3.20 Currently mandated
Latvia 3.20.20 4.3.20 Currently mandated
Liberia 4.21.20 4.4.20 Currently mandated
Libya 4.2.20 Currently mandated
Lithuania 3.22.20 3.21.20 Currently mandated
Luxembourg 3.17.20 3.14.20 Mandated in the past
Madagascar 4.11.20 5.17.20 Currently mandated
Malawi 5.25.20 4.7.20 Currently mandated
Malaysia 3.9.20 3.17.20 Currently mandated
Mali 4.12.20 3.29.20 Currently mandated
Malta 3.23.20 4.8.20 Currently mandated
Mauritania 5.19.20 3.30.20 Currently mandated
Mexico 3.18.20 3.19.20 Currently mandated
Moldova 3.23.20 3.18.20 Currently mandated
Mongolia 5.16.20 Currently mandated
Morocco 3.22.20 3.10.20 Currently mandated
Mozambique 5.11.20 5.25.20 Currently mandated
Nepal 5.7.20 5.16.20 Currently mandated
Netherlands 3.6.20 3.6.20 Never mandated
New Zealand 3.22.20 3.29.20 Mandated in the past
Nicaragua 5.19.20 3.27.20 Currently mandated
Niger 4.3.20 3.25.20 Currently mandated
Nigeria 3.29.20 3.23.20 Currently mandated
North Macedonia 3.22.20 3.22.20 Currently mandated
Norway 3.6.20 3.14.20 Currently mandated
Oman 3.26.20 3.31.20 Currently mandated
Pakistan 3.16.20 3.19.20 Currently mandated
Panama 3.19.20 3.11.20 Currently mandated
Paraguay 4.5.20 3.21.20 Currently mandated
Peru 3.17.20 3.20.20 Currently mandated
Philippines 3.14.20 2.2.20 Currently mandated
Poland 3.14.20 3.12.20 Currently mandated
Portugal 3.13.20 3.17.20 Currently mandated
Qatar 3.11.20 3.28.20 Currently mandated
Romania 3.14.20 3.22.20 Currently mandated
Russia 3.17.20 3.19.20 Currently mandated
Rwanda 4.4.20 Currently mandated
Saudi Arabia 3.14.20 3.24.20 Currently mandated
Senegal 3.26.20 4.1.20 Currently mandated
Sierra Leone 4.28.20 4.23.20 Currently mandated
Slovakia 3.18.20 3.18.20 Currently mandated
Slovenia 3.13.20 3.14.20 Currently mandated
South Africa 3.18.20 3.27.20 Currently mandated
South Korea 2.20.20 2.20.20 Currently mandated
Spain 3.2.20 3.3.20 Mandated in the past
Sri Lanka 3.24.20 3.28.20 Currently mandated
Sudan 4.20.20 3.13.20 Currently mandated
Sweden 3.6.20 3.11.20 Mandated in the past
Switzerland 3.5.20 3.5.20 Mandated in the past
Taiwan 3.18.20 2.16.20 Currently mandated
Tajikistan 5.3.20 5.2.20 Currently mandated
Tanzania 4.17.20 3.31.20 Currently mandated
Thailand 3.15.20 3.1.20 Currently mandated
Togo 4.29.20 3.27.20 Currently mandated
Tunisia 3.24.20 3.19.20 Currently mandated
Turkey 3.19.20 3.17.20 Currently mandated
Uganda 5.6.20 Currently mandated
Ukraine 3.25.20 3.13.20 Currently mandated
United Arab Emirates 3.18.20 3.20.20 Currently mandated
United Kingdom 3.5.20 3.6.20 Currently mandated
United States 3.3.20 2.29.20 Never mandated
Uruguay 3.20.20 3.28.20 Currently mandated
Uzbekistan 3.28.20 3.27.20 Currently mandated
Vietnam 3.22.20 Currently mandated
West Bank and Gaza 3.29.20 3.26.20 Currently mandated
Yemen 5.15.20 4.30.20 Currently mandated
Zambia 4.30.20 4.2.20 Currently mandated
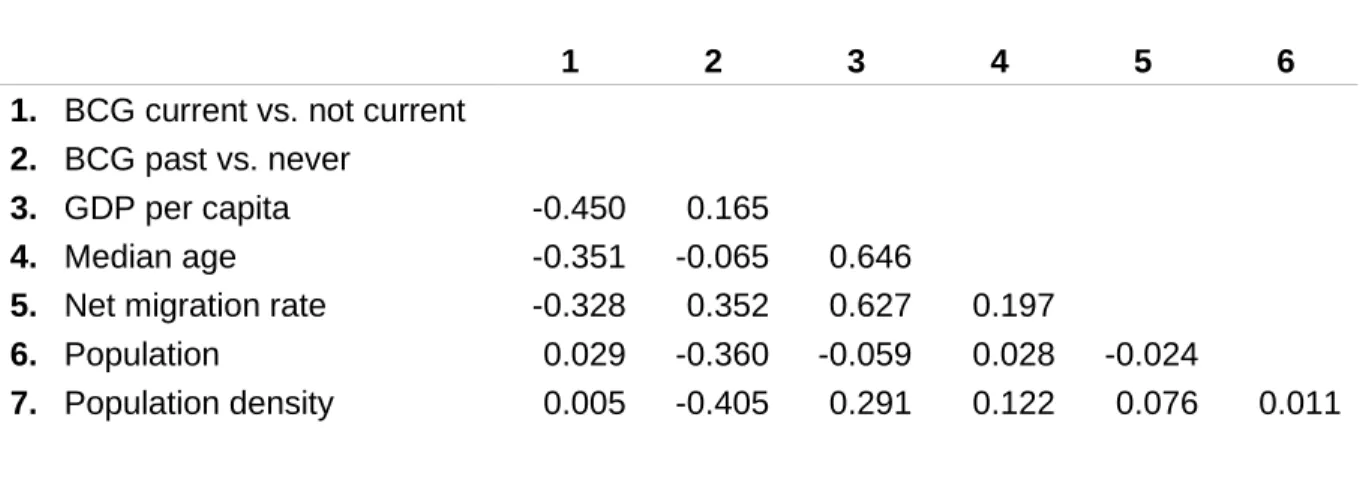
Table S2. Correlation table of all predictor variables.
1 2 3 4 5 6
1. BCG current vs. not current 2. BCG past vs. never
3. GDP per capita -0.450 0.165
4. Median age -0.351 -0.065 0.646
5. Net migration rate -0.328 0.352 0.627 0.197
6. Population 0.029 -0.360 -0.059 0.028 -0.024
Table S3. Regression table predicting the natural log of cases, using the estimated proportion of cases that are being reported in each country as a weighting factor. Day is mean centered, and BCG policy variables are both contrast-coded. Population is natural log-transformed, and all covariates are standardized. This analysis is based on 77 countries.
Cases
Predictor b t p
Intercept 6.908 43.691 <.001
Day 0.112 10.726 <.001
Median age 0.219 1.890 0.067
GDP per capita 0.098 0.779 0.439
Population density 0.120 0.425 0.672 Net migration rate 0.234 1.723 0.090
Population 0.525 6.908 <.001
BCG past vs. never 0.153 0.494 0.623 BCG current vs. not current -0.431 -2.199 0.031
Day x median age 0.006 0.946 0.348
Day x GDP per capita 0.011 1.691 0.096 Day x population density 0.004 0.224 0.824 Day x net migration rate 0.008 1.176 0.244 Day x population 0.035 8.446 <.001 Day x BCG past vs. never -0.006 -0.365 0.716 Day x BCG current vs. not
current
Table S4. Regression table predicting the natural log of cases, controlling for the total number of tests in each country. Day is mean centered, and BCG policy variables are both contrast-coded. Population is natural log-transformed, and all covariates are standardized. This analysis is based on 64 countries.
Cases
Predictor b t p
Intercept 6.754 175.361 <.001
Day 0.112 8.499 <.001
Median age 0.450 16.629 <.001
GDP per capita 0.022 0.628 0.530
Population density -0.154 -2.341 0.019 Net migration rate 0.230 6.868 <.001
Population 0.402 15.712 <.001
Total tests 0.182 7.236 <.001
BCG past vs. never 0.334 3.409 0.001 BCG current vs. not current -0.464 -7.950 <.001
Day x median age 0.005 0.627 0.534
Day x GDP per capita -0.004 -0.475 0.637 Day x population density 0.002 0.148 0.883 Day x net migration rate 0.012 1.710 0.093 Day x population 0.028 4.684 <.001 Day x total tests 0.012 2.183 0.033 Day x BCG past vs. never -0.009 -0.384 0.702 Day x BCG current vs. not
current
Table S5. Regression tables predicting the natural log of (A) cases and (B) deaths, using a 15-day window (instead of a 30-15-day window, as in Table 1). Day is mean centered, and BCG policy variables are both contrast-coded. Population is natural log-transformed, and all covariates are standardized. This analysis is based on 134 and 135 countries for cases and deaths,
respectively.
A. Cases B. Deaths
Predictor b t p b t p
Intercept 7.125 39.257 <.001 2.717 7.577 <.001
Day 0.157 14.422 <.001 0.174 7.730 <.001
Median age 0.343 2.803 0.008 0.252 1.141 0.257
GDP per capita 0.142 1.081 0.282 0.150 0.694 0.489
Population density -0.153 -2.096 0.038 -0.038 -0.308 0.759 Net migration rate 0.106 0.921 0.359 0.069 0.366 0.715 Population 0.583 7.605 <.001 0.720 5.639 <.001 BCG past vs. never 0.353 0.860 0.392 0.041 0.059 0.953 BCG current vs. not current -0.716 -3.016 0.003 -1.058 -2.670 0.009 Day x median age 0.023 3.081 0.004 0.022 1.623 0.108 Day x GDP per capita 0.008 0.933 0.353 0.011 0.850 0.397 Day x population density -0.008 -1.763 0.080 -0.005 -0.694 0.489 Day x net migration rate 0.004 0.560 0.576 0.006 0.536 0.593 Day x population 0.039 8.231 <.001 0.043 5.587 <.001 Day x BCG past vs. never 0.016 0.643 0.521 0.018 0.426 0.671 Day x BCG current vs. not
current
Table S6. Results from t-tests predicting each cultural dimension from BCG status (dummy-coded; 1 = currently mandated, 0 = mandated in the past or never mandated).
Predictor N t p
Individualism 64 -5.127 <.001 *** Power distance 64 5.026 <.001 ***
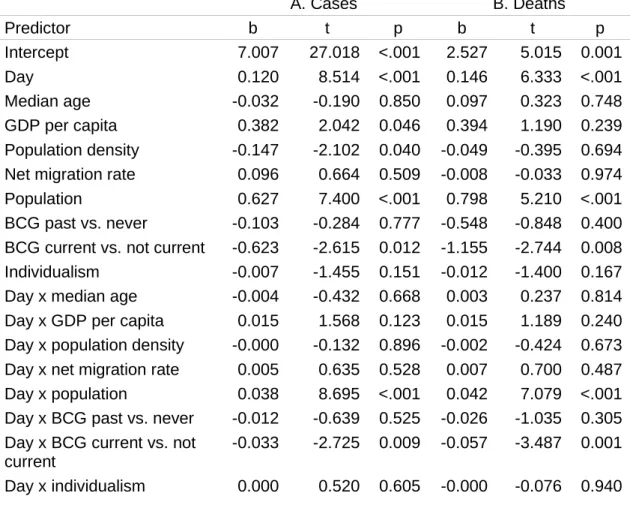
Table S7. Regression table predicting the natural log of (A) cases and (B) deaths from BCG status, controlling for individualism, as well as all covariates in our primary model. Day is mean-centered. All covariates, including individualism, are standardized. This analysis is based on 65 and 64 countries for cases and deaths, respectively.
A. Cases B. Deaths
Predictor b t p b t p
Intercept 7.007 27.018 <.001 2.527 5.015 0.001
Day 0.120 8.514 <.001 0.146 6.333 <.001
Median age -0.032 -0.190 0.850 0.097 0.323 0.748
GDP per capita 0.382 2.042 0.046 0.394 1.190 0.239
Population density -0.147 -2.102 0.040 -0.049 -0.395 0.694 Net migration rate 0.096 0.664 0.509 -0.008 -0.033 0.974 Population 0.627 7.400 <.001 0.798 5.210 <.001 BCG past vs. never -0.103 -0.284 0.777 -0.548 -0.848 0.400 BCG current vs. not current -0.623 -2.615 0.012 -1.155 -2.744 0.008 Individualism -0.007 -1.455 0.151 -0.012 -1.400 0.167 Day x median age -0.004 -0.432 0.668 0.003 0.237 0.814 Day x GDP per capita 0.015 1.568 0.123 0.015 1.189 0.240 Day x population density -0.000 -0.132 0.896 -0.002 -0.424 0.673 Day x net migration rate 0.005 0.635 0.528 0.007 0.700 0.487 Day x population 0.038 8.695 <.001 0.042 7.079 <.001 Day x BCG past vs. never -0.012 -0.639 0.525 -0.026 -1.035 0.305 Day x BCG current vs. not
current
-0.033 -2.725 0.009 -0.057 -3.487 0.001 Day x individualism 0.000 0.520 0.605 -0.000 -0.076 0.940
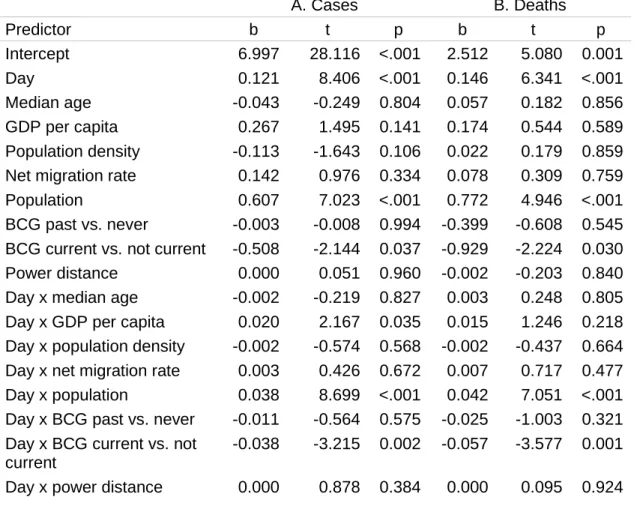
Table S8. Regression table predicting the natural log of (A) cases and (B) deaths from BCG status, controlling for power distance, as well as all covariates in our primary model. Day is mean-centered. All covariates, including power distance, are standardized. This analysis is based on 65 and 64 countries for cases and deaths, respectively.
A. Cases B. Deaths
Predictor b t p b t p
Intercept 6.997 28.116 <.001 2.512 5.080 0.001
Day 0.121 8.406 <.001 0.146 6.341 <.001
Median age -0.043 -0.249 0.804 0.057 0.182 0.856
GDP per capita 0.267 1.495 0.141 0.174 0.544 0.589
Population density -0.113 -1.643 0.106 0.022 0.179 0.859 Net migration rate 0.142 0.976 0.334 0.078 0.309 0.759 Population 0.607 7.023 <.001 0.772 4.946 <.001 BCG past vs. never -0.003 -0.008 0.994 -0.399 -0.608 0.545 BCG current vs. not current -0.508 -2.144 0.037 -0.929 -2.224 0.030 Power distance 0.000 0.051 0.960 -0.002 -0.203 0.840 Day x median age -0.002 -0.219 0.827 0.003 0.248 0.805 Day x GDP per capita 0.020 2.167 0.035 0.015 1.246 0.218 Day x population density -0.002 -0.574 0.568 -0.002 -0.437 0.664 Day x net migration rate 0.003 0.426 0.672 0.007 0.717 0.477 Day x population 0.038 8.699 <.001 0.042 7.051 <.001 Day x BCG past vs. never -0.011 -0.564 0.575 -0.025 -1.003 0.321 Day x BCG current vs. not
current
-0.038 -3.215 0.002 -0.057 -3.577 0.001 Day x power distance 0.000 0.878 0.384 0.000 0.095 0.924
Figure S1. Growth curves by country BCG policy in the first 15 days of country-wise outbreaks for (A-B) cases and (C-D) deaths, presented on linear (A & C) and logarithmic (B & D) scales.