Implementation Guide
r8
This Documentation may not be copied, transferred, reproduced, disclosed, modified or duplicated, in whole or in part, without the prior written consent of CA. This Documentation is confidential and proprietary information of CA and may not be disclosed by you or used for any purpose other than as may be permitted in (i) a separate agreement between you and CA governing your use of the CA software to which the Documentation relates; or (ii) a separate confidentiality agreement between you and CA.
Notwithstanding the foregoing, if you are a licensed user of the software product(s) addressed in the Documentation, you may print or otherwise make available a reasonable number of copies of the Documentation for internal use by you and your employees in connection with that software, provided that all CA copyright notices and legends are affixed to each reproduced copy.
The right to print or otherwise make available copies of the Documentation is limited to the period during which the applicable license for such software remains in full force and effect. Should the license terminate for any reason, it is your responsibility to certify in writing to CA that all copies and partial copies of the Documentation have been returned to CA or destroyed. TO THE EXTENT PERMITTED BY APPLICABLE LAW, CA PROVIDES THIS DOCUMENTATION “AS IS” WITHOUT WARRANTY OF ANY KIND, INCLUDING WITHOUT LIMITATION, ANY IMPLIED WARRANTIES OF MERCHANTABILITY, FITNESS FOR A PARTICULAR PURPOSE, OR NONINFRINGEMENT. IN NO EVENT WILL CA BE LIABLE TO YOU OR ANY THIRD PARTY FOR ANY LOSS OR DAMAGE, DIRECT OR INDIRECT, FROM THE USE OF THIS DOCUMENTATION, INCLUDING WITHOUT LIMITATION, LOST PROFITS, LOST INVESTMENT, BUSINESS INTERRUPTION, GOODWILL, OR LOST DATA, EVEN IF CA IS EXPRESSLY ADVISED IN ADVANCE OF THE POSSIBILITY OF SUCH LOSS OR DAMAGE.
The use of any software product referenced in the Documentation is governed by the applicable license agreement and such license agreement is not modified in any way by the terms of this notice.
The manufacturer of this Documentation is CA.
Provided with “Restricted Rights.” Use, duplication or disclosure by the United States Government is subject to the restrictions set forth in FAR Sections 12.212, 52.227-14, and 52.227-19(c)(1) - (2) and DFARS Section 252.227-7014(b)(3), as applicable, or their successors.
Copyright © 2011 CA. All rights reserved. All trademarks, trade names, service marks, and logos referenced herein belong to their respective companies.
CA Technologies Product References
This document references the following CA Technologies products: ■ CA ERwin® Data Modeler Standard Edition
Review support maintenance programs and offerings. Registering for Support
Access the CA Support online registration site to register for product support. Accessing Technical Support
For your convenience, CA Technologies provides easy access to "One Stop" support for all editions of CA ERwin Data Modeler, and includes the following:
■ Online and telephone contact information for technical assistance and customer services
■ Information about user communities and forums ■ Product and documentation downloads
■ CA Support policies and guidelines
■ Other helpful resources appropriate for your product
For information about other Home Office, Small Business, and Enterprise CA Technologies products, visit http://ca.com/support.
Provide Feedback
If you have comments or questions about CA Technologies product documentation, you can send a message to [email protected].
If you would like to provide feedback about CA Technologies product documentation, complete our short customer survey, which is also available on the CA Support website, found at http://ca.com/docs.
CA ERwin Data Modeler News and Events
Visit www.erwin.com to get up-to-date news, announcements, and events. View video demos and read up on customer success stories and articles by industry experts.
Contents 5
Contents
Chapter 1: Overview and Installation
11
Database Design Overview ... 11
Overview ... 11
Before You Install ... 12
Install CA ERwin Data Modeler... 13
License Information ... 14
Chapter 2: Basic Concepts and Features
15
The Application Development Cycle ... 15Basic Data Modeling Concepts ... 15
Model Types... 16
Entities ... 17
Tables ... 18
Attributes and Columns ... 19
Primary Key and Non-Keys ... 20
Foreign Key... 20
Relationships ... 21
Create a Model ... 23
Name Your Model ... 23
Add Entities ... 24
Edit an Entity Name ... 24
Add Attributes ... 25
Create Relationships ... 25
Save Your Model ... 26
Enhance Your Data Model ... 27
Graphic Features ... 27
Objects Can Inherit Color ... 28
The Theme Editor ... 29
Add an Annotation... 36
Resize a Box ... 37
Object Arrangement ... 37
Drawing Objects... 39
Add Drawing Objects to a Data Model... 39
Print a Model ... 42
Specify General Page Setup Options ... 43
6 Implementation Guide
Change Page Margins for Printing ... 45
Add a Page Header or Footer ... 45
Set Print Defaults at the Diagram Level ... 47
Chapter 3: Understanding the Workplace
49
Toolbars ... 49Alignment Toolbar ... 50
Display Toolbar ... 50
Database Toolbar... 51
Drawing Toolbar ... 51
Formatting Toolbar ... 52
Layout Toolbar ... 52
Model Manager Toolbar ... 53
The ERwin Toolbox ... 54
The Standard Toolbar ... 54
Transformations Toolbar ... 54
Zoom Toolbar ... 55
Workplace Panes ... 55
Model Explorer ... 57
Action Log... 66
Advisories Pane ... 77
Overview Pane ... 77
Bulk Editor Pane... 78
Property Editors ... 84
Property Editor Navigation Grid ... 84
Property Editor Toolbar ... 84
Property Editor Tabs and Options ... 85
Property Inheritance Features for Modeling Objects ... 86
Chapter 4: Working with Data Models
89
Domains ... 89Domain Editor ... 90
Inherited and Non-inherited Domain Properties ... 91
Attributes and Columns in Domains ... 91
Drag a Domain from the Model Explorer to Your Model ... 91
Creating New Domains ... 91
Assign a Data Type to a Domain ... 94
Domain Icons ... 95
Assign or Change a Domain Icon ... 95
Relationships ... 96
Contents 7
Other Relationship Types ... 97
Relationship Creation ... 98
Relationship Lines ... 98
Relationship Editor ... 98
Verb Phrases ... 99
Views ... 101
Methods for Adding a View to a Model ... 102
Display Levels... 102
Logical Display Levels... 102
Physical Display Levels... 104
Subject Areas ... 105
Subject Area Members ... 105
Subject Areas in the Logical/Physical Model ... 106
The Subject Area Editor... 106
Create a New Subject Area in the Subject Area Editor ... 106
Subject Areas in the Model Explorer ... 109
Index Tables ... 109
Types of Indexes ... 110
Unique and Non-Unique Indexes ... 110
The Table Index Editor... 112
Create an Index in the Table Index Editor ... 112
Find and Replace ... 114
Forward Engineering ... 115
Preview Schema Generation ... 116
Change Schema Generation Options ... 117
Generate the Schema ... 119
Save the Script File ... 120
Generate Alter Scripts ... 120
Chapter 5: Working with Data Design Features
121
Reverse Engineering ... 121Database Connection Overview ... 122
Template Selection ... 123
Options for Reverse Engineering ... 123
Set Model Type, Template, and Database For Reverse Engineer ... 124
Set Options for Reverse Engineer... 125
How to Use the Metadata Integration Wizard ... 127
Set Options for Import from External Format ... 128
Set Options for Export to External Format ... 130
Complete Compare ... 131
8 Implementation Guide
How Model Selection Works... 132
Load a Model as Read-Only ... 134
Allow Demand Loading ... 134
Type Selection Compare Levels ... 135
Refine the Criteria for Object Comparison ... 137
Filter By Owner Name ... 138
Advanced Options ... 139
Resolve Differences ... 142
Resolve Differences Dialog ... 143
Comparison Results ... 148
Resolve Actions ... 148
Save a Complete Compare Snapshot ... 149
Generate an Alter Script ... 151
Save Your Models ... 152
Additional Complete Compare Functionality ... 152
Chapter 6: Report on Your Data Model
157
The Query Tool ... 157Create a Query ... 158
Open a Query ... 158
Save a Query ... 159
Execute a Query ... 159
Execute a Query Against a Database ... 160
Execute a Query Against ERwin ODBC ... 160
Use Crystal Reports With CA ERwin Data Modeler... 161
Using the Bulk Editor to Create a Report ... 162
Generate a Diagram Picture ... 165
Chapter 7: Working with Design Layers
167
Design Layers ... 167Design Layer Hierarchy ... 168
New Design Layers... 170
Transformations ... 176
Preserve Model History ... 191
Chapter 8: Naming and Datatype Standards
195
The Model Naming Options Dialog ... 195The Naming Standards Editor... 196
Object Name Syntax ... 197
Contents 9
Save a Naming Standards File ... 197
Check Name Compliance in a Model ... 198
Name Hardening Wizard ... 199
Override Name Inheritance ... 201
Unharden Object Names ... 202
Data Type Standards ... 202
The Datatype Standards Editor... 203
Create a Data Type Mapping List ... 203
Save a Data Type Mapping File (.dsm) ... 204
The Model Datatype Options Dialog ... 204
Attach a Data Type Standards File to a Model ... 205
Data Type Standards Reuse ... 205
Appendix A: Third-Party Acknowledgements
207
Appendix B: Supported Metadata Integration Bridges
211
Table of Supported Bridges ... 211Index
217
Chapter 1: Overview and Installation 11
Chapter 1: Overview and Installation
This section contains the following topics: Database Design Overview (see page 11) Overview (see page 11)
Before You Install (see page 12)
Install CA ERwin Data Modeler (see page 13) License Information (see page 14)
Database Design Overview
Welcome to CA ERwin Data Modeler (CA ERwin DM), the database design tool that raises the level of data quality in transactional and data warehouse systems. It provides the tools to design and implement databases for transactional business, E-commerce, and data warehousing applications.
You can create and maintain graphical models that represent databases, data
warehouses, and enterprise data models. CA ERwin DM provides a modeling platform where corporate data requirements and related database designs can be defined, managed, and implemented across a wide variety of database platforms.
A Windows-based graphical user interface is combined with powerful entity-relationship (ER) diagramming tools, custom editors to define physical database objects, a Model Explorer for a text-based view of model objects, and support for leading SQL and desktop databases.
You can also use CA ERwin DM to streamline the application development process, by allowing different groups (Standards Administrators, Business Analysts, Data Modelers, and so on) to perform work independently, while collaborating and synchronizing. In this way, different groups can simultaneously work on various parts of a model or different model types.
Overview
CA ERwin DM combines a Windows-based graphical user interface with
entity-relationship (ER) diagramming tools, and numerous innovative features. These features allow you to easily create and maintain your relational database and the logical and physical models that describe it. CA ERwin DM works by providing a design solution that helps you create a visual blueprint (a data model) for your organization.
12 Implementation Guide
CA ERwin DM is much more than a drawing tool. It not only helps you design a logical data model, which captures business rules and requirements, but it also supports the design of a corresponding physical data model for your target server. This enables you to forward engineer this physical data model and automatically generate physical database structures to your system catalog.
CA ERwin DM supports reverse engineering of existing databases and provides both a physical and logical/physical data model so you can maintain an existing database, or migrate from your current target server to a different one.
The Complete Compare technology automates model and database synchronization by letting you compare the model with the database, displaying, and analyzing the differences. This enables you to selectively move the differences into the model or generate them into the database.
Before You Install
Review the hardware and software requirements and the list of supported target databases in the Release Notes before you begin the installation.
Administrative Privileges Required for Installation
Because the installation process for CA ERwin Data Modeler writes to the registry and system folders, the person installing, upgrading, or removing CA ERwin Data Modeler must have Administrative privileges. If you run an installation without Administrative privileges, all files may not be installed or upgraded, and users will encounter problems when running the software.
Install CA ERwin Data Modeler
Chapter 1: Overview and Installation 13
Install CA ERwin Data Modeler
The Installation Wizard makes it easy for you to install, change, or remove CA ERwin Data Modeler.
To install CA ERwin Data Modeler
1. Insert the installation DVD or double-click the file you downloaded from the online CA product page.
The Installation Wizard opens.
2. Follow the prompts in the wizard to proceed. If you install from the DVD, you are prompted to select the applications you wish to change or install. Click Next. A License Agreement opens for you to review.
3. Select the option to accept the terms as described in the License Agreement. Click Next.
The wizard asks a series of questions you must answer, including: ■ Customer Information
■ Destination folder for the CA ERwin DM files
4. On the Custom Setup Type screen, review the program features that will be installed. You can also evaluate the space needed to install each feature. Click Next to continue and then click Install to start the installation. The program files are copied.
If you have not already licensed CA ERwin Data Modeler, you can license the program when the install process is complete. Follow the on-screen prompts to open the License Verification dialog and enter the license key provided with the product CD.
14 Implementation Guide
License Information
When you launch CA ERwin Data Modeler r8 for the first time, the Community Edition of this product opens. If you have purchased an entitlement for one of the other available editions, you must generate the license in order to use that edition.
Follow this process to obtain your license: 1. Click Licensing on the Help menu.
The Licensing dialog opens displaying the MAC addresses discovered on your machine.
2. Select the appropriate MAC address, ensuring you do not use the MAC address of an adapter located in a docking station or an external hard drive, and click Close. 3. Contact CA ERwin Data Modeler support with your MAC address to receive your
permanent license files.
4. Copy your license files locally on your machine as follows: For Windows XP
C:\Documents and Settings\<user name>\Local Settings\Application Data\CA\ERwin Data Modeler\8.0
Important! Ensure hidden files and folders display in Windows Explorer or you will be unable to locate this directory. If you cannot locate this directory in Windows Explorer, select Folder Options on the Tools menu and click the View tab. In Files and Folders under Advanced settings, select the Show hidden files and folders option. Click the Apply to All Folders button, click Apply, and click OK.
For Windows 7
C:\Users\<user name>\AppData\Local\CA\ERwin Data Modeler\8.0 Note: If you need assistance with licensing, you can open an issue online at the CA ERwin Data Modeler support site.
Chapter 2: Basic Concepts and Features 15
Chapter 2: Basic Concepts and Features
This section contains the following topics: The Application Development Cycle (see page 15) Basic Data Modeling Concepts (see page 15) Create a Model (see page 23)
Enhance Your Data Model (see page 27) Print a Model (see page 42)
The Application Development Cycle
Most data modeling solutions begin with the gathering of business rules and creating logical constructs and continues to the physical design phase followed by the implementation of a database that supports one or more applications. CA ERwin DM supports this iterative process by supporting multiple platforms, reuse of objects, and the ability to synchronize changes between data models across the enterprise.
Basic Data Modeling Concepts
Before creating or working with data models, there are some basic data modeling concepts that you must be familiar with. These concepts include:
■ Model Types ■ Entities ■ Tables
■ Attributes and Columns ■ Primary Key
■ Relationships ■ Foreign Key
16 Implementation Guide
Model Types
Multiple model types allow data modelers or data analysts to work with the models best suited for their needs. The following model types are available:
Logical
A conceptual model that contains objects such as entities, attributes, and key groups.
Physical
A database-specific model that contains objects such as tables, columns, and data types.
Logical/Physical
Basic Data Modeling Concepts
Chapter 2: Basic Concepts and Features 17
Entities
An entity is a logical object that represents a person, place, or thing about which an organization maintains information.
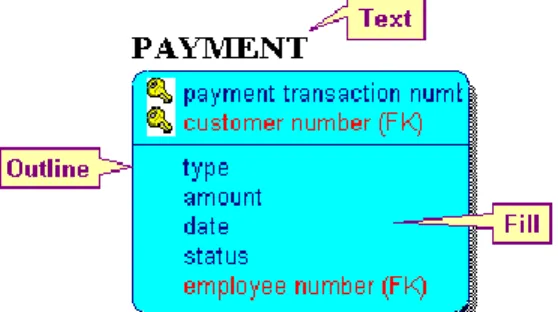
In the following diagram, the logical data model has the following entities: ■ CUSTOMER
■ EMPLOYEE ■ MOVIE ■ MOVIE COPY
■ MOVIE RENTAL RECORD ■ PAYMENT
18 Implementation Guide
Tables
In the logical model, an entity usually corresponds to a table in the physical model. In the physical model, a graphic box represents a table in which data is stored in the database.
Types of Entities/Tables
Two types of entities/tables can be drawn in a data model: Independent Entity
Anentity whose instances can be uniquely identified without determining its relationship to another entity. It is represented as a box with square corners. Dependent Entity
An entity whose instances cannot be uniquely identified without determining its relationship to another entity or entities. It is represented as a box with rounded corners.
Basic Data Modeling Concepts
Chapter 2: Basic Concepts and Features 19
When you add an entity, the entity type is determined based on the relationship in which it is involved. For example, when you initially place an entity in a model, it is represented as an independent entity. When you connect the entity to another entity using a relationship, it is determined if the entity is independent or dependent based on the relationship type.
Attributes and Columns
After you have discovered the people, places, and events that define the entities in your model, you can begin to define the attributes for each entity.
Attributes collect information about an entity and columns collect information about a table. Logical attributes usually correspond to physical columns in a table.
For example, after you create the CUSTOMER entity, you can begin to define the individual pieces of information you want to track for each customer, including Name, Address, and Phone Number. In the logical model, each of these pieces of information is saved as an attribute of the CUSTOMER entity. In the physical model, attributes equate to columns in a table.
Note: A row of data is inserted in a table when a record is added to the database directly or through an application.
After you create an entity or table, you can add attributes and columns, respectively. Many easy methods for creating and modifying the properties of these objects are provided. The most basic method is to add the name directly in the Diagram Window. You can also use a domain to add attributes and columns.
20 Implementation Guide
Primary Key and Non-Keys
Entities and tables are drawn as a box with a horizontal line near the top of the box. The area above the horizontal line is known as the key area because that is where the entity's primary key resides. The primary key can be comprised of one or more attributes that uniquely identify the entity.
The area below the horizontal line is known as the non-key area because that is where all other attributes reside.
Note: A foreign key may appear in either the primary key or the non-key area of an entity or table. For more information about foreign keys, see Foreign Key (see page 20).
Foreign Key
When you create a relationship between entities, the primary key attributes of the parent entity are automatically migrated to the child entity. The designator (FK) indicates the name of the migrated key attribute, also known as a foreign key. This migration occurs automatically in the physical model.
Basic Data Modeling Concepts
Chapter 2: Basic Concepts and Features 21
If the foreign key attribute has the same name as an owned attribute in the child entity, the two instances are automatically unified into one attribute because it assumes that they are the same attribute. The process of combining or unifying identical attributes in an entity is called unification.
Note: The foreign keys display in the model by default, designated by (FK). If you do not see this designation, open the Diagram Editor (click Diagrams in the Diagram menu), and do the following depending on whether you are working in a logical or physical model: Logical model
Click the Entity tab, and ensure the options Display Logical Foreign Key (FK) Designator and Display Migrated Attributes are selected.
Physical model
Click the Table tab, and ensure the option Display Physical Foreign Key (FK) Designator is selected.
Relationships
An important object in a data model is the relationship, which is represented by the solid or dashed line that connects two entities or two tables. A relationship line
connects a parent and a child entity or table. Usually, a symbol appears at the child-end of the relationship line. The symbol changes based on the diagram notation that you select.
22 Implementation Guide
Types of Relationships
Relationships are important because the type of relationship determines how a primary key of the parent entity or table migrates to the child entity or table as a foreign key. There are two basic types of relationships:
Identifying Relationship
An identifying relationship is represented by a solid line and through it the primary key of the parent migrates to the primary key area of the child entity or table. Non-Identifying Relationship
A non-identifying relationship is represented by a dashed line and through it the primary key of the parent migrates to the non-key area of the child entity or table. In an identifying relationship, the foreign key migrates above the line and becomes part of the primary key of the child entity (see Foreign Key (see page 20) for more
information). In a non-identifying relationship, the foreign key migrates below the line and becomes a non-key attribute in the child entity. A dashed line represents a non-identifying relationship.
Note: If you want a non-key to migrate instead of the primary key, you can use the alternate key migration option. For more information, see the online help.
Create a Model
Chapter 2: Basic Concepts and Features 23
Create a Model
Now that you have a basic understanding of the workplace and the concepts associated with data modeling, you can begin creating a model.
To create a model
1. Click New on the File menu.
The Create Model - Select Template dialog opens.
2. Click Logical/Physical in the New Model Type group box, and select a template and target database. Click OK.
A new model is created and opens in the workspace.
Name Your Model
When you create a new data model, you should also create a name, or title, for the model. This name is used throughout the Design Layer features to identify the model by name. If you do not change it, by default “model_n” displays for all models. For
example, the first model is named “model_1”, the second model is named “model_2”, and so on.
To name your model
1. Click Model Properties on the Model menu. The Model Editor opens.
2. Enter the name you want to give the model on the General tab. You can also add the author's name in the Author field.
3. Click Close.
The information you entered is saved and the Model Editor closes. Note: You can also enable Modeling Features using the Model Editor.
24 Implementation Guide
Add Entities
In the logical model, you can add entities using the ERwin toolbox. To add entities
1. Click the Entity tool in the toolbox.
The cursor changes from an arrow to the entity symbol.
2. Click anywhere in the Diagram Window to place the first entity. By default, this entity is named E/1.
Repeat Steps 1 and 2 to create as many entities as needed; they are named E/2, E/3 and so on.
3. Click Save As on the File menu to save your model. The Save As dialog opens.
4. Enter a name for the model and click Save.
The model is saved with the .erwin file extension, and the Save As dialog closes. Note: The entities that you created in the Diagram Window also appear in the Model Explorer and Action Log because all three areas of the workplace are automatically synchronized.
Edit an Entity Name
You can edit an entity name by typing directly in the Diagram Window. To edit an entity name
1. In the Diagram Window, click on the entity named E/1. Wait briefly, then click again.
An edit box appears around the name.
2. Enter CUSTOMER over the default entity name and click once outside of the edit box.
The entity is renamed.
The entity is renamed.
Note: You can also edit an entity name in the Model Explorer when you select and right-click the entity name.
Create a Model
Chapter 2: Basic Concepts and Features 25
Add Attributes
You can add attributes to the entities directly in the Diagram Window. To add attributes
1. In the Diagram Window, click an entity box and press Tab.
An edit box opens below the entity name with the default name, attribute_name.
2. Enter the attribute name directly over the default name and click outside of the edit box.
The attribute is added.
Note: To add another primary key, before clicking outside the edit box, press Enter and the edit box opens above the line in the entity. To add a non-key, press Tab and the edit box opens below the line in the entity.
Create Relationships
In the following exercise, we will add two relationships:
■ An identifying relationship between a parent and child entity
■ A non-identifying relationship between the entities ORDER and PRODUCT To create relationships
1. Click the Identifying Relationship tool in the ERwin toolbox.
The cursor changes from the arrow symbol to the identifying relationship symbol. 2. Click the parent entity to begin setting an identifying relationship between the
parent and child entity in the Diagram Window. 3. Click the child entity.
A highlighted relationship line connects the two entities.
Note: The relationship line is temporarily highlighted to make it easier to view the relationship. The relationship line is highlighted as you create it, or any time you select it.
26 Implementation Guide
When finished, your model should look similar to the following example:
4. Click the Non-identifying relationship tool in the toolbox.
The cursor changes from the arrow symbol to the non-identifying relationship symbol.
5. Click the parent entity and then click the child entity to add a non-identifying relationship between them.
When finished, your model should look similar to the following example:
Save Your Model
To save the changes you made to your model, click Save on the File menu. You can open the file again later for editing.
Enhance Your Data Model
Chapter 2: Basic Concepts and Features 27
Enhance Your Data Model
When you design a data model, you can use many of the drawing and display features to enhance its appearance and make it easier to view and understand.
To prepare a diagram for analysis and presentation, you can:
■ Enlarge the font size for all entity names so that they are easier to read. ■ Change the color of all foreign keys to red, so that they are distinguishable from
other attributes or columns.
■ Use different fonts and colors to identify new objects from old objects in your model.
■ Resize one or more entity boxes ■ Align two or more entity boxes
Graphic Features
A diagram has several types of graphic elements that you can enhance with color. For example, you can individually specify text, fill, and line sizes and colors for entities, attributes and relationships, or use themes to define the default display of certain objects by diagram, or by model.
In addition to these graphic elements, there are many object types that you can change globally such as Foreign Keys, Entity Names, and Owned Keys.
28 Implementation Guide
Objects Can Inherit Color
The color of an object can be related to the color it inherits from other objects in the diagram. For example, you can choose to have a foreign key attribute or column, inherit its font and color from its parent primary key or relationship.
You can also change the color of foreign key columns or attributes so that you can easily identify them from owned primary key columns or attributes.
Enhance Your Data Model
Chapter 2: Basic Concepts and Features 29
The Theme Editor
You use options in the Theme Editor to set formatting and display options for objects in your model. You can create a custom Theme and apply it to selected diagrams on your model, or use the Default Theme supplied with the program.
You can open the Theme Editor in any of these ways: ■ From the General Tab on the Diagram Editor ■ When you click Themes on the View menu ■ From the Model Explorer
CA ERwin Data Modeler ships with two themes—Default and Classic. The Default Theme has the new "r8 look" and the Classic Theme has the "r7 look." These cannot be edited, but you can create new themes.
30 Implementation Guide
Formatting Options in the Theme Editor
You use the Theme Editor to define the default theme for various ERwin objects. The Theme Editor displays tabs for each object and it depends on the model type that you select. In a logical/physical model, you can switch from the logical model to the physical model to change the settings for each side of the model.
The Theme Editor has the following options: Name
Specifies the name of the Theme. Default Font
Specifies the default font for the selected Theme. Click to change the font style options.
Diagram Fill
Specifies the default fill color for the diagrams in the selected Theme. Click to change the fill style options.
Entity Font
Specifies the default font for the entities in the selected Theme in a logical model. Click to change the font style options.
Table Font
Specifies the default font for the tables in the selected Theme in a physical model. Click to change the font style options.
Entity Fill
Specifies the default fill color for the entities in the selected Theme in a logical model. Click to change the fill style options.
Table Fill
Specifies the default fill color for the tables in the selected Theme in a physical model. Click to change the fill style options.
Attribute Font
Specifies the default font for the attributes in the selected Theme in a logical model. Click to change the font style options.
Column Font
Specifies the default font for the columns in the selected Theme in a physical model. Click to change the font style options.
FK Attribute Font
Specifies the default font for the foreign key attributes in the selected Theme in a logical model. Click to change the font style options.
Enhance Your Data Model
Chapter 2: Basic Concepts and Features 31 FK Column Font
Specifies the default font for the foreign key columns in the selected Theme in a physical model. Click to change the font style options.
FK Attribute Color
Specifies the default color for the foreign key attributes in the selected Theme in a logical model. Click to change the color options.
FK Column Color
Specifies the default color for the foreign key columns in the selected Theme in a physical model. Click to change the color options.
The Theme Editor includes the following tabs: Defaults
Define the font and color for the background window and the overall default for objects on the diagram window.
Entity
Define font, fill, and outline options for entity names and definitions in a logical model.
Attribute
Define fonts and colors options for owned and foreign key attributes in a logical model.
Table
Define font, fill, and outline options for table names and definitions in a physical model.
Column
Define fonts and colors options for owned and foreign key columns in a physical model.
Key
Define the key display preference, the Alternate Key (AK) Attribute font, and the Inversion Entry (IE) Attribute font.
View
Define the font, fill, and outline options for the name and definition for a view. Define display fonts for an owned attribute and expression.
Materialized Query Table (DB2 only)
Define the font, fill, and outline options for the name and definition for a
materialized query table. Define display fonts for an owned attribute, expression, Alternate Key (AK) Attribute, and Inversion Entry (IE) Attribute.
32 Implementation Guide
Define style inheritance options, and the font, color, and line style for relationships. Subtype Symbol
Define style inheritance options, and the font, color, and line style for subtypes. Annotation/Shape
Define formatting options such as font, fill, line, and outline for annotations/shapes. Where Used
Displays what is affected by the selected Theme. The display can include a diagram name, subject areas, individual modeling objects, and drawing objects.
Definition
Lets you enter definition text to associate with the selected Theme. UDP
Enhance Your Data Model
Chapter 2: Basic Concepts and Features 33
Create a New Theme
You use the Theme Editor to create your own theme that sets the preferences for displaying objects in your model. When you create a new theme, you can choose to apply it to any diagram by selecting this theme from the Theme Editor when you are working in that diagram.
You use the Defaults tab to set the preferences for font and fill colors for all objects in your model. When you select a Theme for your model, all objects in your model inherit these values.
Note: The options and tabs change depending on the model type (logical or physical) with which you are working.
To create a new theme
1. Click Themes on the View menu. The Theme Editor opens.
2. Click New on the toolbar to create a new theme and work with the following options:
Name
Specifies the name of the theme. Enter the theme name in this field.
Default Font
Specifies the default font. Click to define the font style.
Diagram Fill
Specifies the default fill color for diagrams. Click to define the fill style.
Entity (or Table) Font
Specifies the default font for the entities (or tables). Click to define the font style.
Entity (or Table) Fill
Specifies the default fill color for the entities (or tables). Click to define the fill style.
Attribute (or Column) Font
Specifies the default font for the attributes (or columns). Click to define the font style.
FK Attribute (or Column) Font
Specifies the default font for the foreign key attributes or columns. Click to define the font style.
34 Implementation Guide
Specifies the default color for the foreign key attributes or columns. Click to define the color.
3. Click the Defaults tab and work with the following options:
Font Settings
Specifies the default font. Click to define the general font style.
Fill Settings
Specifies the default color for the objects in the diagram. Click to define the general fill style.
Line Settings
Specifies the default line style. Click to define the general line style.
Outline Settings
Specifies the default outline style for the model. Click to define the general outline style.
Diagram Fill
Specifies the default background color for the diagrams in your model. Click to define the general fill style.
4. Work with the options on the other tabs to define display options for specific objects, such as views, relationships, and subtype symbols, or define UDPs or theme definition.
5. Click Close.
Enhance Your Data Model
Chapter 2: Basic Concepts and Features 35
Set Font and Fill Preferences for Objects
You use the Defaults tab to set the default preferences for font and fill colors for all objects in your model. When you select a Theme for your model, all objects in your model inherit these values.
To set the default font and fill preferences for objects 1. Click Themes on the View menu.
The Theme Editor opens.
2. Select the Theme for which you want to set the default values, and click the Defaults tab.
3. Work with the following options:
Font Settings
Specifies the default font. Click to change the general font style options.
Fill Settings
Specifies the default color for the objects in the diagram. Click to change the general fill style options.
Line Settings
Specifies the default line style. Click to change the general line style options.
Outline Settings
Specifies the default outline style for the model. Click to change the general outline style options.
Diagram Fill
Specifies the default background color for the diagrams in your model. Click to change the general fill style options.
4. Click Close.
36 Implementation Guide
Using a Model to Import Styles
You can maintain and share global formatting templates by creating a Theme in one model and importing it into another model. This process uses the CA ERwin Data Modeler Link Model Source wizard to import the Theme into a second model. Use this process to maintain a global style template and import a Theme into another model:
■ Create a new source model to contain the Theme you want to use as a template for other models.
■ Use the Theme editor to create a new Theme and define your formatting styles. Save your source model.
■ Open the model in which you want to import the Theme.
■ Click Tools, Link Model Source to open the Link Model Source wizard. Select your global style template model as the source model and click Finish. It is not necessary to change any of the other defaults in the wizard.
■ The objects from the source model are ready for import into your open model. The Complete Compare Resolve Differences dialog opens, where you can review and import the Theme to your target model.
■ Click Finish.
Add an Annotation
You can add annotations to a diagram to identify or clarify model elements. Annotations can include any text you choose including diagram version numbers, notes, titles, and captions.
To add an annotation
1. Click the Annotation tool on the ERwin Toolbox.
The cursor changes from the arrow symbol to the annotation symbol. 2. Click the diagram window where you want the annotation to appear.
Enhance Your Data Model
Chapter 2: Basic Concepts and Features 37
3. Type the annotation text that you want to appear, and click the diagram window outside the annotation area.
The annotation is added.
4. (Optional) To add consecutive multiple annotations, press the CTRL key before you click the Annotation icon.
When you click again in the diagram window, another annotation is created. If you add annotations this way, you first create multiple empty text areas and then must return to each text area to enter the text.
Note: To align multiple annotations, use the Alignment toolbar.
Resize a Box
To enhance the appearance of your data model, you can make all of the entity, table, or view boxes uniform in size. You can also emphasize one or two boxes by making them larger than the others, or resize any box to meet your presentation requirements. To resize a box
1. Use the Select tool, and click near the border of the box that you want to resize. The resize handles appear.
2. Move the Select tool until you see the cursor shape change into a two-sided arrow.
Hold down the mouse button and grab the resize handle. Move the cursor to adjust the height or width of the box.
Release the mouse button when you are satisfied with the new dimensions of the box.
The box is resized.
Object Arrangement
Some of the automatic layout features help you arrange objects in your diagram. The alignment toolbar helps you quickly align the object boxes along the top, bottom, or sides of the boxes.
The alignment toolbar includes tools to evenly space a set of objects horizontally or vertically.
38 Implementation Guide
Adjust the Object Spacing on the Diagram Window
Use the alignment feature to quickly adjust object alignment on the diagram window. To adjust the object spacing on the diagram window
1. Select at least three of the objects that you want to align on the diagram window. 2. Select one of the following on the Alignment toolbar:
Align Top
Aligns the objects to the top of the diagram.
Align Bottom
Aligns the objects to the bottom of the diagram.
Align Centers
Aligns the centers of the objects.
Align Left
Aligns the objects to the left side of the diagram.
Align Right
Aligns the objects to the right side of the diagram.
Align Middle
Aligns the objects to the middle of the diagram. Objects display on the diagram aligned as you selected.
Group and Ungroup Objects
You can group objects to easily maintain and manage your models. For example, you may want to group all the entities that you work with by category. When you create groups, it also helps ensure that single entities will not be inadvertently moved. Note: To adjust alignment within the group, you must first ungroup the objects. To group and ungroup objects
1. Select the objects that you want to group using the Select tool on the ERwin Toolbox.
2. Click Group on the Diagram menu.
You can now move the group around the model as single object.
3. To return the group to individual movable objects, select the group and then click Ungroup on the Diagram menu.
Enhance Your Data Model
Chapter 2: Basic Concepts and Features 39
Drawing Objects
You can enhance a model by using the Drawing toolbar to create the following objects: ■ Rectangle
■ Rounded Rectangle ■ Ellipse
■ Pentagon ■ Hexagon ■ Octagon ■ Triangle ■ Down Triangle ■ Left Triangle ■ Right Triangle ■ Diamond ■ Parallelogram ■ Star
■ Cross ■ Line ■ Connector
When you create a drawing object an annotation area is included for you to include any annotations within the object. Double-click the drawing object to open the Shape Editor and define its properties.
Add Drawing Objects to a Data Model
You can add drawing objects to a data model to enhance it or to provide meaningful annotations.
To add drawing objects to a data model
1. Open the model to which you want to add a drawing object. Click the shape icon on the Drawing toolbar, and draw the shape around one or more entities.
The shape is drawn around the chosen objects.
2. Click the drop-down arrow of the Background Color tool on the Formatting toolbar.
40 Implementation Guide
3. Choose any color to apply to the background of the shape. The color is applied to the background of the selected objects.
4. Double-click on a drawing object you created. The Shape Editor opens.
Enhance Your Data Model
Chapter 2: Basic Concepts and Features 41
6. Click Close.
7. Click the Text Color button on the Formatting toolbar and select a color for the text.
You can see the annotation in the drawing object with the annotation text color applied.
The following is an example of how you can use drawing objects to enhance your data model:
8. Click Save on the File menu. Your work is saved.
42 Implementation Guide
Print a Model
You can print your model to your default printer. Before you print, you can customize options for the printed output.
To print a model
1. Click Print on the File menu. The Print dialog opens.
2. Select from the following options on the Print dialog: Printer
Specifies the destination printer. Select a printer name from the drop-down menu. Select Print to file to save the print output to a file instead of a printer. Print range
Print all pages of the model, or a range of pages. Copies
Prints one or more copies of each selected page. You can also select to collate the copies.
Print what
Print the current diagram (the open diagram from which you opened the print dialog), or current selection or all diagrams currently open.
Print order
Specifies the direction taken for the print output. For example, if you have a large model that prints on multiple pages, you can select "Over, then down" to create a printout with a horizontal orientation. Or, select "Down, then over" to create a printout with a vertical orientation.
3. Click Preview to view your output page by page, before starting the print job. Note: The page preview that is displayed takes into account the page margins that you set in the Page Setup Editor. This means that what you see in the Preview page is what will be printed.
Click Zoom In to zoom the diagram to the size of the paper. Click Zoom Out to zoom the diagram to a size that can be fit in the Preview window.
To print immediately, click Print; otherwise click Close to go back to the Print dialog. 4. Click Page Setup (see page 43) to customize print options such as page size,
orientation, zoom, border, color, header, footer, and margin. 5. Click Print to print the model to the specified printer.
Print a Model
Chapter 2: Basic Concepts and Features 43
Specify General Page Setup Options
The Page Setup Editor gives you access to formatting options for printing such as page size, orientation, zoom level, borders, colors, headers, footers, and margins.
Note: When you choose to print all diagrams, the page settings in the Page Setup Editor always take precedence over the page settings of the diagrams.
To set the page settings for printing a model
1. Click Page Setup on the File menu. You can also select Page Setup to edit the page settings from within the Print dialog.
The Page Setup Editor opens.
2. Click the General tab and work with the following options:
Page Size
Specifies the page size for the print job. Select a page size from the drop-down menu.
Note: The page type you specify must be supported by a paper type available at your printer. For example, if you specify A4 as the page size, you must have A4 paper loaded in your printer for the print job to complete.
Orientation
Specifies the page orientation. Select Portrait or Landscape from the drop-down menu.
Zoom Level
Specifies the zoom level used in the printout. Enter a number in the text box or click the arrow to increase or decrease the zoom level.
Print Border
Specifies to print the diagram with a border.
Print In Color
Specifies to print the diagram using color. Clear the check box to print in black and white, even if color choices were made in the diagram.
3. Click the Margins tab and work with the following options:
Header/Footer
Specifies elements that appear in the header and footer of your printout. Click in the text box, then click an item on the Header/Footer toolbar to add an element. See Add a Page Header or Footer (see page 45) for more information about setting the header and footer.
44 Implementation Guide
Specifies the margin (in inches) for the top, left, right, bottom, header, and footer margins.
4. (Optional) Select the Keep synchronized with current diagram check box to ensure that the page settings in the Page Setup dialog and that of the diagram remain in sync whenever changes are made.
5. (Optional) Click Load from Diagram to retrieve the page settings from the diagram. Click Save to Diagram to save the page settings to the diagram.
6. Click Close.
Save Your Page Setup Selections
You can save your page setup selections with your diagram and recall them the next time you print your model.
To save your page setup selections
1. Click Print on the File menu to open the Print dialog. 2. Click the Page Setup button.
The Page Setup Editor opens.
3. Select options for printing, then click Save to Diagram.
Your selections are saved with the diagram. Click the Load from Diagram button to recall your saved settings, or refresh the editor with your saved settings.
Print a Model
Chapter 2: Basic Concepts and Features 45
Change Page Margins for Printing
By default, the entire page is used for printing. Before you print, you can set separate page margins for the current diagram.
To change the page margins
1. Click Page Setup on the File menu. The Page Setup Editor opens.
2. Click the Margins tab and enter a new value (in inches) in any of the margin text boxes:
■ Top Margin ■ Header Margin ■ Left Margin ■ Right Margin ■ Footer Margin ■ Bottom Margin
Note: To enter a fraction, place the cursor after the decimal point and enter the decimal equivalent.
3. Click Close to save your settings, or Cancel to cancel your selections.
Add a Page Header or Footer
You can add a customized header or footer (or both) to all the pages when you print a model. For example, you can print the Model Name, Subject Area Name, and Diagram Name at the top of every page, and the page number, date, and time at the bottom of every page.
Note: If you manually enter incremental information in the Header or Footer text box (for example, page number, date, and so on), you cannot automatically update the text.
46 Implementation Guide
A toolbar is provided to make it easy for you to quickly add the following elements:
■ Current Page ■ Page Count ■ File Name
■ Subject Area Name ■ Diagram Name ■ Time
■ Date
To add a page header or footer 1. Click Page Setup on the File menu.
The Page Setup Editor opens.
2. Click the Margins tab and work with the following options in the Header or Footer text box:
■ Click in the Header or Footer text box to specify in which area you want to insert the customized text.
■ Click the appropriate Header/Footer button to automatically insert
information, or use the keyboard to insert other information (for example, your name).
A preview of your selection displays beneath the text box.
For example, if you selected file name and E/R diagram for the header, and date and time for the footer, then the preview would be as follows:
Print a Model
Chapter 2: Basic Concepts and Features 47
3. Work with the following related options in the editor:
■ Indicate page margins (in inches) for the header or footer.
■ Select the "Keep synchronized with Current Diagram" check box to associate your selections with the current diagram.
■ Click the Load from Diagram button to reset any changed settings to the settings last saved to the diagram.
■ Click the Save to Diagram button to save the current selections with the diagram for future use.
4. Click Close to save your settings, or Cancel to cancel your selections.
Set Print Defaults at the Diagram Level
You can set print defaults at the diagram level in the Page Setup and Page Setup Margins tabs in the Diagram Editor. Your settings populate the options displayed on the General and Margins tab in the Page Setup Editor that you can open from the Print dialog.
To set print defaults at the diagram level 1. Click Diagrams on the Diagram menu.
Note: You can also open the ER Diagram Editor from a shortcut menu when you right-click a blank area in the workplace, or from the object name in the Model Explorer.
The ER Diagram Editor opens.
2. Click the Page Setup tab to change formatting options for printing, such as page size, orientation, zoom level, borders, and colors.
3. Click the Page Setup Margins tab to change formatting options for headers, footers, and margins.
Chapter 3: Understanding the Workplace 49
Chapter 3: Understanding the Workplace
This section contains the following topics: Toolbars (see page 49)
Workplace Panes (see page 55) Property Editors (see page 84)
Toolbars
There are many task-oriented toolbars that help you quickly perform popular tasks. When you pass your cursor over the toolbar button, a brief description of the button (tooltip) appears. When you click the toolbar button, the appropriate dialog opens or the task is performed.
All of the toolbars are dockable; this means that you can drag them to any location in the workplace and they dock along the edge of the window. Alternatively, you can let them float freely in the window if you prefer.
Depending on your preferences, all of the toolbars can be shown or hidden. On the View menu, the Toolbars option lists all of the toolbars. Select a toolbar to make it visible or hide it in the workplace. In the following example, all toolbars are selected and will display in the workplace:
50 Implementation Guide
Alignment Toolbar
The appearance of your data model is important to you and the others who use it. There are many features that help you enhance the appearance of your model. You may already be familiar with some of the automatic layout features that help you arrange objects in your diagram.
A toolbar is provided that can help you quickly align the object boxes along the top, bottom, or sides of the boxes.
The tools on the Alignment Toolbar help you quickly arrange model objects.
You can select multiple diagram objects, and space them to your preference.
Display Toolbar
Use the Display toolbar to dynamically change the object display levels in your diagram. You can also specify whether to display the logical or physical model, or select a subject area to view.
Toolbars
Chapter 3: Understanding the Workplace 51
Options include: ■ Table display level ■ Primary key display level ■ Column display level ■ Keys display level ■ Definition display level ■ Subject area selector ■ Logical/Physical selector
Database Toolbar
All of the database tasks you can perform in your model are conveniently located on the Database toolbar. Available options depend on whether you are working in a logical or physical model.
Options include:
■ Forward engineer schema generation (physical model only) ■ Reverse engineer from script or database
■ Complete Compare
■ Target database (physical model only)
■ Forward engineer check model (physical model only)
Drawing Toolbar
You can enhance a model using the Drawing toolbar to create different drawing objects. The tools work like many other popular point-and-click drawing applications. Just click a tool, click in the diagram window, and drag the mouse until the object is the right size.
52 Implementation Guide
Formatting Toolbar
You can use the Formatting toolbar to change the font or color of objects on the Diagram Window. The toolbar lists all the fonts that are available on your workstation. It also has separate buttons to modify the color of the text, object, and outline color. One of the benefits of this toolbar is that you can use the options to quickly apply formatting to individual attributes without having to add another theme, or alter an existing theme.
Options include: ■ Font style ■ Font size ■ Bold text ■ Italic text ■ Underline text ■ Strikethrough text ■ Text color
■ Background color ■ Line/outline color ■ Line weight ■ Line pattern ■ Line ends
Layout Toolbar
Use the Layout toolbar to arrange the layout of your diagram, redraw relationship lines, or reset sizing.
Toolbars
Chapter 3: Understanding the Workplace 53
Options include: ■ Circular ■ Hierarchical ■ Orthogonal ■ Symmetric ■ Tree
■ Reset relationship paths ■ Reset object sizing
Model Manager Toolbar
The CA ERwin Model Manager toolbar lets you perform administrative and
workgroup-related tasks in the CA ERwin Data Modeler Workgroup Edition (CA ERwin WE). A description of each toolbar button displays when you pause your cursor over it. Note: Options on the toolbar become active only after you make a connection to the mart.
Options include:
■ Open a model in the mart ■ Save a model to the mart ■ Lock/Unlock a model in the mart
■ Open the Library Manager to manage mart libraries ■ Open the Submodel Manager to manage mart submodels ■ Merge a CA ERwin Data Modeler model in the mart ■ Refresh a model in the mart
■ Review changes against a mart
■ Open the Version Manager to display model differences ■ Connect to a mart
54 Implementation Guide
The ERwin Toolbox
The toolbox is the primary set of tools for drawing and editing a data model. In the Toolbox, use the Select tool to move objects and resize entity and table boxes. The cursor changes shape for each task so that you know what action is performed.
You have the option to resize any box to meet your presentation requirements. For example, you may want all of the entity, table, or view boxes to be uniform in size, or emphasize one or two boxes by making them larger than the others.
The toolbox changes based on the model type (logical or physical) and the notation (IDEF1X, IE, or DM).
For more information about the IDEF1X, IE, and DM notation, see the online help.
The Standard Toolbar
The Standard toolbar is located near the top of the diagram window, and contains a group of buttons that you can use to perform common tasks. Each toolbar button is a shortcut you can use instead of selecting a menu option. The availability of the toolbar varies, depending on the object you have selected and whether you are working on the logical or physical model.
When you pass your cursor over a toolbar button, you will see a brief description of the button. When you click it, the appropriate dialog opens or the task is performed automatically.
Transformations Toolbar
The Transformations toolbar lets you manage transformations of Supertype Subtype Identity and Many-to-Many relationships, vertical and horizontal partitioning, and two table roll up and roll down.
Workplace Panes
Chapter 3: Understanding the Workplace 55
Options include: ■ Many-to-Many
■ Supertype/Subtype Identity ■ Supertype/Subtype roll up ■ Supertype/Subtype roll down ■ Vertical partition
■ Horizontal partition ■ Two table roll down ■ Two table roll up
■ Resolve all transformations
Zoom Toolbar
Use the Zoom toolbar to manage zoom levels in your diagram.
Options include: ■ Zoom out ■ Zoom in ■ Zoom normal ■ Fit model ■ Fit selection
Workplace Panes
Each of the following panes within the workplace is dockable and floatable, and where applicable, contains its own toolbar:
■ Explorer Pane (Model Explorer) ■ Action Log Pane
■ Advisories Pane ■ Overview Pane ■ Bulk Editor Pane
56 Implementation Guide
Each pane provides two options for how it displays: Auto Hide
Activates auto hide. The pane becomes a tab in the application. When auto hide is activated, the pane is not visible in the workplace unless you hover your mouse over the tab of the hidden pane. When you do this, the pane is temporarily restored to allow you to work in the pane. When your mouse leaves the pane, it becomes auto-hidden once again. To turn off auto hide, mouse over the tab to restore the pane, and then click the pushpin .
Close
Closes the pane. To open the pane again, select the appropriate pane on the View, Windows menu.
Pane grouping functionality is provided to assist you with arranging panes in the workplace. Dockable panes can dock to other dockable panes so that they combine to create multiple tabs in a single dockable pane, or pane group. Similarly, tabs on dockable panes can be undocked / ungrouped and floated or docked to the top level frame window as individual dockable panes. When two or more panes are docked together in a tab group, the tab selection interface displays at the bottom. When panes are not grouped, the tab selection interface is not shown. When tabs are grouped, the title bar on top of the pane changes to the title bar of the currently active tab.
To dock panes together into a pane group, simply drag and drop one pane over another. To undock, drag the tab of the pane you want to undock and drop it in the workplace.
Workplace Panes
Chapter 3: Understanding the Workplace 57
Model Explorer
The Model Explorer provides an organized, hierarchical, text-based view of your data model and its contents. It provides an easy method for creating objects. The Model Explorer lets you to create, display, navigate, and modify your model using the Model or Subject Area view.
The Model Explorer has two panes, Model and Subject Area. You can switch to a different pane by clicking the tab at the bottom of the Model Explorer:
All of the objects in your model are listed in the Model Explorer, but display differently based on which pane is active.
■ The Model pane includes every object in your model including subject areas and domains. This is the default view.
■ The Subject Areas pane displays model objects sorted by subject area.
Dynamic Changes
Just as you can work on a graphical view of a model in the Diagram Window, you can perform the same tasks from the Model Explorer using a text-based view of a model. When you make changes to an object in the Model Explorer, the graphical view of the model is immediately updated with the same change.
58 Implementation Guide
For example, if you rename a table in the Model Explorer, the new table name replaces the existing table name in the Diagram Window and the relevant editors. Similarly, if you make a change to the diagram or in an editor, you immediately see the change in the Model Explorer.
The Model Explorer Tasks
In addition to navigating, the Model Explorer provides a whole range of useful features that help you easily create and modify your data model such as:
■ Create new objects
■ Go to objects in the Diagram Window
■ Open editors to view or change object properties ■ Delete objects
■ Rename objects
Note: To work with the Model Explorer, click Explorer Pane on the View, Windows menu, to open the Model Explorer.
The Model Explorer Shortcut Menu
When you right-click on an object in the Model Explorer, a shortcut menu displays that lists the options available for that object, similar to the following example:
To control the topological display of Domains, right-click on a Domain and select how you want to sort the Domains.
You can also delete an object or invoke the property editor for the object. If semantics do not allow the deletion of an object (such as a Primary Key object), then the Delete menu item on the shortcut menu does not appear.
If you want to create a new object, and additional information is required to complete the creation of that object (such as a Relationship), a dialog box appears in which you must enter the information required.
Workplace Panes
Chapter 3: Understanding the Workplace 59
The Model Explorer Toolbar
The Model Explorer contains a toolbar to help you navigate your object editing, launch property editors, delete objects, and invoke online help.
New Objects
Just as you can create a new entity, table, or relationship using the Toolbox, you can quickly create a new object in the Model Explorer.
To create a new object, right-click on any object and choose New from the shortcut menu. For some objects, such as a domain, you can drag the object from the Model Explorer onto the Diagram Window to create a new attribute or column.
Rename Objects
Every object in your model is represented in the Model Explorer by its name. Just as you can rename an object using on-diagram editing in the Diagram Window, you can rename an object directly in the Model Explorer.
To rename objects
1. Click the object name, and then click again. An edit box opens around the object name. 2. Enter the new object name directly in the edit box.
The new name of that object appears throughout the Model Explorer and the model.
Note: Any unique name rules that you select for your model are enforced when you rename an object in the Model Explorer.