(NGI).
Printed by Ridderprint, RIDDERKERK
PROEFSCHRIFT
ter verkrijging van
de graad van Doctor aan de Universiteit Leiden,
op gezag van Rector Magnificus Prof. mr. P.F. van der Heijden, volgens besluit van het College voor Promoties
te verdedigen op donderdag 24 november 2011 klokke 16.15 uur
door
Yanju Zhang
Promotor: Prof. dr. J.N. Kok
Co-promotor: Dr. Ir. F.J. Verbeek
Overige Leden
Prof. dr H.P. Spaink Leiden University Prof. dr. A.P.J.M Siebes Utrecht University
Chapter 2: Screen of MicroRNA Targets in Zebrafish Using Heterogeneous Data Sources:
A Case Study for Dre-miR-10 and Dre-miR-196 . . . 25
Chapter 3: miRNA Target Prediction through Mining of miRNA Relationships . . . 45
Chapter 4: Comparison and Integration of Target Prediction Algorithms for microRNA Studies . . . 73
GENE ANNOTATION Chapter 5: Identification of Common Carp Innate Immune Genes with Whole-Genome Sequencing and RNA-Seq Data . . . 93
CONCULUSIONS Chapter 6: Conclusions . . . 115
APPENDICES Summary . . . 123
Samenvatting . . . 129
List of publications . . . 135
Curriculum Vitae . . . 137
1
General introduction
This thesis is the collection of four published papers demonstrating annotation of genes
and microRNAs with the aid of bioinformatics, in particular using heterogeneous data
integration. In this thesis, the research objects are genes and microRNAs. Genes are
re-gions of DNA that can be transcribed to messenger RNA and later on translated to proteins
which are the chief actors within the cell. MicroRNAs (miRNAs) are recently discovered
very short messenger RNAs which are transcribed from DNA sequences. Instead of being
further translated, these short RNAs bind to messenger RNAs, and thus inhibit their target
expression. The main goal of this thesis is to efficiently and accurately annotate
miR-NAs and coding region of a novel genome. To achieve these goals, we developed several
complex workflows which integrate the current data sources and tools together.
Chap-ter 2, 3 and 4 are about miRNA annotation, while in ChapChap-ter 5 we demonstrate genome
annotation of the common carp.
The purpose of the introduction is to provide the general background of the subjects that
were studied, motivations and applied methodologies and to make the connections
be-tween chapters explicit. First, the key concepts of this thesis, which are integration and
annotation, are explained in Section 2 and 3. Subsequently, the biological background of
the research objects is introduced in Section 4 followed by the general analysis of miRNA
and carp genome annotation. The final section is an overview of the thesis.
2
Methodology: integration
Life science is a research field that elucidates the complicated and delicate biological
mechanisms of living organisms. With the development of high-throughput
technolo-gies, a huge amount of system-wide biological data, e.g. genomic, transcriptomics and
proteomics are produced. The capability of generating multi-omic datasets brings new
challenges to Bioinformatics.
Bioinformatics is a rapidly developing area that applies computational approaches to
solve biological problems. Basically, it is an interdisplinary science that utilizes
com-puters to store and process biological data and develops and applies statistics, algorithms
rently, the huge amounts of heterogeneous data in life science are generated at relatively
high speed by different organizations all over the world. It is more and more frequently
required to correlate and combine the heterogeneous information as the volume and the
need to share data explodes. The essence of integration is not to produce even more data
by combining different data sources or types but to increase the sensitivity and/or
speci-ficity of the algorithm and system.
Data integration can be achieved by two methods: management and analysis. From the
management point of view, heterogeneous data integration is the process of the
standard-ization of data definitions and structures by using a common conceptual schema across a
collection of data sources [12, 19]. This leads to the development of common databases,
warehouses, software, platforms and systems that retrieve data from different sources and
provide a unified view. One example is the National Center for Biotechnology
Informa-tion (NCBI) database which is a U.S. government-funded naInforma-tional resource for molecular
biology. This database provides information such as genomics, proteomics,
bioinformat-ics tools and literature for researchers. The topic of management will not be addressed
specially in this thesis.
In terms of analysis, integration correlates and combines data from several experiments
and databases in an effort to extract better and more significant information than the means
of a single source. This technique is widely applied in data-driven bioinformatics which
requests to build a model or analysis after the data has been generated. Integration brings
new insights from multi-dimensional data and therefore improves our understanding of the
research. Using integration for heterogeneous data analysis is the general theme though
this thesis.
In general, data can be integrated from two ends, low level and high level. Low-level
inte-gration refers to the analysis dealing with multi-factorial raw data directly. One example
Figure 1: Definitions of true positive (TP), false positive (FP), false negative (FN) and true negative (TN) in binary classification. Positive (p) and negative (n) are the two classes, and p’ and n’ are the prediction outcomes. A true positive occurs when a positive instance is predicted as positive; however if the actual value is negative and prediction is positive, then it is called a false positive. False negative and true negative can be defined in a similar way.
data. High-level integration, on the other hand, means to integrate multiple same-type
results from different studies [18]. For example, in the pathway analysis, the significant
pathways derived from different approaches might not be identical. In this case, it will be
interesting to integrate the results from different methods to arrive at some consensus that
is more reliable than any of the individual results.
Whatever levels the data are integrated on, they can be integrated in either a sequential or
a parallel fashion. In the sequential approach, each type of data can be used as a filter.
In the analysis of differentially expressed genes in microarrays, possible candidates are
first selected through statistical analysis. After that, Gene Ontology or pathway
informa-tion can serve as an enrichment dataset to further screen differentially expressed genes.
In the parallel approach, different raw data are treated as features or measurements and
integrated by machine learning algorithms to build models with the final goal of finding
patterns, trends and anomalies.
Integration will lead to the improvement of sensitivity and/or specificity which are the
two measurements of system performance. Sensitivity, also known as the true positive
rate, is defined as the ratio of actual positives which are correctly identified; specificity
measures the probability that the negatives are correctly identified. In the case of two
classes classification, as shown in Fig. 1, sensitivity and specificity are defined as equation
1 and 2 respectively.
Sensitivity= T P
sitivity will sacrifice specificity by increasing its false positive rate and vice versa.
Many high-throughput methods sacrifice specificity for scale. Microarray is the technique
which can monitor the expression patterns of thousands of genes simultaneously.
Mi-croarray analysis can predict gene function by assessing coexpression relationships in a
high throughput fashion. Although gene coexpression data are an excellent tool for
hy-pothesis generation, microarray data alone often lack the degree of specificity needed for
accurate gene function prediction.
In some cases, sensitivity is sacrificed for accuracy. In epidemiologic studies, accurately
diagnosing the disease of a patient outweighs finding all the potential patients. Therefore
high specificity tools are the key for accurate disease diagnoses which have great impact
on the consequent treatment; For the purpose of validation, specificity of an algorithm
outweighs its sensitivity. When high-throughput biological validation is not available,
only a few highly ranked candidates will be selected for testing in priority.
The cutoff for sensitivity and specificity are arbitrary decisions. Users can decide the
cutoff to achieve a higher sensitivity or specificity according to their own requirements.
Integration normally is not a straightforward process. Multiple steps will be involved
according to the heterogeneity of the data. Usually an integration strategy is represented
by a workflow which is the depiction of a sequence of operations. Each operation is a
model and the workflow is the collection of these models processed in a desirable order.
Using workflow, the process is repeatable, therefore the same type of heterogeneous data
can be integrated in the same manner. The development of workflows is faciliated by the
tools such as Taverna [24]. It is a workflow management system allows bioinformaticans
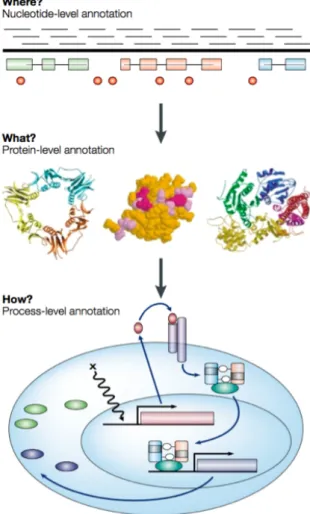
Figure 2: Three layers of genome annotation. Nucleotide-level annotation aims for identi-fying the physical map of the functional units. Protein-level annotation aims for identiidenti-fying 3D protein configurations and protein-protein interactions. Process-level annotation aims for identifying the biological processes which the functional units are involved in. -Lincoln Stein. Genome annotation from sequence to biology. 2001.
3
Goal: annotation
’Genome annotation is the process of taking the raw DNA sequence and adding the layers
of analysis and interpretation necessary to extract its biological significance and place it
into the context of our understanding.’
-Lincoln Stein. Genome annotation from sequence to biology. 2001.
Annotation is an important and necessary analysis which bridges the gap between
biologi-cal sequence and the biology of the organism. During the past decade, only a few genomes
Caenorhabdi-gene finding, i.e. to determine structures for the protein coding Caenorhabdi-genes. In prokaryotes,
gene finding is comparatively easy since most of the genome is comprised by the coding
region. However in eukaryotes, the case is more complicated. Firstly, the genome size is
relatively big. Secondly, less than 25% of the genome is a coding region [31]. And thirdly,
splicing and alternative splicing events take place during transcription. All these factors
complicate the gene finding. One branch of algorithms predicts gene structures using
a data mining strategy which trains a model with currently available genes and predicts
structures for the novel sequences. Another branch is the homolog gene prediction that
derives a complete gene model according to the sequence similarities of other species.
The sequence alignment tool BLASTX [20] can be used for this purpose. Due to the
complexity of gene structures, the current trend in gene prediction is the combination of
the above-mentionedab initioand comparative methods.
On the protein level, the main goal is to detect protein structures and protein
interac-tions. Proteins are the essential functional units within a cell. They comprise sequences
of amino acids folded in 3D structures carrying specified information encoded in the gene.
Most cellular processes are carried out by protein-protein interactions, such as forming a
complex or signal transduction. In practice, protein structures can be predicted by
search-ing for similarities ussearch-ing BLASTP against several protein sequences databases such as
SWISS-PROT [3], or by searching against functional domain databases such as PFAM
[7]. Protein-protein interactions can be simulated using protein docking tools such as
STRING [32].
The last and most challenging part of the annotation is called functional annotation, the
process in which the genes and proteins are linked to different biological processes, e.g.
cell cycles and apoptosis. At process-level annotation, the Gene Ontology (GO) [11] and
pathway database are the main resources. GO is a standardized vocabulary for describing
and cellular components. Pathway databases such as KEGG [14] and BioCarta [23] are
widely utilized at this stage.
4
Biological Background
In our studies, functional annotation of miRNA is mostly performed on zebrafish and
human data. The zebrafish, which is small in size, easily cultured and has transparent
embryos, is a model organism used in molecular genetics and developmental biology. As
for human, many studies have been performed and databases on human biology are the
most complete.
De novogenome assembly and annotation are applied to the common carp. The common
carp is becoming a serious candidate model organism for very high throughput screens of
pharmaceutical compound libraries and we have been participating in a recently initialized
common carp genome project. In this section, a brief introduction of miRNA and key
components in a genome project will be given.
4.1 MicroRNAs
For a long time, researches have been working on unraveling the function of DNA coding
sequences which are responsible for the expression of proteins, the functional units in
the cell. The scientists also wonder why the non-coding sequences, sometimes called
’junk DNA’ (since no known biological function was previously found in this region),
are conserved through evolutionary selection. New light was shed on this problem. In
1993 the first miRNA lin-4 was identified in the ’junk DNA’ ofC. Elegans[15]. It was
found that lin-4 encodes a 22-nucleotide non-coding RNA that negatively regulates the
expression of the lin-14 gene in a temporal control of post-embryonic development [1].
In 2000, another non-coding RNA let-7 was discovered [26]. Since then, an abundant
amount of these gene regulators have been identified in a variety of plants, animals and
viruses. The discovery of miRNAs revealed a new mechanism of gene regulation and
inspired a series of molecular and biochemical studies in this area.
Mature miRNAs are ∼22 nucleotide single-stranded noncoding RNA molecules. They
Figure 3: Simplified illustration of miRNA biogenesis and function. miRNA genes are first transcribed to pre-miRNA, and then processed to mature miRNAs. Upon binding to these miRNAs through sequence complementarity, the messenger RNAs (mRNAs), which are called the targets of miRNAs, will be either degraded or the translation of the targets will be inhibited.
are illustrated in Fig. 3. For reasons of simplification the auxiliary protein complexes are
not included in the picture. First, a miRNA gene is transcribed to primary miRNA
tran-scripts, which are between a few hundred or a few thousand base pairs long. Subsequently,
this primary miRNA is processed into hairpin precursors, called pre-miRNA, which have
a length of approximately 70 nucleotides, by the protein complex consisting of the
nu-clease Drosha and the double-stranded RNA binding protein Pasha. The pre-miRNA is
then transported to cytoplasm and cut into small RNA duplexes of approximately 22
nu-cleotides by the endonuclease Dicer. Finally, either the sense strand or antisense strand
functioning as a template gives rise to mature miRNA. Upon binding to the active RISC
complex, mature miRNAs interact with the target mRNA molecules through base pair
complementarity, therefore inhibit translation or sometimes induce mRNA degradation
[6].
The main functional characterization method of miRNAs is based on the loss-of-function
mutation of miRNA genes. Using this technique, fly miR-14 was identified as an inhibitor
the miR-34 family was discovered in the p53 pathway in which p53 genes are tumor
suppressors [5]. Many studies suggest that a miRNA can have the capacity of regulating
hundreds of genes and in total miRNAs could regulate about 30% of the gene expression
in humans [16].
The miRNAs are also found to be involved in the pathogenesis of infectious diseases
and cancer. It was discovered that miR-107 is associated with Alzheimer’s disease [33];
miR-133b is related to Parkinson’s disease; miR-1 plays a role in the development of
car-diovascular diseases [9]. These findings have resulted in miRNAs becoming drug target
candidates in many pharmaceutical research projects.
4.2 Genome project
The human genome project, initialized in 1993, released a draft and a complete genome
assembly in 2000 and 2003 respectively. These groundbreaking results showed that
sci-entists are capable of decoding the full set of DNA that make a human. Since then, many
genome projects of different species, such as zebrafish and mouse, have been initiated.
Aiming to determine the complete genome sequence of an organism, a genome project,
in general, consist of three stages: sequencing, assembly and annotation. The procedure
of sequencing and assembly are briefly explained in Fig. 4.
Genome sequencing is the process of determining the order of nucleotides over the whole
genome. In the 1970’s, most DNA sequencing was performed using the chain
termi-nation method, developed by Fred Sanger [27]. In the last couple of years, remarkable
technological innovations have emerged that allow the cost-effective sequencing of
com-plex samples at an unprecedented scale and speed [25]. These techniques are referred
to as next-generation sequencing or high-throughput sequencing since they are based on
principles different from the classical Sanger-based method (first generation). They can
produce thousands or millions of sequences at once with a fraction of the cost of
tradi-tional sequencing. The new sequencing platforms include Roche 454, Genome Analyzer
(Illumina/Solexa) and ABI-SOLiD (Applied Biosystems).
The development of next-generation sequencing technologies poses numerous
computa-tional challenges for bioinformatics. High speed and scale of data generation challenge
(a) Sequencing
(b) Assembly
Figure 4: Principle of sequencing and assembly. At the sequencing stage, as shown in (a), first DNA molecules are extracted and then sheared into short fragments. Later on adaptors are attached to one or both ends. With or without amplification, each fragment is then sequenced by the sequencer to obtain short sequences from one end or both ends resulting in single-end or paired-end reads. Genome assembly is the process that constructs the original continuous DNA sequences from millions of short DNA reads. The concepts are illustrated in (b). Contigs represent the contiguous pieces of DNA, while a scaffold refers to the joint contigs according to the pairing information
of the steps that is computationally extremely expensive, i.e. time, memory and CPU
consuming. It is a process of piecing millions or billions of short reads together to form
a set of continuous sequences (contigs) representing the DNA in the sample. Previously,
de novoassembly was achieved using overlapping computation strategies, while currently
thede Bruijn[22] graph representation is prevalent in assemblers. Some of the most
workbench [2], Curtain [28] and SOAPdenovo [17].
The analysis after a genome has been sequenced and assembled is genome annotation,
which refers to finding the protein coding genes and other functional units such as
miR-NAs, and then further attaching biological functions, biochemical functions and
expres-sion patterns to these elements. Annotation is the goal of this thesis and has been
intro-duced in Section 3.
5
Challenges in annotation of miRNAs and carp genome
5.1 Annotation of miRNAs
In the last few decades, 851 mature miRNAs in human and 233 in zebrafish have been
identified (miRBase http://microrna.sanger.ac.uk/). But due to lack of high throughput
experiments, functional studies have only touched upon a small fraction of miRNAs [8].
Thus, the main challenge in miRNA studies is to unravel the function of miRNAs. One
crucial aspect is to identify the targets with which they directly interact.
For most of the miRNAs, functional characterization can benefit from bioinformatics by
predicting miRNA target genes. In plants, miRNA target predictions have proven to be
straightforward because miRNAs bind to their targets by nearly perfect sequence
com-plementarity. In contrast in animals, the degree of sequence complementarity in
miRNA-target pairing can be flexible leaving the mechanism of how miRNAs interact with the
target unclear. Currently, bioinformatics prediction algorithms are built relying on rules
that are derived from a few known miRNA-target interactions. These rules are 1) high
sequence complementarity between 3’UTR of the target and miRNAs; 2) perfect match
between 3’UTR of the target and seed region of miRNAs, in which the seed region, also
called the nucleus, is the sequence from position 2 to position 8; 3) favorable structural
and thermodynamic formation between RNA-RNA duplexes; 4) evolutionary
conserva-tion of miRNA target sites.
Many public databases have been built to facilitate miRNA studies. miRBase [10] is
the integrated repository for the miRNAs as well as their predicted targets. TarBase
[29] records all the experimentally validated targets collected from the published
species. It is widely used in fish biology research [4]. A single female is capable of
producing up to a few hundred thousand eggs that can be efficiently fertilized in vitro,
which enables hundreds of thousands of pharmaceutical drug candidates to be tested with
a relatively small genetic diversity. Thus, common carp is a relevant model system for
high throughput screens of pharmaceutical compound libraries.
Currently, there are 32046 carp EST and 2136 carp nucleotide sequences recorded in
Genbank, but there is no carp genome assembly available. Using the next-generation
sequencing technology, we have generated a huge amount of sequence reads from the
carp genome and transcriptome with which we aim to identify all the carp genes. Since
zebrafish is evolutionarily close to the common carp (both are cyprinids) and the zebrafish
genome is relatively well covered and annotated in the Ensembl database, we used the
zebrafish genome to facilitate the annotation of the carp genes.
We currently focus on discovering the carp genes involved of the innate immune response
as a pilot study. The innate immune system is the first line of defense against infectious
diseases and cancer by identifying and killing pathogens and detrimental cells.
Under-standing of the gene structures and their expressions will benefit the testing of hundreds
of thousands of pharmaceutical drug candidates.
6
Structure of the thesis
This thesis is composed of two parts categorized by the research objects. In Chapter 2, 3
and 4, we focus on the functional annotation of miRNAs via target predictions. While in
Chapter 5, we will describe the aspects ofde novogenome assembly and annotation for a
new candidate model system, the common carp.
In Chapter 2, we focus on the discovery of miRNA targets in zebrash. An integrative
and their targets with the nal purpose of extracting high condent targets from the target
pool predicted by miRanda. This is achieved by using techniques ranging from statistical
tests to clustering and association rules. In this chapter, we found that validated targets
do not necessarily associate with the highest sequence matching scores. Besides, for
some miRNA families, the frequency of their predicted targets is signicantly higher in the
genomic region close to their own physical location. Finally, in a case study of
dre-miR-10 and dre-miR-196, it was found that seven candidate target genes, all of which belong
to hox gene family, have similar characteristics as validated target genes and therefore
represent high confidence target candidates.
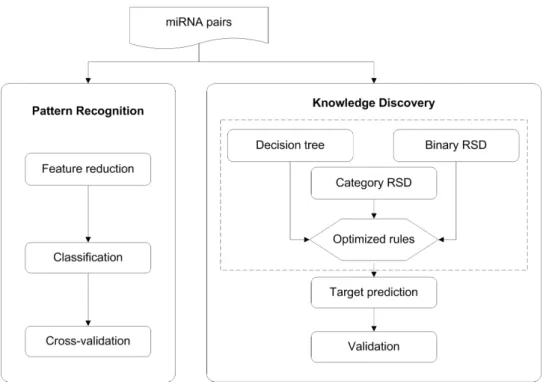
In Chapter 3, we present an approach that analyzes miRNA-miRNA relationships and
utilizes them for target predictions in human. We have developed a pipeline which
inte-grates machine learning techniques to reveal the feature patterns between known miRNAs.
Different data setups are evaluated and compared to achieve the best performance.
Fur-thermore, the derived rules are applied to miRNAs of which the targets are not yet known
so as to see if new targets could be predicted. Our method contributes to the improvement
of target identification by predicting targets with high specificity and without
conserva-tion limitaconserva-tions.In the analysis of funcconserva-tionally similar miRNAs, we found that genomic
distance and seed similarity between miRNAs are dominant features in the description of
a group of miRNAs binding the same target. Application of one specific rule resulted in
the prediction of targets for several unannotated miRNAs. Some of these targets were also
detected by the existing methods.
In Chapter 4, we evaluate the performance of different target prediction algorithms and
use integration methods to improve prediction accuracy. Both high-level integration
ap-proaches, e.g. algorithm combinations and ranking aggregation, and low-level integration
approaches, e.g. a Bayesian Network classification, are performed. All of the
meth-ods are tested on miRNA-target interactions that are experimentally validated and several
compiled negative control data sets. The results reveal that each individual prediction
al-gorithm has its own advantages, as was shown using different test datasets. Moreover, we
inspected on the characteristics of miRNA-target site interactions and discovered a novel
feature: i.e. miRNAs have binding preference at the end of the 3’ UTR sequence of their
target. Finally, we concluded that among different integration strategies, the application
and an annotation pipeline with the final aim of identifying immune response genes,
espe-cially Toll/Interleukin-1 receptor (TIR) domain-containing genes, using next generation
sequencing data. The genome assembly pipeline consists of data cleaning, pre-assembly
and assembly using CLCBio, ABySS and SOAPdenovo. A basic annotation pipeline
of these low coverage genomes is obtained by using simple gene prediction based on
protein-based gene model prediction as well as comparative annotation to other genomes
which is a prediction of ortholog with respect to zebrafish. The preliminary assembly was
achieved with an N50 contig length of 2260 bp and from our data it is estimated that the
carp genome is about 1.23 Gbp. Compared to zebrafish immuno genes, we estimated that
there are 39 TIR domain-containing genes and transcripts in the common carp.
In Chapter 6, the techniques used in the previous chapters will be summarized. Moreover,
the lessons we learned from the studies will be discussed.
References
[1] S. Bagga, J. Bracht, S. Hunter, K. Massirer, J. Holtz, R. Eachus, and A. E. Pasquinelli. Regulation by let-7 and lin-4 miRNAs results in target mRNA degrada-tion. Cell, 122(4):553–563, August 2005.
[2] CLC Bio. http://www.clcbio.com/.
[3] Brigitte Boeckmann, Amos Bairoch, Rolf Apweiler, Marie claude Blatter, Anne Es-treicher, Elisabeth Gasteiger, Maria J. Martin, Karine Michoud, Isabelle Phan, Rine Pilbout, and Michel Schneider. The swiss-prot protein knowledgebase and its sup-plement trembl in 2003. Nucleic Acids Res, 31:365–370, 2003.
[4] A. B. J. Bongers, M. Sukkel, G. Gort, J. Komen, and C. J. J. Richter. Develop-ment and use of genetically uniform strains of common carp in experiDevelop-mental animal research. Lab Anim, 32(4):349–363, 1998.
Anirban Maitra, and Joshua T. Mendell. Transactivation of miR-34a by p53 broadly influences gene expression and promotes apoptosis. Molecular cell, 26(5):745–752, June 2007.
[6] C. Z. Chen. MicroRNAs as oncogenes and tumor suppressors. N Engl J Med, 353(17):1768–1771, October 2005.
[7] Robert D. Finn, John Tate, Jaina Mistry, Penny C. Coggill, Stephen John Sam-mut, Hans rudolf Hotz, Goran Ceric, Kristoffer Forslund, Sean R. Eddy, Erik L. L. Sonnhammer, and Alex Bateman. The pfam protein families database.Nucleic Acids Res, 36:281–288, 2008.
[8] Dimos Gaidatzis, Erik van Nimwegen, Jean Hausser, and Mihaela Zavolan. Infer-ence of miRNA targets using evolutionary conservation and pathway analysis.BMC bioinformatics, 8:69+, March 2007.
[9] Michela Garofalo, Gerolama Condorelli, and Carlo Maria Croce. Micrornas in dis-eases and drug response. Current Opinion in Pharmacology, 8(5):661–667, 2008.
[10] Sam Griffiths-Jones, Russell J. Grocock, Stijn van Dongen, Alex Bateman, and An-ton J. Enright. mirbase: microrna sequences, targets and gene nomenclature.Nucleic Acids Research, 34(Database-Issue):140–144, 2006.
[11] C. J. Harris. The gene ontology (GO) database and informatics resource – gene ontology consortium 32 (supplement 1): 258 – nucleic acids research. Nucleic Acids Res., 1(32):D258–D261, January 2004.
[12] Dennis Heimbigner and Dennis Mcleod. A federated architecture for information management. ACM Trans. Inf. Syst., 3(3):253–278, July 1985.
[13] Robert J J. Johnston Jr and Oliver Hobert. A novel c. elegans zinc finger transcription factor, lsy-2, required for the cell type-specific expression of the lsy-6 microRNA. Development, November 2005.
[14] M. Kanehisa and S. Goto. KEGG: Kyoto encyclopedia of genes and genomes. Nu-cleic Acids Research, 28(1):27–30, January 2000.
[15] R. C. Lee, R. L. Feinbaum, and V. Ambros. The c. elegans heterochronic gene lin-4 encodes small rnas with antisense complementarity to lin-14. Cell, 75(5):843–854, December 1993.
[16] Benjamin P. Lewis, Christopher B. Burge, and David P. Bartel. Conserved seed pairing, often flanked by adenosines, indicates that thousands of human genes are microRNA targets. Cell, 120(1):15–20, January 2005.
13(1):81–90, January 2003.
[22] Eugene W Myers. The fragment assembly string graph. Bioinformatics, 21 Suppl 2:ii79–85, 2005.
[23] BioCarta Charting Pathways of Life. http://www.biocarta.com/genes/index.asp.
[24] Tom Oinn, Matthew Addis, Justin Ferris, Darren Marvin, Martin Senger, Mark Greenwood, Tim Carver, Kevin Glover, Matthew R. Pocock, Anil Wipat, and Peter Li. Taverna: a tool for the composition and enactment of bioinformatics workflows. Bioinformatics, 20(17):3045–3054, November 2004.
[25] Mihai Pop. Genome assembly reborn: recent computational challenges.Brief Bioin-form, 10(4):354–366, July 2009.
[26] Brenda J. Reinhart, Frank J. Slack, Michael Basson, Amy E. Pasquinelli, Jill C. Bettinger, Ann E. Rougvie, Robert H. Horvitz, and Gary Ruvkun. The 21-nucleotide let-7 rna regulates developmental timing in caenorhabditis elegans. Na-ture, 403(6772):901–906, February 2000.
[27] F. Sanger, S. Nicklen, and A. R. Coulson. DNA Sequencing with Chain-Terminating Inhibitors. PNAS, 74(12):5463–5467, 1977.
[28] Michael C. Schatz, Arthur L. Delcher, and Steven L. Salzberg. Assembly of large genomes using second-generation sequencing.Genome Research, 20(9):1165–1173, September 2010.
[29] Praveen Sethupathy, Benoit Corda, and Artemis G. Hatzigeorgiou. TarBase: A com-prehensive database of experimentally supported animal microRNA targets. RNA (New York, N.Y.), 12(2):192–197, December 2005.
[30] Jared T. Simpson, Kim Wong, Shaun D. Jackman, Jacqueline E. Schein, Steven J. Jones, and Inanc¸ Birol. ABySS: a parallel assembler for short read sequence data. Genome research, 19(6):1117–1123, June 2009.
[31] L. Stein. Genome annotation: from sequence to biology. 2:493–503+, 2001.
[33] Wang-Xia Wang, Bernard W Rajeev, Arnold J Stromberg, Na Ren, Guiliang Tang, Qingwei Huang, Isidore Rigoutsos, and Peter T Nelson. The expression of microrna mir-107 decreases early in alzheimers disease and may accelerate disease progres-sion through regulation of beta-site amyloid precursor protein-cleaving enzyme 1. Journal of Neuroscience, 28(5):1213–1223, 2008.
[34] P. Xu. The drosophila MicroRNA mir-14 suppresses cell death and is required for normal fat metabolism. Current Biology, 13(9):790–795, April 2003.
Dre-miR-10 and Dre-miR-196
Based on
Yanju Zhang, Joost M. Woltering, Fons J. Verbeek. (2007). Screen of MicroRNA Targets in Zebrafish Using Heterogeneous Data Sources: A Case Study for Dre-miR-10 and Dre-miR-196 Proceedings WASET, Bangkok. Also published at International Journal of
Summary
RNA (mRNA) translation or mediate mRNA degradation through sequence-specific base
pairing [18, 7]. Several miRNAs have been found to play an important role in life and
development. To name a few: miRNAs lin-4 and let-7 regulate developmental timing in
C. elegans[15, 20]; bantam and miR-14 are involved in the gene regulation of apoptosis inDrosophila[2]; miR-181 modulates hematopoietic lineage differentiation in mice [5]; miR-32 regulates primate foamy virus type 1 (PFV-1) proliferation in human [14].
MiRNAs function by binding to target sites in mRNAs and thereby preventing their
trans-lation or promoting their decay. In order to better understand the biological function of
miRNAs, it is of fundamental importance to identify miRNA targets. Identifying miRNA
targets in animals is not as straightforward as in plants. Computational approaches have
been successful in plants, where known target sites tend to be almost perfectly
comple-mentary to miRNAs [21, 28]. Whereas in animals, miRNA-target binding is loosely
com-plementary [19]. The inexact sequence match property has complicated computational
approaches for target site identification significantly.
Several computational high-throughput methods to predict miRNA targets have been
de-scribed [7, 25, 16, 3]. The miRanda algorithm is one of the frequently used methods. For
each miRNA, target genes are selected on the basis of three properties: sequence
comple-mentarity using a position-weighted local alignment algorithm, free energy of RNA-RNA
duplexes, and conservation of target sites in related genomes [7, 9].
This computational method introduces one crucial problem, i.e., too much noise. Most
likely, not all of the predicted targets for a miRNA represent true biological targets and
only a few of these have been confirmed either positive or negative. For example,
regard-ing lin-4 inC. elegans, 554 targets are predicted and to date only 2 are confirmed through laboratory experiments. Therefore, nowadays the challenge is to find an effective way to
filter out false positive predicted targets. Accurate target prediction and validation are still
Recently, as opposed to other computational methods like miRanda, a few bottom-up
approaches for high-throughput miRNA targets validation have been reported. Zhouet al. suggest that targets identified by multiple prediction algorithms would appear to be the
better candidates for verification [32]. Starket aldescribe an algorithm to screen targets according to sequence and free energy features shared by validated targets [26].
Unlike the above described methods, we explore a bottom-up approach which focuses on
selecting targets based on genomic location and physical association on the genome.
An integrative method is presented to analyze the relationships between miRNAs and
targets in order to extract high confident miRNA targets. The method consists of three
layers: data retrieval, data analysis and data visualization. A panel of algorithms such
as clustering and association rules are applied on different resources such as genomic
location information, physical association on the genome, Gene Ontology terms as well
as predicted sequence scores and p-values generated by miRanda algorithm.
Results from the analysis indicate that validated targets do not necessarily associate with
highest sequence matching. For some miRNA families, the relative frequency of predicted
targets is significantly higher in the genomic region surrounding their own location. The
method is illustrated in a case study using two zebrafish miRNA families: dre-miR-10
and dre-miR-196. Their currently known targets can be treated as control. Finally on the
basis of the method, we suggesthoxd13a,hoxd11a,hoxd10aandhoxc4aas high confident targets for dre-miR-10 andhoxa13a,hoxa9a,hoxc8afor dre-miR-196. Our approach is a prelude to large scale machine learning analysis for all miRNAs in zebrafish.
This chapter is structured as follows. In section 2, the material and components of the
approach are introduced. Section 3 describes the results which indicate the feasibility of
the method. Finally, in section 4, we conclude the results, discuss the advantages and
disadvantages of our approach and prospect for our future work.
2
Material and Methods
The workflow of the method is displayed in Fig. 1. In this section the components of our
MiRBaseis the repository for published miRNA sequence data, annotation and predicted gene targets [9, 8]. It consists of three parts:
• The miRBase Registry acts as an independent arbiter of miRNA gene nomenclature,
assigning names prior to publication of novel miRNA sequences.
• The miRBase Sequences is the primary online repository for miRNA sequence data
and annotation.
• The miRBase Targets is a comprehensive new database of predicted miRNA target
genes.
Gene Ontology (GO)provides structured, controlled vocabularies and classifications that cover several domains of molecular and cellular biology; these are freely available for the
community to annotate genes, gene products and sequences across all species [10]. All
the genes and gene products are described in a species-independent manner using three
descriptors namely biological process, cellular component and molecular function [1].
Ensemblis an information system to store, analyze, use and display genomic information. In addition to sequence information, Ensembl also incorporates other biological data such
as cross-species, synteny, genes, transcripts, proteins, supporting evidences, dot-plots,
protein domains and gene or protein families [12, 24].
2.2 Data retrieval
In general, there are three ways to create database access: using a public mirror database,
downloading individual database tables or files, and creating one’s own private mirror
[23]. We assemble all relevant information in a local database by three different ways
Figure 1: The workflow of the miRNA targets validation method. It consists of three stages: data retrieval, analysis and visualization.
Firstly, to access miRNAs and targets data, the sequence and target tables for zebrafish
in miRBase are downloaded. Secondly, as far as the genomic information is concerned,
it is retrieved from Ensembl public mirror database. In order to avoid consuming too
much time and space, the Ensembl data is accessed through the Ensembl Perl Application
Programming Interface (API). This API is a framework of applications for accessing or
storing data in the Ensembl databases. The great advantage of using the Ensembl API is
that it separates developers from the underlying structure and changes at a lower level.
Without deep knowledge of the schema of the database, information can be easily fetched
from database. Thirdly, the annotation is retrieved from Gene Ontology database which
through a global and a local distribution analysis.
Next, the high confident targets for dre-miR-10 and dre-miR-196 are predicted on the
basis of the found relationships. Moreover, the confident targets are validated by using
sequence matching score and p-value ranking, targets clustering as well as conservation
validation.
Global distribution analysis
We start with exploring the genomic distribution of all the targets for each miRNA family.
With the results we intend to answer whether all the targets are evenly distributed over all
the 25 chromosomes or more predicted targets are located in the same chromosomes as
their miRNAs.
To achieve this, firstly all the targets are mapped from mRNA level to gene level and the
genomic location is extracted from Ensembl. Subsequently, a t-test is used to compare
the difference between the average targets number over all chromosomes and that over
their miRNA located chromosomes. The alternate H1 hypothesis is defined as follow:
true difference in means between the number of target genes distributed on all zebrafish
chromosomes and that on their miRNA located chromosome is not equal to 0.
Local distribution analysis
For the well characterized hoxb8 and miR-196, it is known that the miRNA and target gene are physically located within each others close vicinity [31]. Therefore we
investi-gate whether this represents a more common theme for miRNA-target relationships, and
if there is a correlation between the genomic locations of predicted target genes and
Figure 2: Window size definition
targets.
For this purpose, the targets are mapped from transcripts to genes and the genomic
dis-tance between miRNAs and their targets are calculated. The disdis-tance is calculated by
genomic position subtraction when targets located on the same chromosomes as the
miR-NAs. For other targets, the distance is defined as infinity. Window size is defined as
physical distance each centered on the position of a specified miRNA as displayed in Fig.
2. Thus, we statistically analyze the numbers of targets in 50kb to 1000kb window size.
Moreover, to investigate the areas which contain more targets, Expected target number
(Etarget) and Relative Frequency (RF) are defined as follows.
Etarget[w] =Ngene[w]×
Nalltargets
Nallgenes
(1)
RF[w] = Ntarget[w]
Ngene[w]
(2)
Where[w]represents within window sizew; functionNobject gets the number of object;
Etarget[w]represents the number of target genes which are expected to be present in
win-doww. This is derived from the number of genes in windowwmultiplied by the
propor-tion of target genes and genomic genes. According to this definipropor-tion, the number of the
expected targets and that of the miRBase predicted targets in different windows for each
family are compared in order to detect in which region the predicted targets distributed
regularly.
Relative frequency in a specific window RF[w] is calculated using the number of
pre-dicted targets divided by the number of genes in the windoww. It enables us to compare
fre-At present, the accuracy of the miRanda algorithm predictions is unknown, whereas
mi-Randa offers several likely outputs as predictors for target genes i.e. the sequence match
score and the p-value. The match score represents the complementarity between miRNAs
and their targets. The p-value represents an estimated probability of the same miRNA
family hitting multiple transcripts for different species in an orthologous group [17].
In order to assess whether high sequence match score or low p-value are associated with
real targets, the predicted targets are sorted by either matching scores or p-values for each
miRNA family. Henceforth, we examine whether the known and the selected targets are
captured in the top 50 ranked lists. In general, the number of the predicted targets for
different miRNA families vary from 420 to 2016, therefore selecting 50 can cover 2.5%
to 12% of the predicted targets (cf. Section 4).
Clustering analysis
Since a specific family of miRNAs is likely to function in specific biological processes, it
is assumed that its targets also belong to functional gene groups.
Gene Ontology (GO) terms are standardized annotation for genes and gene products. Here
we apply association rules to cluster targets according to GO terms. Association rules
discovery technique (ARD) is a machine learning method that has been used to discover
associations among subsets of items in large transaction databases. This method detects
sets of elements that frequently co-occur in a database and establish relationships between
them [4]. Genes which share a number of GO terms are associated to one set. Based on
association rules, the similarity between target genes is defined as follow:
Similarity(g1, g2) = S(g1
S
g2)
WhereS(g)is the function which calculates the number of GO terms for the gene.g1Tg2
represent the intersection of GO terms between gene1 and gene2. Whileg1Sg2represent
the union of GO terms for gene1 and gene2.
Conservation validation
Conservation plays an important role in targets selection. It is known that hox genes are expressed collinear in time and space along the anteroposterior body axis and highly
conserved across species [27]. It is also verified and showed in miRBase that miR-10 and
miR-196 are conserved in other vertebrates like mouse and human.
After knowing the genomic location of miRNAs and targets, the conservation of the
phys-ical location relationships between miRNAs and their targets are studied. The selection
of target genes for dre-miR-10 and dre-miR-196 are checked whether they are located
closely together in other species as well. For this purpose, we utilize the found
miRNA-target relationships, repeat the genomic location analyses and detect the closely located
targets near miR-10 and miR-196 in human and mouse.
2.4 Visualization
Scalable Vector Graphics (SVG) and the Cytoscape viewer are applied in order to
visual-ize the results.
Scalable Vector Graphics is a language for describing two-dimensional graphics and graphical applications in XML [22]. SVG produces vector based graphics and
conse-quently, the resulting pictures can be zoomed without degradation. In using SVG, the
intention is that all the predicted targets or a set of interested targets and miRNA
fami-lies can be viewed globally on all chromosomes, at the same time detail location between
genes and their miRNAs can be even zoomed in to basepair scale.
Cytoscapesoftware platform is frequently used in bioinformatics for visualizing molec-ular interaction networks and integrating these interactions with gene expression profiles
and other state data [6]. In our application it is suitable to visualize the results of the
clus-tering. Nodes represent targets or target genes, while edges represent the similar functions
Figure 3: Expression patterns ofhoxb8a,hoxb9aand dre-miR-196a and 196b. It showed the mutually excluding expression patterns forhoxb8aandmir-196and constant expression of hoxb9a.
such as genomic location and p-value can be supplemented and showed in a sub panel.
(a) 100kb (b) 1000kb
3
Results
It has been validated thathoxb8a is the target of dre-miR-196. Fig. 3 shows an in situ hybridization forhoxb8a, hoxb9aand dre-miR-196a and miR-196b on 48 hpf zebrafish embryos. Hoxb8ais a target gene for miR-196. Obviously, this figure showed the mutu-ally excluding expression patterns for the two genes in the spinal cord wherehoxb8ais expressed in the anterior and miR-196 in the posterior part. However, thehoxb9agene which is physically located in between miR-196a andhoxb8ais expressed with the same intensity throughout the spinal cord.
In the global distribution analysis, the alternate hypothesis was defined in Section 2.3.
Ac-cording to t-test, the average targets number over all chromosomes and over their miRNA
located chromosomes equal to 32.22154 and 31.96404 respectively. The p-value which
equals 0.8926 indicates that there is a 90% probability that the H1 hypothesis occurred
by chance. As a consequence, it is concluded that when studied on a chromosomal scale
there is no significant difference between the target density in all chromosomes and in the
chromosomes wherein the miRNA is located.
Next the targets distribution on a smaller scale were studied by comparing the numbers of
targets in different windows surrounding the miRNA genomic positions. Fig. 4 shows the
number of expected targets and predicted targets for 117 miRNA families showed as index
in the window of 100kb Fig. 4(a) and 1000kb Fig. 4(b). The correlation coefficient for the
group of expected and predicted targets in 100kb is 0.707417, which is less than 0.932524
in 1000kb. This indicated that target genes in 100kb are distributed less proportionally
with the genomic genes in comparison with the one in 1000kb. From this, it is deduced
that the 100kb window may be an interesting zone to be further examined.
In order to compare the targets distribution difference in 100kb and 1000kb, the relative
frequency was calculated as equation (2). 35 out of 117 total number of families are
found having targets in the window of 100kb. Furthermore, 85.7% of them have relative
frequency in the window of 100kb greater than the one in 1000kb. Fig. 5 shows that 12
out of 13 selected families, which have highest absolute targets number in the window of
100kb, have relative frequency in the window of 100kb higher than in 1000kb. Therefore
it is concluded that many miRNA families are likely to have a higher density of predicted
Figure 5: Relative frequency in the window of 100kb and that in 1000kb. It illustrated that 12 out of 13 families have relative frequency in the window of 100kb higher than the one in 1000kb.
According to the above findings and the fact that dre-miR-196 and its known target gene
hoxb8aare physically close, the targets which are located within 100kb window size of their miRNAs are screened and are assumed to have high probability of being true targets.
This is a so called distance criterion. In our study, we applied this distance criterion to
dre-miR-10 and dre-miR-196. Fig. 6(a) and 6(b) illustrate the relative genomic location
of the high ranked targets depicted in blue (hoxb1b,hoxc4a,hoxb1a,hoxb3a,wu:fj80c12, hoxd10a, hoxd11a hoxd13a, hoxa13a, hoxa9a, hoxb5a, hoxb8a, zgc:92419, hoxc9aand hoxc8a) and the miRNA genomic copies depicted in red (dre-miR-10: a, b-1, b-2, c, d and dre-miR-196: a, b-1, b-2) respectively. They are located in different chromosomes
(a) Dre-mir-10 (b) Dre-mir-196
Figure 7: The overview of genomic location of top 50 predicted targets of dre-miR-10 ranked by p-value. The isoforms of dre-miR-10 (red triangles) and targets (blue lines) are displayed over 25 chromosomes (columns). The closeup view illustrated two hoxgeneshoxb1aand hoxb3agenomic located near dre-miR-10.
marked by the numbers on the left side. The length of each box is not related to the length
of genes. The intervals in chromosome 6 and 12 represent the duplicated entries for
Fig. 7 shows the case for dre-miR-10. Zebrafish possesses 5 genomic miR-10 copies
attributed to 4 isoforms named a, b, c and d [30] (cf. Fig. 6). The genomic positions of the different dre-miR-10 copies are depicted by red triangles. Targets selected by p-value
for dre-miR-10 are shown by the blue lines distributed over 25 chromosomes. From the
detailed view, it is clear that there is also a physical association between dre-miR-10 and
its confirmed targetshoxb1aandhoxb3a.
Validated targets are known for dre-miR-196 namelyhoxb8a[31, 11] and for dre-miR-10, hoxb1aandhoxb3a[29]. These are the controls in the analysis. Hoxb8ais found in both top 50 lowest p-value and top 50 highest score scale for dre-miR-196. The known targets
hoxb1aandhoxb3afor miRNA dre-miR-10 are in top 50 lowest p-value but not in top 50 highest score list. These results showed that real targets do not necessarily associate with
the highest sequence matching. Whereas selecting good targets by p-value works well in
these two miRNA families, since the known targets all have very low p-values.
Regarding to GO term clustering, in current stage the GO term similarity is set to 100%
defined as clustering criterion. This means that genes which have the same GO
descrip-tions are grouped together. Fig. 8 shows a particular set for dre-miR-10 visualized with
Cytoscape viewer. This set consists of not only the known targetshoxb1aandhoxb3abut alsohoxd13a, hoxd11a, hoxd10aand hoxc4a which are physically closely located with dre-miR-10 in the window of 100kb showed in green.
Except for the known targethoxb8a, targetshoxa9aandhoxc8aare found also conserved in mouse and human. The results of the enrichment process are listed in Table 1. The
selected targets are validated by testing whether they are in top 50 lowest p-value list
(abbreviated Top 50 p in Table 1) or functioning like known targets (abbreviated GO as
known in Table 1) or conserved in mouse and human. The known targets are marked in
Table 1: Enrichment information for high confident targets selected by distance criterion.
Candidates Top 50 p GO as known Conservation
hoxb3a √ √
-hoxb1a √ √
-hoxb1b - -
-hoxc4a - √
-wu:fj80c12 - -
-hoxd10a - √
-hoxd11a - √
-hoxd13a - √
-hoxb8a √ √ √
hoxa9a √ - √
hoxc9a - -
-hoxc8a √ - √
hoxa13a - √
-hoxb5a - -
-zgc:92419 - -
-Finally, based on the distance criterion combined with either p-value ranking or function
similarity or conservation,hoxd13a,hoxd11a,hoxd10aandhoxc4aare predicted as high confidence targets for dre-miR-10 and in similar fashion hoxa9a, hoxc8a, hoxa13a for dre-miR-196.
4
Conclusions and discussion
To date, still little is known on the interactions of miRNA with the transcriptome. In
order to promote the understanding of these interactions and learn how to perform pattern
recognition using the available resources, we presented an integrated approach to validate
miRNA targets through the analyses of physical location, p-value, the function of the
targets and conservation. We found that validated targets do not necessarily associate
with the highest sequence matching. Such is consistent with the general idea that targets
can imperfectly bind to miRNAs in animal systems [19]. An interesting phenomenon we
found is that for most of miRNA families, which have predicted targets located near by,
the frequency of their predicted targets is significantly higher in the genomic region nearby
the confidence to some of the candidates. Target geneshoxd10a, hoxd11a, hoxd13aand hoxc4aare not only located nearby dre-miR-10 but also have the same GO descriptions as the known targets. For dre-miR-196 the closed located target geneshoxa9aandhoxc8a are conserved in mouse and human and have low p-values as well. Integrating all the
results, finallyhoxd13a, hoxd11a,hoxd10aandhoxc4awere predicted as high confident targets for dre-miR-10 andhoxa9a,hoxc8a,hoxa13afor dre-miR-196.
Nevertheless, there are still some limitations in the method. Firstly, the input data sources
are from different databases, the degree of the accuracy of these databases affects the
results. For example, the genomic assembly errors in Ensembl will probably affect the
analysis of other miRNAs. Secondly, since the actual mechanism of miRNAs remains
unclear, our assumptions may only be suitable for a selection of miRNAs. Thirdly, in the
current version, we use some preset values as cutoff. This can be improved in the future
by computing the cutoff values from the datasets and evaluating them through a number
of computational approaches.
In general, different from other miRNA targets screen approaches, we integrated
hetero-geneous data sources and algorithms to screen target candidates mainly based on genomic
location feature which were elucidated as playing a role in miRNA-target interaction. By
using Ensembl perl API, the progress of the analysis has been greatly improved and the
Ensembl data are easily updated and retrieved.
An important step in the analysis was to visualize the relations and the physical mapping
so that our collaborators could grasp the underlying ideas. This was accomplished with
SVG, i.e. physical location of miRNAs and targets, and Cytoscape, i.e. GO relations
between targets.
In the future, this approach will be extended to other model systems and we are going
to integrate miRNAs microarray analysis which can monitor the temporal and spatial
By knowing the relationship between the expression of miRNAs and genes, the research
of the biological mechanism of miRNAs can be further facilitated. Besides these, more
data mining techniques are going to be applied to dissect miRNA target features. This
approach is a prelude to large scale machine learning analysis for all miRNAs in zebrafish
and possibly other model systems.
Acknowledgements
This research has been partially supported by the BioRange program of the Netherlands
Bioinformatics Centre (NBIC, BSIK grant).
References
[1] M. Ashburner, C. A. Ball, J. A. Blake, D. Botstein, H. Butler, J. M. Cherry, A. P. Davis, K. Dolinski, S. S. Dwight, J. T. Eppig, M. A. Harris, D. P. Hill, L. Issel-Tarver, A. Kasarskis, S. Lewis, J. C. Matese, J. E. Richardson, M. Ringwald, G. M. Rubin, and G. Sherlock. Gene ontology: tool for the unification of biology. the gene ontology consortium. Nat Genet, 25(1):25–29, May 2000.
[2] J. Brennecke, D. R. Hipfner, A. Stark, R. B. Russell, and S. M. Cohen. bantam encodes a developmentally regulated microrna that controls cell proliferation and regulates the proapoptotic gene hid in drosophila. Cell, 113(1):25–36, April 2003. [3] J. R. Brown and P. Sanseau. A computational view of micrornas and their targets.
Drug Discov Today, 10(8):595–601, April 2005.
[4] P. Carmona-Saez, M. Chagoyen, A. Rodriguez, O. Trelles, J. M. Carazo, and A. Pascual-Montano. Integrated analysis of gene expression by association rules discovery. BMC Bioinformatics, 7, 2006.
[5] C.Z. Chen, L. Li, H.F. Lodish, and D.P. Bartel. Micrornas modulate hematopoietic lineage differentiation. Science, 303(5654):83–86, Jan 2004.
[6] Cytoscape. http://www.cytoscape.org/.
[7] A. J. Enright, B. John, U. Gaul, T. Tuschl, C. Sander, and D. S. Marks. Microrna targets in drosophila. Genome Biol, 5(1), 2003.
[8] S. Griffiths-Jones. The microrna registry. Nucleic Acids Res, 32, January 2004. [9] S. Griffiths-Jones, R. J. Grocock, S. van Dongen, A. Bateman, and A. J. Enright.
[12] T. J. Hubbard, B. L. Aken, K. Beal, B. Ballester, M. Caccamo, Y. Chen, L. Clarke, G. Coates, F. Cunningham, T. Cutts, and et. al. Ensembl 2007. Nucleic Acids Res, 35(Database issue), January 2007.
[13] Hidenori Inaoka, Yutaka Fukuoka, and Isaac S. Kohane. Lower expression of genes near microrna in c. elegans germline. BMC Bioinformatics, 7(1), March 2006. [14] CH Lecellier, P Dunoyer, K Arar, J Lehmann-Che, S Eyquem, C Himber, A Sab, and
O. Voinnet. A cellular microrna mediates antiviral defense in human cells. Science, 308(5721):795–825, April 2005.
[15] R. C. Lee, R. L. Feinbaum, and V. Ambros. The c. elegans heterochronic gene lin-4 encodes small rnas with antisense complementarity to lin-14. Cell, 75(5):843–854, December 1993.
[16] B. P. Lewis, I. H. Shih, M. W. Jones-Rhoades, D. P. Bartel, and C. B. Burge. Predic-tion of mammalian microrna targets. Cell, 115(7):787–798, December 2003. [17] miRBase. http://microrna.sanger.ac.uk/targets/v4/faq.html.
[18] R. H. Plasterk. Micrornas in animal development. Cell, 124(5):877–881, March 2006.
[19] N. D. Rajewsky, N.and Soccib. Computational identification of microrna targets. Developmental Biology, 267(2):529–535, March 2004.
[20] Brenda J. Reinhart, Frank J. Slack, Michael Basson, Amy E. Pasquinelli, Jill C. Bettinger, Ann E. Rougvie, Robert H. Horvitz, and Gary Ruvkun. The 21-nucleotide let-7 rna regulates developmental timing in caenorhabditis elegans. Na-ture, 403(6772):901–906, February 2000.
[21] M. W. Rhoades, B. J. Reinhart, L. P. Lim, C. B. Burge, B. Bartel, and D. P. Bartel. Prediction of plant microrna targets. Cell, 110(4):513–520, August 2002.
[22] ScalableVectorGraphics. http://www.w3.org/graphics/svg/.
[23] Peter Schattner. Automated querying of genome databases. PLoS Computational Biology, 3(1), January 2007.
[25] A. Stark, J. Brennecke, R. B. Russell, and S. M. Cohen. Identification of drosophila microrna targets. PLoS Biol, 1(3), December 2003.
[26] A. Stark, J. Brennecke, R. B. Russell, and S. M. Cohen. Identification of drosophila microrna targets. PLoS Biol, 1(3), December 2003.
[27] A. Tanzer, C. T. Amemiya, C. B. Kim, and P. F. Stadler. Evolution of micrornas located within hox gene clusters. Experimental Zoology, 304B:75–85, 2005.
[28] Xiaowei Wang and Xiaohui Wang. Systematic identification of microrna functions by combining target prediction and expression profiling. Nucleic Acids Research, 34(5):1646–1652, 2006.
[29] J. M. Woltering and A. J. Durston. Mir-10 targets hoxb1a and hoxb3a and is required for correct migration of the xth cranial nerve. In preparation, 2007.
[30] Joost M. Woltering and Antony J. Durston. The zebrafish hoxdb cluster has been reduced to a single microrna. Nature Genetics, 38(6):601–602, 2006.
[31] S. Yekta, I. H. Shih, and D. P. Bartel. Microrna-directed cleavage of hoxb8 mrna. Science, 304(5670):594–596, April 2004.
Based on
Yanju Zhang, Jeroen S. de Bruin, Fons J. Verbeek. (2010). Specificity enhancement in
microRNA target prediction through knowledge discovery. Chapter 20. In: Machine
Summary
miRNAs are small regulators that mediate gene expression and each miRNA
regu-lates specific target genes. In animals, target prediction of the miRNAs is
accom-plished through several computational methods, i.e. miRanda, TargetScan and
Pic-Tar. Typically, these methods predict targets from features of miRNA-target
inter-action such as sequence complementarity, free energy of RNA duplexes and
conser-vation of target sites. They are constructed for high throughput and also result in a
large amount of predictions and a high estimated false-positive rate. To date, specific
rules to capture all known miRNA targets have not been devised. We observed that
miRNAs sometimes share targets. Therefore, in this chapter we present an approach
which analyzes miRNA-miRNA relationships and utilizes them for target prediction.
We use machine learning techniques to reveal the feature patterns between known
miRNAs. Different data setups are evaluated and compared to achieve the best
per-formance. Furthermore, the derived rules are applied to miRNAs of which the targets
are not yet known so as to see if new targets could be predicted. In the analysis of
functionally similar miRNAs, we found that genomic distance and seed similarity
between miRNAs are dominant features in the description of a group of miRNAs
binding the same target. Application of one specific rule resulted in the prediction
of targets for seven miRNAs for which the targets were formerly unknown. Some of
these targets were also predicted by other existing methods. Our method contributes
to the improvement of target identification by predicting targets with high specificity
of microRNAs; i.e. those that might bind to the same target. We intend to transfer our
approach to other groups of microRNAs as well as the broader application to the important
model species.
microRNAs (miRNAs) are a novel class of post-transcriptional gene expression
regula-tors discovered in the genome of plants, animals and viruses. The mature miRNAs are
about 22 nucleotides long. They bind to their target messengerRNA (mRNA) and
there-fore induce translational repression or degradation of target mRNAs [6, 1]. Recent studies
have elucidated that these short molecules are highly conserved between species
indicat-ing their fundamental roles conserved in evolutionary selection. They are implicated in
developmental timing regulation [26], apoptosis [3] and cell proliferation [19]. Some of
them even act as potential tumor suppressors [14], potential oncogenes [13] and might be
important targets for drugs [23].
The identification of large number of miRNAs existing in different species has increased
the interest in unraveling the mechanism of this regulator. It has been proven that more
than one miRNA regulates one target and vice versa [6]. Therefore understanding this
novel network of regulatory control is highly dependent on identification of miRNA
tar-gets. Due to the costly, labor-intensive nature of experimental techniques required,
cur-rently, there is no large-scale experimental target validation available leaving the
bio-logical function of the majority completely unknown [5]. These limitations of the wet
experiments lead to the development of computational prediction methods.
It has been established that the physical RNA interaction requires sequence
complemen-tarity and thermodynamic stability. Unlike plant miRNAs, which bind to their targets
through near-perfect sequence complementarity, the interaction between animal miRNAs
and their targets is more flexible. Partial complementarity is frequently found [6] and
this flexibility complicates computation. Lots of effort has been put into characterizing
miRanda, TargetScan/TargetScanS, RNAhybrid, DIANA-microT, picTar, and miTarget.
MiRanda [6] is one of the earliest developed large-scale target prediction algorithm which
was first designed for Drosophila then adapted for human and other vertebrates. It
con-sists of three steps: First, a dynamic programming local alignment is carried out between
miRNAs and 3’ UTR of potential targets using a scoring matrix. After filtering by
thresh-old score, the resulting binding sites are evaluated thermodynamically using the Vienna
RNA fold package [35]. Finally, the miRNA pairs that are conserved across species are
kept.
TargetScan/TargetScanS [22, 21] have a stronger emphasize on the seed region. In the
standard version of TargetScan, the predicted target-sites first require a 7-nucleotide (nt)
match to the seed region of miRNA, i.e., nucleotides 2-8; second, conservation in 4
genomes (human, mouse, rat and puffer fish), and third, thermodynamic stability.
Tar-getScanS is the new and simplified version of TargetScan. It extends the cross-species
comparison to 5 genomes (human, mouse, rat, dog and chicken) and requires a seed match
of only 6-nt long (nucleotides 2-7). Through the requirement of more stringent species
conservation it leads to more accurate predictions even without conducting free energy
calculations.
RNAhybrid [25] was the first method which integrated powerful statistical models for
large-scale target prediction. Basically, this method finds the energetically most
favor-able hybridization sites of a small RNA in a large RNA string. It takes candidate target
sequences and a set of miRNAs and looks for energetically favorable binding sites.
Statis-tical significance is evaluated with an extreme value statistics of length normalized
min-imum free energies for individual hits, a Poisson approximation of multiple hits, and the
calculation of effective numbers of orthologous targets in comparative studies of multiple
organisms. Results are filtered according to p-value thresholds.
DIANA-microT identified putative miRNA-target interaction using a modified dynamic
programming algorithm with a sliding window of 38 nucleotides that calculated binding
energies between two imperfectly paired RNAs. After filtering by an energy threshold,
the candidates are examined by the rules derived from mutation experiments of a single
let-7 binding site. Finally, those which were conserved between human and mouse were