DOI:10.1051/0004-6361/201527714 c
ESO 2016
Astronomy
&
Astrophysics
Mapping PAH sizes in NGC 7023 with SOFIA
B. A. Croiset
1, A. Candian
1, O. Berné
2,3, and A. G. G. M. Tielens
11 Leiden Observatory, Leiden University, Niels Bohrweg 2, 2333 CA Leiden, The Netherlands e-mail:[email protected]
2 Université de Toulouse, UPS-OMP, IRAP, 31028 Toulouse, France
3 CNRS, IRAP, 9 Av. colonel Roche, BP 44346, 31028 Toulouse Cedex, France
Received 9 November 2015/Accepted 29 February 2016
ABSTRACT
Context.NGC 7023 is a well-studied reflection nebula, which shows strong emission from polycyclic aromatic hydrocarbon (PAH) molecules in the form of aromatic infrared bands (AIBs). The spectral variations of the AIBs in this region are connected to the chemical evolution of the PAH molecules which, in turn, depends on the local physical conditions.
Aims.Our goal is to map PAH sizes in NGC 7023 with respect to the location of the star. We focus on the north west (NW) photo-dissociation region (PDR) and the south PDR of NGC 7023 to understand the photochemical evolution of PAHs, using size as a proxy.
Methods. We use the unique capabilities of the Stratospheric Observatory for Infrared Astronomy (SOFIA) to observe a 3.20× 3.40
region of NGC 7023 at wavelengths that we observe with high spatial resolution (2.700
) at 3.3 and 11.2µm. We compare the SOFIA images with existing images of the PAH emission at 8.0µm (Spitzer), emission from evaporating very small grains (eVSG) extracted fromSpitzer-IRS spectral cubes, the extended red emission (HubbleSpace Telescope and Canadian French Hawaiian Telescope), and H2(2.12µm). We create maps of the 11.2/3.3µm ratio to probe the morphology of the PAH size distribution and the 8.0/11.2µm ratio to probe the PAH ionization. We make use of an emission model and of vibrational spectra from the NASA Ames PAH database to translate the 11.2/3.3µm ratio to PAH sizes.
Results.The 11.2/3.3µm ratio map shows the smallest PAH concentrate on the PDR surface (H2and extended red emission) in the NW and south PDR. We estimated that PAHs in the NW PDR bear, on average, a number of carbon atoms (Nc) of∼70 in the PDR cavity and∼50 at the PDR surface. In the entire nebula, the results reveal a factor of 2 variation in the size of the PAH. We relate these size variations to several models for the evolution of the PAH families when they traverse from the molecular cloud to the PDR. Conclusions.The high-resolution PAH size map enables us to follow the photochemical evolution of PAHs in NGC 7023. Small PAHs result from the photo-evaporation of VSGs as they reach the PDR surface. Inside the PDR cavity, the PAH abundance drops as the smallest PAH are broken down. The average PAH size increases in the cavity where only the largest species survive or are converted into C60by photochemical processing.
Key words. astrochemistry – ISM: molecules – photon-dominated region (PDR) – infrared: ISM
1. Introduction
The aromatic infrared bands (AIBs) are prominent emis-sion bands that are emitted by UV-irradiated interstellar mat-ter. The strongest AIBs are observed at 3.3, 6.2, 7.7, 8.6, 11.2 µm and these features are produced by a specific class of molecules: polycyclic aromatic hydrocarbons (PAHs; Sellgren 1984; Leger & Puget 1984; Allamandola et al. 1985; Puget & Leger 1989). PAHs are stochastically heated by UV ra-diation and become highly vibrationally excited; then they relax by emitting photons in the AIBs (for a recent review seeTielens 2008). The AIBs show systematic variations in relative intensity and central wavelength of the bands (Peeters et al. 2002), which reflect the local physical conditions and the chemical evolution of this species.
NGC 7023, also known as the Iris nebula, is a well stud-ied reflection nebula in Cepheus. It is irradiated by a triple bi-nary system, HD 200775, consisting of two Herbig Be stars (Teff ∼19 000 K) and a third poorly studied companion (Li et al. 1994; Benisty et al. 2013). The stars are located 320±51 pc from the Sun (Benisty et al. 2013). In this study we focus on two photo dissociation regions (PDRs) near the star system, one in the north west (NW) and one to the south. Both PDRs show strong emission from PAHs and very small grains (VSGs); in the
NW PDR the presence of the neutral and cationic forms of the fullerene C60 are also detected (Berné et al. 2007,2008,2013; Sellgren et al. 2007,2010).
The Stratospheric Observatory For Infrared Astron-omy (SOFIA) is a telescope with an effective diameter of 2.5 m that is carried by a Boeing 747 aircraft (Young et al. 2012). SOFIA observes between 37 000 and 45 000 feet and above 99% of the water vapor in the atmosphere. SOFIA can observe in the wavelength range of 0.3–1600 µm and has spectroscopic and imaging capabilities, which makes it a perfect tool to study the interstellar medium.
A&A 590, A26 (2016)
The outline of this work is as follows: observations and data reduction are discussed in Sect. 2. In Sect. 3, the maps are presented. Section 4 presents a detailed description of how the 11.2/3.3µm ratio is translated into a PAH-size model. The results are discussed in Sect. 5 and conclusions are drawn in Sect. 6.
2. Observations and data reduction
NGC 7023 was observed by SOFIA in the 3rd cycle with two in-struments: the First Light Infrared TEst CAMera (FLITECAM) and the Faint Object infraRed CAmera for the Sofia Telescope (FORCAST;Temi et al. 2012;Herter et al. 2012).
FLITECAM is an infrared camera that operates in the wave-length range of 1.0–5.5 µm. The instrument was used in nod mode with a nod throw of 600 arcsec and in a 3-point dither pattern with a dither offset of 10 arcsec and 100 s exposure per dither. The filter used for the observations that we report is the PAH-filter, which has a central wavelength (λc) of 3.30µm and a very narrow bandwidth (∆λ) of 0.09µm. This filter is small enough to only trace the 3.3µm PAH emission. The instrument covers a region of 8 arcmin×8 arcmin with a square plate scale of 0.475 arcsec on a pixel array of 1024×1024 pixels.
The FORCAST instrument is a dual-channel mid-infrared camera and spectrographically sensitive in the wavelength range of 5–40µm. In this observation, the Short Wave Camera (SWC) was used with the 11.1µm filter, whereλc=11.1µm and∆λ= 0.95µm. For the observations, the nod match chop mode (C2N) was used with a chop throw of 300 arcsec, a chop angle of 15 de-grees, and no dithering. The SWC has 256×256 pixel array, which yields a field of view (FOV) of 3.2 arcmin×3.4 arcmin with a square plate scale of 0.768 arcsec.
The exposure times for FLITECAM were 300 s on source and 660 s total. For FORCAST the exposure times were 2300 s on source and a total overhead of 3557 s. The FLITECAM instrument has a resolution of ∼2 arcsec, which is limited by telescope jitter. FORCAST suffers slightly more from telescope jitter and has a resolution of 2.7 arcsec.
In addition to SOFIA observations, we used images pro-vided by the IRAC instrument of the Spitzer space telescope (Werner et al. 2004) to analyze the nebula. The IRAC 8.0 µm filter was used, which has a λc of 8.0 µm and a broad band-width of 2.9µm, thus it includes the strong PAH features at 6.2, 7.7, and 8.6 µm. We also used images of extended red emis-sion (ERE), VSG emisemis-sion and H2emission from different tele-scopes. With theSpitzerIRS instrument, the emission of VSGs and neutral and ionized PAH were extracted with the blind sig-nal separation (BSS) method byBerné et al.(2007). Molecular hydrogen was observed with the Perkins Telescope in the S PDR and with the Canadian French Hawaiian Telescope (CFHT), us-ing the 2.12 µm filter in the NW PDR (Lemaire et al. 1996; An & Sellgren 2003). With observations from the latter tele-scope an ERE image of the south PDR was extracted by Berné et al.(2008). For the NW PDR an ERE image was made fromHubbleSpace Telescope images (seeBerné et al. 2008).
Figure1 presents the images of NGC 7023 observed with FLITECAM at 3.3µm, IRAC at 8.0µm, FORCAST at 11.2µm, and a combined RGB image. The images show the NW PDR, the south PDR, and the triple binary system. The Herbig Be stars are unresolved and located in the east middle of the image (α:21h01m36.92s, δ:+ 68d09m47.76s). The 8.0µmSpitzer im-age most likely resolves the outermost companion that is lo-cated 6 arcsec away from the central star (Li et al. 1994). In the NW quadrant image, three stars are located. The stars are brighter at 3.3µm than at 8.0µm and absent at 11.2µm.
FLITECAM 3.3
µm21h01m40s 35s 30s 25s 68°10'30" 00" 09'30" 09'00" 08'30" Dec (J2000) S NW
IRAC 8.0
µm21h01m40s 35s 30s 25s 68°10'30" 00" 09'30" 09'00" 08'30" HD 200775 E N FORCAST 11.2 IRAC 8.0 FLITECAM 3.3
NGC 7023
21h01m40s 35s 30s 25s 68°10'30" 00" 09'30" 09'00" 08'30" RA (J2000)
FORCAST 11.2
µm21h01m40s 35s 30s 25s 68°10'30" 00" 09'30" 09'00" 08'30" RA (J2000) Dec (J2000)
Fig. 1.Top left panel: FLITECAM 3.3µm PAH filter observation of NGC 7023 with a∆λ=0.09µm.Top right panel: IRAC 8.0µm filter with a∆λ=2.90µm. The NW and the S indicate the NW PDR and the S PDR.Bottom left panel: FORCAST 11.1µm SWC filter observation with a∆λ=0.95µm. Thebottom right panelis an RGB image of the three images with (in red) the FORCAST, the IRAC (in green), and the FLITECAM image (in blue). All images are normalized to the maxi-mum value in the north PDR. The white box is the region used in the crosscut (see Fig.6).
The images at 3.3, 8.0, and 11.2 µm have a signal-to-noise (S/N) of 76, 45, and 21 in the peak of the NW PDR, re-spectively. The 11.2 µm image was convolved with a 2 pixel (1.4 arcsec) Gaussian kernel to increase the S/N. The field of view (FOV) of the images is∼1.9 arcmin×2.5 arcmin. The raw images from SOFIA were rotated and misaligned with respect to the 8.0µm image. Stars outside the images, shown in Fig.1, and the three stars were used as reference to realign the images to the coordinates of theSpitzerimage with high accuracy, using an optimizing algorithm. However, at 11.2µm the stars were not detected, therefore HD 200775, the NW, and south PDR were used to align the images. The uncertainty on the alignment is less than 1 arcsec. The 3.3µm and the IRAC image were regridded to the same pixel scale of the FORCAST image (0.768 arcsec). Using the aligned images we made intensity ratio maps of the nebula (see Figs.2,4).
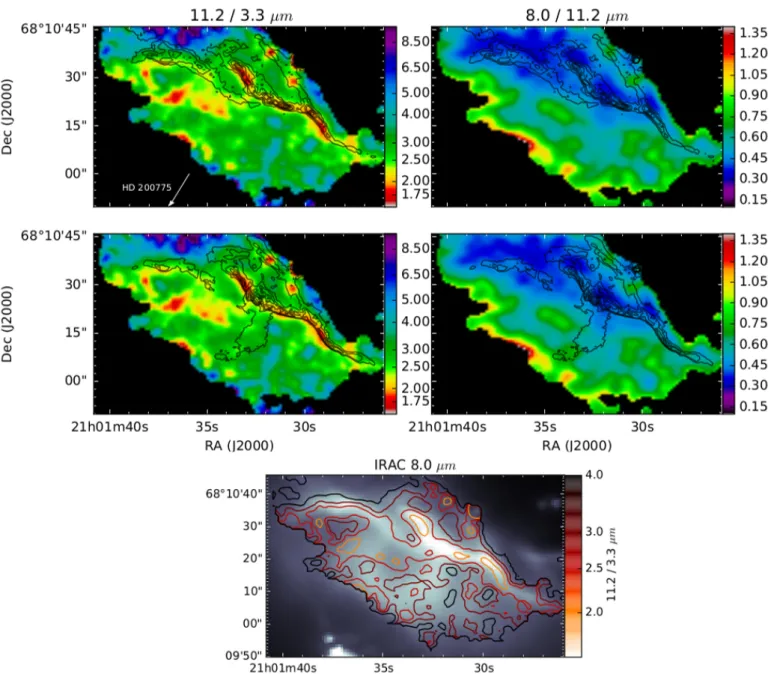
Fig. 2.PAH ratio maps of NGC 7023 NW PDR. The colors correspond to the 11.2/3.3µm emission ratio on theleft(PAH size tracer) and to the 8.0/11.2µm ratio on theright(PAH ionization indication).Top panels: the contour lines represent the H2emission (Lemaire et al. 1996) where the contours range from 0.8 to 3.7 [Wm−2sr−1] with 5 steps.Middle panels: the contour lines are the ERE emission. The contours are spaced in 5 steps with the outermost contour line of 0.5 and a maximum of 1.0 (Arb. Units) (Berné et al. 2008). Pixels with an S/N smaller than 3 in the ratio have been discarded.Bottom panel: The IRAC 8.0µm image with the contours of the 11.2/3.3µm ratio.
when determined with the Spitzer IRS spectra for the same positions observed by AKARI.
3. Morphology of the maps
NGC 7023 NW is often considered as the prototype of a PDR since it has an edge-on structure, which shows a clear stratifi-cation of different species (Pilleri et al. 2012). The star has cre-ated a low-density cavity that is surrounded by a dense molecular cloud. The cavity edge is lined by a thin HI layer (Fuente et al. 1998). The fullerene abundance increases rapidly into the cav-ity, while the PAH abundance decreases (Sellgren et al. 2010; Berné & Tielens 2012;Pilleri et al. 2012).
In Fig.1, we observe the bright northern PDR surface which is shaped in a wall structure, which separates the molecular cloud and the PDR cavity. Strong PAH emission is observed from the
PDR surface and extends to the south-east to 18 arcsec. The PDR surface is quite apparent in all wavelengths and coincides well with the tracers of the PDR surface, such as H2 and the ERE (Lemaire et al. 1996;Berné et al. 2008). We note the presence of a ring-like structure in the source south of the NW PDR. South of the stars, the cavity is larger and faint extended emission appears, most prominent at 8.0µm. At 11.2µm the extended emission is not clearly visible owing to higher noise levels. The south PDR surface has a similar wall structure that is clearly visible in the images.
A&A 590, A26 (2016)
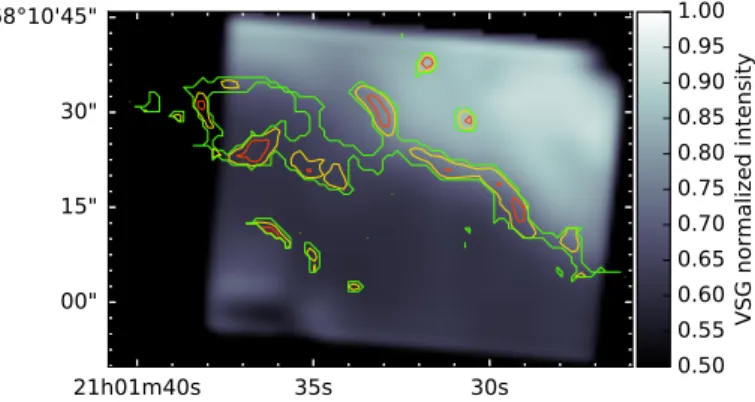
Fig. 3.VSG emission extracted fromSpitzerIRS byBerné et al.(2007). The contours are the 11.2/3.3µm ratio lower than 2.4 (Fig.2). The val-ues 1.9, 2.1, 2.4 of the 11.2/3.3µm ratio contours are drawn.
48 arcsec away from the star traced by H2and the 11.2/3.3µm emission ratio. The intensity ratio is higher in the PDR surface and rises quite rapidly behind the PDR and away from the star into the molecular cloud. The ring structure below the NW PDR does not appear in the ratio maps, nor in the H2 image, and is only partly visible in the ERE image. We note that the VSGs emission is limited to the molecular cloud region (see Fig. 3). The minimum in the 11.2/3.3µm ratio also indicates the bound-ary of the emission of the VSGs.
A similar good alignment is observed in the south PDR with the location of the PDR surface, as traced by the ERE (HST), H2, and 11.2/3.3µm ratio. A red spot is apparent between the PDR surface and HD 200775 and is due to a star behind the reflection nebula. The star is fainter than the three stars above the NW PDR (see Fig.1) in the 2MASS observation (Skrutskie et al. 2006). In the 8.0/11.2µm ratio maps, the emission decreases with distance from the star and has a maximum at the cavity edge. The PDR surface is located in an area where the ratio is low and the in-tensity ratio drops (dark blue) right behind the PDR surface and into the molecular cloud.
In Fig. 4, a spatial map of the 11.2/3.3 µm ratio and 8.0/11.2µm ratio of PAH in the south PDR is shown. These maps are made in the same way as for the NW PDR, but the ERE im-age and H2 are made from different telescopes (An & Sellgren 2003; Berné et al. 2008). The main PDR surface is traced by ERE, H2,and the 11.2/3.3µm ratio, however a second PDR sur-face to the south is not traced by the ERE emission. Compared to the NW PDR, the 11.2/3.3µm ratio traces the PDR surfaces quite well, just like in the NW PDR, although the ratio is some-what higher. Unfortunately the S/N of the 11.2µm was not high enough to map the extended emission to the north of the south PDR (see the IRAC 8.0µm panel in Fig.4). In the 8.0/11.2µm ratio map, the maximum value is lower than in the NW PDR and decreases with distance from the star.
4. Results
4.1. PAH size-emission model
The 11.2/3.3 µm ratio is a good measure of the size of the PAH (Allamandola et al. 1985; Ricca et al. 2012). We can use the calculated intrinsic strength of the CH modes in PAHs in the NASA Ames PAH database (Boersma et al. 2014) to calculate the 11.2/3.3µm intensity ratio, taking the IR cascade fully into account. The results are shown in Fig.5.
To estimate the emission of PAHs in NGC 7023, we need to provideEabsthe average energy per photon absorbed by a PAH molecule,
Eabs= R
NνhνσPAH,νexp (−κνNH)dν R
NνσPAH,νexp (−κνNH)dν
, (1)
whereNνdν = Fν/hνdν,ν is the frequency,h the Planck
con-stant,Nνis the number of photons,σPAH,νis the absorption cross section of PAHs,κνthe absorption cross-section per H nucleon
and NH the column density. We used a Kurucz model for the emission of the star with a Teff19 000 K ± 2000 K (Kurucz 1993; Benisty et al. 2013). For the value κν, we used an ex-tinction law with RV = 5.5 (Draine & Li 2001) and a NH of 1.5×10²¹ [atoms cm−2]. We used the absorption cross-section of circumcoronene (C54H18) from the Cagliari PAH database (Malloci et al. 2007). The effect ofNHon the PAH 11.2/3.3µm ratio is minimal, as illustrated in Fig.A.1. The mean absorbed photon energy for PAH molecules in NGC 7023 was evaluated to be 6.50 eV. The effects of the uncertainty in the stellarTeff and the dust extinction contribute to a±0.3 eV. The±0.3 eV un-certainty on the mean absorbed photon energy is not a statistical uncertainty, but rather a systematic uncertainty.
Figure5shows the results for 27 different PAHs from multi-ple families, with the constraints thatNcis smaller than 150 and that the molecule contains at least one solo C-H bond (responsi-ble for the 11.2µm emission). We used PAHs molecules from the Coronene, Ovalene, Anthracene, Tetracene families (Ricca et al. 2012; Peeters et al., in prep.), and the Pyrene family. While most of these PAHs are very compact, we have also included a few non-compact ones, to investigate the effect of the molecular structure on the 3.3/11.2µm ratio. All the PAHs in the selections are shown in Fig.A.2). As the UV absorption cross-sections for all PAHs are very similar, the uncertainty produces a vertical shift in Fig.5.
Figure5shows that the intensity ratio is sensitive to the size of the PAHs (Allamandola et al. 1985) and forms a well-defined relationship (Ricca et al. 2012). The slope and shape of the rela-tion is not sensitive to the stellar input spectrum or the extincrela-tion in the PDR. However, it can be shifted vertically for different average photon energies or adopted intrinsic strength.
4.2. PAH size
Fig. 4.Intensity ratio maps of the south PDR of NGC 7023. The colors from the colorbar correspond to the ratio of the 11.2/3.3µm ratio on the
leftand the 8.0/11.2µm ratio on theright. In thetop panelsthe contour lines follow the H2emission (2.12µm) from 90 to 150 in 6 steps (Arb. Units) (An & Sellgren 2003). In themiddle panelsthe contour lines are based on the ERE (Berné et al. 2008). The lines have been normalized and range from 0.1 to 1 (Arb. Units) with 6 steps. Pixels with a S/N smaller than 3 in the ratio have been discarded.Bottom panel: the IRAC 8.0µm image with the contours of the 11.2/3.3µm ratio.
intrinsic strength translates to a systematic uncertainty in quan-tifying PAH size. If the adopted intrinsic strength is increased by a factor of 2, then a range of Nc = 50–105 would change to a range ofNc=35–80. The trends, however, remain.
4.3. PAH size variation in the PDR
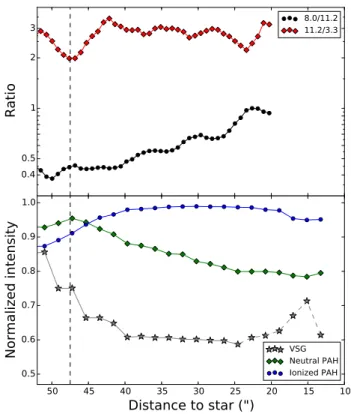
Figure6shows a crosscut across the NW PDR in PAH sizes, ion-ization, neutral PAH emission, and VSG. The PDR surface is lo-cated 48 arcsec from the star. At this point the neutral PAH emis-sion is the strongest and the 11.2/3.3µm ratio the lowest, with sizes ofNc =50. From the PDR surface to the cavity, the PAH sizes increase and remain constant withNc'70 and decrease in size just before the cavity toNc '60. The 8.0/11.2µm ratio is enhanced owing to the steady drop in emission from neutral PAH in the 11.2µm, while the broad 8.0µm filter, which traces the ionized PAH emission bands, only has a slight decrease in inten-sity towards the cavity. The 11.2/3.3µm ratio remains constant
in the PDR cavity, while the VSG emission drops 25% through the PDR surface.
5. Discussion
The evolution of PAHs in the NW PDR of NGC 7023 has been studied by Berné et al. (2007), Pilleri (2012), Boersma et al. (2013),Andrews et al. (2015) and modeled by Rapacioli et al. (2005),Berné & Tielens(2012), Montillaud (2013), Berné et al. (2015). This evolution is driven by the increasing strength of the radiation field as PAHs approach the surface of the PDR in the evaporative flow into the cavity. In this evolution, the weakest link goes first, i.e., bonds with the lowest binding energy will break first (Jochims et al. 1996).
A&A 590, A26 (2016)
0 20 40 60 80 100 120 140 160
Number of Carbon atoms
0.50 1.00 1.50 1.75 2.00 2.50 3.00 4.00 5.00 6.50 8.50 10.00 15.00
Intensity Ratio (11.2/3.3)
Fig. 5. 11.2/3.3 µm intensity ratio of 27 different PAHs with blue coronene family, green compact, and red non-compact PAHs. The aver-age photon energy absorbed by the PAHs used is 6.5 eV (see Eq. (1)). The ratio of the C-H stretching mode (3.3µm) over the solo out-of-plane bending mode (11.2µm) is extracted from the theoretical spectra from the NASA Ames PAH database. They-axis is linearly proportional to the adopted intrinsic band strength of the 11.2/3.3µm ratio. The colored horizontal lines have the same color coding as used for the 11.2/3.3µm ratio maps in Figs.2and4.
the PDR surface, upon photon absorption, these clusters evapo-rate into their constituent PAH molecules. As observations show, at the PDR surface, most clusters have disappeared (Fig.3). At that point, the next step in the photochemical evolution can ensue and photons will process these free-floating PAHs into their most stable isomers, which are likely the most compact PAHs (e.g., coronene and ovalene families). Inside the PDR cavity, these so-called grandPAHs (Andrews et al. 2015) are then broken down, first through complete H-stripping and conversion into graphene flakes, followed by sequential steps of C2 loss to smaller and smaller flakes, rings, and chains. The breakdown of the carbon skeleton competes with isomerization into cages and fullerenes (Berné & Tielens 2012). The observations reveal a rapid drop in the abundance of PAHs and an increase in the abundance of C60(Fig. 2 inBerné & Tielens 2012). We note that this destruc-tion process commences when the PAH charge distribudestruc-tion shifts from neutrals towards cations.
There is good experimental evidence for these photochemi-cal steps in the evolution of PAHs (Ekern et al. 1997;Joblin et al. 2009; Zhen et al. 2014a,b). Recent experiments have demon-strated that, for large PAHs, ionization dominates over fragmen-tation (Zhen et al. 2015). For large PAHs, the first ionization po-tential is less than the average photon energy, so destruction is not expected to set in until the PAHs are ionized.
The present observations provide further qualitative insight in this evolution and quantifies it in terms of the PAH sizes. The PAHs evaporating from VSGs deep in the PDR are relatively large (80 C-atoms) but photochemically unstable. When exposed to the harsh stellar radiation field at the surface of the PDR, these are rapidly converted to more stable and somewhat smaller (e.g., likely very compact) PAHs. Inside the cavity, the abundance of PAHs drops and, as PAH destruction is a very strong function of size, the PAH size is expected to increase again, as our ob-servations reveal, to ∼70 C-atoms (Fig. 6). These large PAHs can be photochemically converted into C60 (Zhen et al. 2014a; Berné et al. 2015).
6. Conclusions
Using FLITECAM and FORCAST on SOFIA, we have made a high spatial resolution map of the 11.2/3.3 and 8.0/11.2µm
0.4 0.5 1 2 3
Ratio
8.0/11.2 11.2/3.3 10 15 20 25 30 35 40 45 50Distance to star (")
0.5 0.6 0.7 0.8 0.9 1.0
Normalized intensity
VSG Neutral PAH Ionized PAHFig. 6.Top panel: the emission of the size (11.2/3.3µm) and ioniza-tion map as a funcioniza-tion of distance to the star in NGC 7023 (see Fig.2). The region of the crosscut is the white rectangle is Fig.1. In thebottom panel, along exactly the same region of the top panel, the normalized intensity of the neutral PAHs, ionised PAHs, and the VSGs is plotted (Berné et al. 2007). The vertical dashed line is the peak of the H2 emis-sion (see Fig.2). The PDR surface is 48 arcsec from the star, where the 11.2/3.3µm ratio and the neutral PAH emission are maximum and the VSG emission starts to decline. The increase in VSG abundance for less then 25 arcsec (dashed) is an artifact and reflects emission from big grains in radiative equilibrium, rather than thermally fluctuating VSGs.
intensity ratios to trace PAH size and ionization, respectively. The minimum of the 11.2/3.3µm ratio (lower ratio for smaller PAHs) shows a remarkable alignment with the PDR surface traced by H2 and ERE. The 8.0/11.2 µm ratio increases from the PDR surface to its maximum in the cavity, where the radia-tion field from the star ionizes and destroys the PAHs. A typical PAH size of 50 carbon atoms (circumcoronene) is found at the PDR surface. The analysis reveals a factor of 2 variation in the size of the emitting PAHs in the NW PDR in NGC 7023. This re-sult is robust against variation in molecular structures. The PAH size distribution agrees with the distribution of Boersma et al. (2013). The agreement between these very different approaches, 11.2/3.3µm ratio versus fitting SpitzerIRS spectra with theo-retical PAH spectra from the PAHdb, validates both techniques. The peak in the 11.2/3.3µm ratio (corresponding to PAHs of∼50 C-atoms) also corresponds to the edge of the VSG emis-sion i.e., occurs at the transition between the molecular cloud and the PDR surface. From the PDR surface to the cavity, 11.2/3.3 µm ratio decreases, which suggests that the smallest PAHs are quickly destroyed by UV photons. Hence, the typi-cal size increases to 70 carbon atoms. This is also in agreement with the idea that PAHs with sizes between 60 and 70 C-atoms can be converted into C60 in these regions (Zhen et al. 2014a; Berné et al. 2015).
FUV flux from the central star first evaporates PAH clusters into their PAH constituents, converts the latter into the most stable ones, and then destroys them. Quantitatively, our observations reveal that this photochemical evolution is very size-dependent and most effective for PAHs containing∼50 C-atoms, in good agreement with theoretical models (Berné et al. 2015).
These results show that the capabilities of SOFIA can help reveal the general structure and PAH evolution in PDRs, com-plementing the observations performed with ISO andSpitzer.
Acknowledgements. We thank Kris Sellgren for her insightful comments and
for sending us her H2 images. The authors also thank Paolo Pilleri for use-ful comments and making his data available. B. A. Croiset acknowledges the SOFIA grant which allowed this research to be presented at the 30 yrs of PDRs symposium. Based on observations made with the NASA/DLR Stratospheric Observatory for Infrared Astronomy (SOFIA), SOFIA is jointly operated by the Universities Space Research Association, Inc. (USRA), under NASA tract NAS2-97001 and the Deutsches SOFIA Institut (DSI) under DLR con-tract 50 OK 0901 to the University of Stuttgart. This work was supported by the CNRS program Physique et Chimie du Milieu Interstellaire (PCMI). Stud-ies of interstellar PAHs at Leiden Observatory are supported through advanced European Research Council grant 246976 and a Spinoza award.
References
Allamandola, L. J., Tielens, A. G. G. M., & Barker, J. R. 1985,ApJ, 290, L25
Allamandola, L. J., Tielens, A. G. G. M., & Barker, J. R. 1989,ApJS, 71, 733
Allamandola, L. J., Hudgins, D. M., & Sandford, S. A. 1999,ApJ, 511, L115
An, J. H., & Sellgren, K. 2003,ApJ, 599, 312
Andrews, H., Boersma, C., Werner, M. W., et al. 2015,ApJ, 807, 99
Abergel, A., Arab, H., Compiègne, M., et al. 2010,A&A, 518, L96
Bauschlicher, C. W., Jr., Peeters, E., & Allamandola, L. J. 2009,ApJ, 697, 311
Benisty, M., Perraut, K., Mourard, D., et al. 2013,A&A, 555, A113
Berné, O., & Tielens, A. G. G. M. 2012,Proc. Nat. Acad. Sci., 109, 401
Berné, O., Joblin, C., Deville, Y., et al. 2007,A&A, 469, 575
Berné, O., Joblin, C., Rapacioli, M., et al. 2008,A&A, 479, L41
Berné, O., Mulas, G., & Joblin, C. 2013,A&A, 550, L4
Berné, O., Montillaud, J., & Joblin, C. 2015,A&A, 577, A133
Boersma, C., Bregman, J. D., & Allamandola, L. J. 2013,ApJ, 769, 117
Boersma, C., Bauschlicher, C. W., Jr., Ricca, A., et al. 2014,ApJS, 211, 8
Boersma, C., Bregman, J., & Allamandola, L. J. 2015,ApJ, 806, 121
Candian, A., Kerr, T. H., Song, I.-O., McCombie, J., & Sarre, P. J. 2012,
MNRAS, 426, 389
Draine, B. T., & Li, A. 2001,ApJ, 551, 807
Ekern, S. P., Marshall, A. G., Szczepanski, J., & Vala, M. 1997,ApJ, 488, L39
Fleming, B., France, K., Lupu, R. E., & McCandliss, S. R. 2010,ApJ, 725, 159
Fuente, A., Martin-Pintado, J., Rodriguez-Franco, A., & Moriarty-Schieven, G. D. 1998,A&A, 339, 575
Galliano, F., Madden, S. C., Tielens, A. G. G. M., Peeters, E., & Jones, A. P. 2008,ApJ, 679, 310
Herter, T. L., Adams, J. D., De Buizer, J. M., et al. 2012,ApJ, 749, L18
Joblin, C., D’Hendecourt, L., Leger, A., & Defourneau, D. 1994,A&A, 281, 923
Joblin, C., Berné, O., Simon, A., & Mulas, G. 2009,Cosmic Dust – Near and Far, 414, 383
Jochims, H. W., Baumgaertel, H., & Leach, S. 1996,A&A, 314, 1003
Kurucz, R. L. 1993,IAU Colloq. 138: Peculiar versus Normal Phenomena in A-type and Related Stars, ASP Conf. Ser., 44, 8
Langhoff, S. R. 1996,J. Phys. Chem., 100, 8
Leger, A., & Puget, J. L. 1984,A&A, 137, L5
Lemaire, J. L., Field, D., Gerin, M., et al. 1996,A&A, 308, 895
Li, W., Evans, N. J., II, Harvey, P. M., & Colome, C. 1994,ApJ, 433, 199
Malloci, G., Joblin, C., & Mulas, G. 2007,Chem. Phys., 332, 353
Montillaud, J., Joblin, C., & Toublanc, D. 2013,A&A, 552, A15
Peeters, E., Hony, S., Van Kerckhoven, C., et al. 2002,A&A, 390, 1089
Pilleri, P., Montillaud, J., Berné, O., & Joblin, C. 2012,A&A, 542, A69
Pilleri, P., Joblin, C., Boulanger, F., & Onaka, T. 2015,A&A, 577, A16
Puget, J. L., & Leger, A. 1989,ARA&A, 27, 161
Rapacioli, M., Joblin, C., & Boissel, P. 2005,A&A, 429, 193
Ricca, A., Bauschlicher, C. W., Jr., Boersma, C., Tielens, A. G. G. M., & Allamandola, L. J. 2012,ApJ, 754, 75
Rosenberg, M. J. F., Berné, O., Boersma, C., Allamandola, L. J., & Tielens, A. G. G. M. 2011,A&A, 532, A128
Sellgren, K. 1984,ApJ, 277, 623
Sellgren, K., Uchida, K. I., & Werner, M. W. 2007,ApJ, 659, 1338
Sellgren, K., Werner, M. W., Ingalls, J. G., et al. 2010,ApJ, 722, L54
Skrutskie, M. F., Cutri, R. M., Stiening, R., et al. 2006,AJ, 131, 1163
Temi, P., Marcum, P. M., Miller, W. E., et al. 2012,Proc. SPIE, 8444, 844414
Tielens, A. G. G. M. 2008,ARA&A, 46, 289
Tielens, A. G. G. M. 2013,Rev. Mod. Phys., 85, 1021
Tielens, A. G. G. M., & Hollenbach, D. 1985,ApJ, 291, 722
Werner, M. W., Uchida, K. I., Sellgren, K., et al. 2004,ApJS, 154, 309
Witt, A. N., Gordon, K. D., Vijh, U. P., et al. 2006,ApJ, 636, 303
Young, E. T., Becklin, E. E., Marcum, P. M., et al. 2012,ApJ, 749, L17
Zhen, J., Castellanos, P., Paardekooper, D. M., Linnartz, H., & Tielens, A. G. G. M. 2014a,ApJ, 797, L30
Zhen, J., Paardekooper, D. M., Candian, A., Linnartz, H., & Tielens, A. G. G. M. 2014b,Chem. Phys. Lett., 592, 211
A&A 590, A26 (2016)
Appendix A
FigureA.1shows the effect of visual extinction (with HI column density) on the 3.3/11.2µm ratio. FigureA.2shows the sample PAHs used in this study.
0.1 0.5 1 1.5 3.0 4.5
H column density [
10
21H-atoms/cm
2]
12 3 4 5
Intensity ratio 11.2/3.3
0.1 0.5
A
V 1 1.5 3.0 4.5Fig. A.1.Effect of dust extinction optical depth on the 11.2/3.3µm ratio. The dust extinction cross-sections per H-atom have been taken from Draine & Li(2001); the model with RV = 5.5). For comparison, the
maximum H-column density along the line of sight in the northern PDR of NGC 7023 is measured to be 2.2×10²¹ atoms cm−2 (Fuente et al.