By Emily Parker Honors Thesis
Department of Public Policy
The University of North Carolina at Chapel Hill 8 April 2020
I would like to thank my first advisor, Dr. Lauen, for challenging me throughout this process. He has taught me many things about the research process while showing me patience and understanding. I appreciate the lessons he has taught me about having the attitude and responsibilities of a good researcher while helping me improve the quality of this paper.
I am also grateful for the contributions made by my second advisor, Aspacia Stafford. Her feedback has guided me to improve the clarity in my writing and throughout the writing process.
Table of Contents
Table of Contents ………. 1
Table of Figures……….2
Chapter: Introduction ………..3
History of Charter Schools………. 3
Why Segregation Matters………….……….. 4
Significance for Policy in North Carolina……….. 5
Following Chapters……….6
Chapter 2: Background and Conceptual Framework ……… 10
Conceptual Framework………. 10
Charter School Effects on Segregation………..12
Chapter 3: Methods ………....15
Data………... 16
Variables………....17
Sample………... 18
Methodology………..20
Chapter 4: Results ……….. 21
Trend Analysis……….. 21
Difference-in-Difference Analysis……… 24
Chapter 5: Recommendations and Conclusions ………. 30
Policy Implications and Future Studies……… 32
Table of Figures and Tables
TABLE 1. Descriptive Statistics for Outcome Variables………. 17
TABLE 2. Descriptive Statistics of Treatment Variables………. 18
TABLE 3. Summary Statistics for Sample………... 19
FIGURE A. HSG by year (>60% White/Asian)………... 21
FIGURE B. HSG by year (>80% White/Asian)………..…………..22
FIGURE C. HSG by year (<40% White/Asian)………... 23
FIGURE D. HSG by year (<20% White/Asian)………... 24
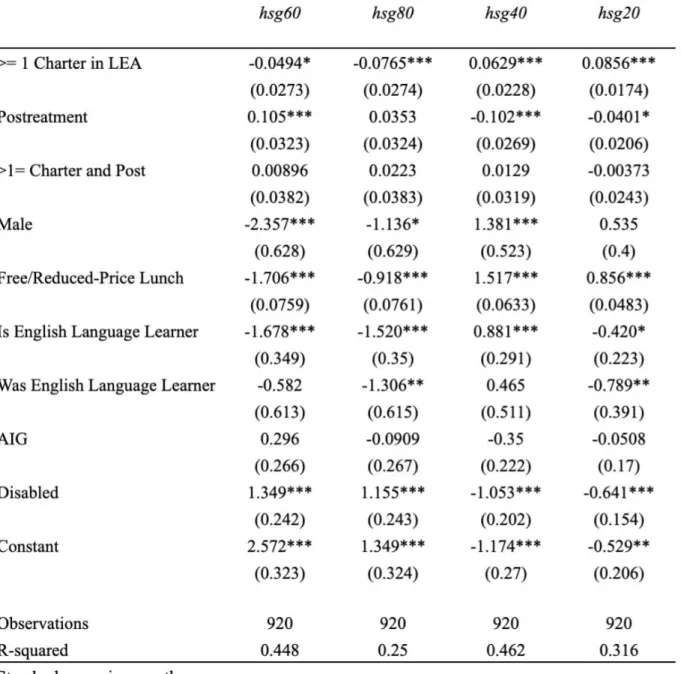
Table 4. Difference-in-Difference Results: At least one charter school in districts………. 25
Chapter 1: Introduction
This chapter examines the history and context of North Carolina charter schools, the negative effects of racially segregated schools, and policy changes that could improve outcomes for students in the state.
History of Charter Schools
In 1996, North Carolina legislators passed the Charter School Act, allowing for the establishment of up to 100 privately run and publicly funded charter schools in the state. A non-profit board of directors, independent of the State Board of Education, applies to receive a charter to operate a school. These schools cannot discriminate in admission or charge tuition but are free from many curricular regulations by which traditional public schools must abide.
Policymakers intended these schools to improve student learning outcomes, expand academic opportunities, and serve as a laboratory for innovative teaching practices and curricula (Charter School Act, 1996). Since 1996, the number of charter schools and their enrolled students increased each year across North Carolina. However, in 2011, legislators lifted the original 100-charter school cap, anticipating funding from the federal Race To The Top funding. This federal program, headed by former President Obama and Secretary of Education Arne Duncan,
encouraged states to remove “artificial caps on the growth of charter schools” to become eligible for funding (USDOE, 2009). Over the past 10 years, charter school attendance has grown more than 200% (NCDPI, 2019). During the 2019-2020 school year, the state funded 196 charter schools that enrolled over 110,000 students (Hui, 2020; NCDPI, 2020). Understandably, the percentage of the state’s school budget allocated to these schools has also grown to
but that this branch of school choice is steadily growing (NCDPI, 2020). This means that public school system stakeholders should understand the effects of charter schools on various academic, social, and cultural outcomes in North Carolina.
This study investigates the hypothesis that lifting the cap on charter schools, which increases the number of charter schools and the rate of charter school attendance, increases the prevalence of hyper-segregated schools within school districts. Accordingly, the two primary research questions of this study are:
(1) What are the effects of increasing charter school enrollment on the number of hyper-segregated schools in North Carolina school districts?
(2) What are the effects of increasing the number of districts with at least one charter school on the number of hyper-segregated schools in North Carolina school districts?
The answers to these research questions attempt to inform education policy that increases equity and educational opportunity for North Carolina residents.
Segregation as a Negative Outcome
Owens, 2014). By publicly funding segregated charter schools, the state government promotes these disparities.
Furthermore, some common characteristics of segregated schools lead to negative outcomes for all students. According to Ayscue, Nelson, Mickelson, Giersch, and Bottia (2018), segregated schools are linked to poorer teacher quality, greater teacher turnover rates, lower quality facilities, inadequate resources, and fewer options for honors or AP courses. This same study reports that schools with lower segregation are linked to overwhelmingly more positive outcomes for students. Graduates of desegregated schools are more likely to form friendships across social groups, to be less prejudiced, have higher academic outcomes, and sometimes a higher level of civic involvement (Ayscue, Nelson, Mickelson, Giersch, and Bottia, 2018).
Authors Reardon and Owen (2014) write about desegregation and labor outcomes in their literature review about segregation in schools. They include the robust finding that higher
exposure to desegregation improves earnings, decreases the likelihood of poverty, and increases the likelihood of employment. This paper also finds that racial segregation in schools across the nation is increasing over time. Reardon and Owens’s (2014) paper discusses the national trends in racial and economic segregation and the consequences for the students impacted by those trends. Using isolation and unevenness measures, the authors find that generally, the isolation of White students has increased since the 1980s, while unevenness measures remain fairly
consistent. Overall, the segregation of schools generally leads to worse social and economic outcomes for all students.
Significance for Policy in North Carolina
impact that increasing charter school attendance has on the state if the current laws remain in place.
Current Law
In 2014, Paino, Renzulli, Boylan, and Bradley studied how the accountability standards of North Carolina charter schools impacted the eventual success of those schools from 1997 to 2005. The authors found that the strength of bureaucratic accountability, or requiring compliance with the law, greatly impacts the success of a charter school. State law requires that charter school student bodies reasonably reflect the ethnic and racial composition of the district in which they are located by their second year of operation. In order to capture this obligation, the authors used a racial balance/compliance variable to measure the bureaucratic accountability of charter schools. The authors found that the least segregated charters schools also have higher levels of success than the more segregated schools. This finding suggests that schools with students that represent their community are stronger than those that do not.
Despite this finding, many charter schools may still have low levels of bureaucratic accountability with respect to racial balance. A recent article published in the News and Observer by T. Keung Hui (2020) shows how the North Carolina Charter Schools Advisory
Future Law
School funding changes may also impact the future law surrounding school choice and charter schools. In 2019, Governor Cooper commissioned a group of education policy experts and a third party research group, WestEd, to evaluate the current level and distribution of funding in North Carolina. The two bodies of experts independently analyzed school funding to see if it matched the constitutional promise of a sound, basic education to all public school students in the state; both groups recommend specific goals that require dramatically increased state spending on education. Supporters of market theory argue that a significant proportion of the new spending should be allocated to charter schools and other school choice avenues. Despite evidence that charter schools, as they exist now, may lead to more segregated schools, these proponents believe that charter schools, and more generally school choice is the best way to provide public education (Stoops, 2019). Figure A below shows the state’s funding allotted to charter schools. The exponential nature of the curve indicates that in recent years, spending has dramatically increased. Future decisions regarding education spending may maintain or change the trajectory of this curve.
The Following Chapters
Chapter 2 of this thesis includes additional background information and previous
literature about the work done in this area. It demonstrates the value added by the findings from this particular research study. Chapter 3 covers the research design of the study, including the data and methods used. This chapter also includes a brief review of the measures of segregation used by other authors in the literature. Chapter 4 discusses the results and findings of the
Chapter 2: Conceptual Framework and Background
The articles explaining the conceptual framework focus on school choice ideology and theories of segregation, while the featured background studies focus solely on the central relationship between charter schools and racial segregation. Each study included in the latter section has been published relatively recently and uses a unique methodology and sample to inform the chapter synthesis. All articles referenced in this chapter live on the UNC Articles+ database.
Conceptual Framework
Market Theory versus Integration Theory
Charter schools, as well as other avenues of school choice, such as vouchers and homeschooling, stem from market theory, rather than a theory of integration (Ayscue, Nelson, Mickelson, Giersch, & Bottia, 2018). According to market theory, the schools perform in a competitive, capitalistic economic market, in which individuals and families are consumers. Champions of this lens prize the market forces that dictate which schools succeed and which schools fail, and view government intervention or support as interfering with the effectiveness of such forces. This system values autonomy, efficiency, competition, privatization, and
deregulation (Chubb and Moe, 1990). On the other hand, integration theory, which arose from the Civil Rights Era, views school choice as a means to desegregation, particularly as it disrupts the link between a residential area and its assigned schools. Policies such as open enrollment, diversity goals, and free transportation agree with the foundations of integration theory (Cobb and Glass, 2009). On the other hand, charter schools, especially those governed by North
reduced-price lunch and are tasked with the minimal standard to “reasonably reflect the racial and ethnic composition” within the local school district (Charter School Act, 1996). Prioritizing market theory values in education policy buries potential civil rights protections. According to
Frankenberg, Siegel-Hawley, and Wang (2011), this practice promotes segregation for students attending charter schools. The studies and sources below show how school choice, within the context of market theory and charter schools, correlates with segregation and other negative societal outcomes.
Segregation and School Choice
Several published studies point to the positive relationship between charter schools and increased racial segregation. A 2007 study by authors Bifulco and Ladd found that charter schools increased the racial isolation of White and Black students, as well as increased the achievement gap in North Carolina schools. The number of charters has increased dramatically since 2000, the last year of data in this study, so it will be important to study how the effects have changed since then. A study evaluating the segregation trends in the Charlotte-Mecklenburg School System finds that charter schools became segregated at a faster rate than the traditional public schools in the area (Ayscue, Nelson, Mickelson, Giersch, & Bottia, 2018). This study uses data with observations over several years across several North Carolina districts, allowing for use of a difference-in-difference model; the policy change takes place after the cap is lifted, in the 2011-2012 school year, to determine the effects of charter schools on racial segregation patterns in North Carolina school districts.
policies (such as lack of transportation, or free or reduced-price lunch), might contribute to resegregation patterns in North Carolina as well. These historical policies will also influence the context of the study.
Charter School Effects on Segregation Racial Composition Preferences Revealed
charter elementary schools with 29% more Black students than the school they left, on average. The work of Bifulco and Ladd in 2007, which uses the data of third- through eighth-graders in North Carolina from 1996 to 2000, also shows that both Black and White parents in North Carolina overwhelmingly enroll their children in charter schools where their peers would be more similar to them racially than in their previous school.
The findings of these studies corroborate each other and suggest that the choice to change schools may reveal the preference of parents to select schools with more peers that were racially similar to them. The authors of all three studies used within-district analysis, considering the changes in school demographics of students who chose to attend a charter school. Additionally, all three of these studies used data that started around the same time, albeit Garcia’s study was much more abbreviated, and with the same age group. However, now, this data is outdated in North Carolina. The work of Ladd, Clotfelter, and Holbein (2017) only includes one school year of data after the cap lift. Regardless, the findings of these studies suggest that the patterns of increasingly racially segregated charter schools would continue, and maybe exacerbated.
The descriptive work of Ayscue, Nelson, Mickelson, Giersch, and Bottia (2018) gives insight into the progression of the North Carolina school district, Charlotte Mecklenburg Schools (CMS). By 2014, 70% of the district’s charter schools were either predominantly White and Asian or Black. In 2016, CMS was the most racially segregated large school system in the state. That year, due to the racially unbalanced composition of schools, 87% of the students who attended one of 76 schools where all students qualified for free lunch were Black and/or Latino. While authors of this article do not make any causal claims, the authors do point to some
same district. This paper will look further into the causal relationship between the prevalence of charter schools and all hyper-segregated schools within districts.
Counterevidence
Not all studies on this topic indicate that self-segregation affects all districts with charter schools. When reviewing the literature, the age of the students, geographic location, and unit of analysis studied seemed to influence whether the presence of charter schools would impact charter schools in a district. For example, Garcia (2008) found no evidence of high school students choosing to attend charter schools with higher percentages of their own race at the high school level in Arizona, even though the results strongly suggested the opposite for elementary school students. Two of the national studies on this topic found no evidence of a statistically significant relationship between charter schools and segregation. Using data from various
wide variations in charter school law nationwide may explain why only state and local studies find a causal relationship between these schools and segregation.
The findings of Bifulco, Ladd, and Ross’s (2009) study suggests that racial segregation may be a less relevant outcome variable than socioeconomic segregation. Their paper estimates the impact of school choice on race and class segregation by using data from the 2002-2003 school year in Durham, North Carolina, where 30% of students attended a charter school, to a statistically manufactured counterfactual Durham, where just 30% of students attend traditional public schools. Their findings suggest that if public choice schools were unavailable, the school district would be less segregated by class and race. However, the effects of choice on
socioeconomic segregation proved to be larger than on racial segregation. The work of Bifulco and Ladd in 2007, which uses the data of third- through eighth-graders in North Carolina from 1996 to 2000, also shows that parents in North Carolina who enrolled their children in charter schools chose environments where their peers were similar to them socioeconomically. These two studies, conducted using North Carolina data, suggest that socioeconomic and racial segregation are highly correlated within the context of school choice. These two students may indicate that socioeconomic status is more relevant, and that race is a confounding variable. Gaps in the Literature
Chapter 3: Methods Data
This study adapts a longitudinal dataset provided by the North Carolina Department of Instruction (NCDPI) for the Education Policy Initiation at Carolina (EPIC). This final data includes information on demographics, academic achievement, and school attended by district and year. In order to get the final dataset, the researchers first imported a crosswalk dataset, the active charter schools report, to obtain county identification, which includes administrative information about all of the active charter schools in North Carolina. After keeping the school name, county code, county name, school district, and city, this dataset was merged with a dataset that contains demographic information for each public school. Finally, this dataset merged with the dataset from EPIC. The continuous variables that captured grade, race, average daily
attendance were kept along with the year, district code, and school code.
After both dataset merges, the data includes 920 observations, including students from third- through eighth-grade, and years from the 2007-2008 to the 2014-2015 school year. 155 school districts in North Carolina are represented in the dataset.
Strengths and Limitations
This dataset does not include student-level address information, presenting a limitation for the internal validity of the study due to mismeasurement. In North Carolina, students may attend a charter school in a district other than the one in which they reside. If there are a high amount of students who change districts, then the estimations of the segregation variable within districts will be measured inaccurately. Garcia (2008), notes that not having the district from which a student exits and enters when moving to a charter school makes the measure of
were originally assigned to a traditional public school in the same district, then the estimations of the segregation variable will be robust.
Variables
Outcome Variables
The dataset used in this study only includes percentages of students by race, not total counts. Without a total count of students by district and year, neither isolation or exposure measures are options to capture the level of segregation in school districts. However, the dataset allows for the generation of a dummy variable that codes a school as either a hyper-segregated school (HSG) or not. The four outcome variables in the study are four HSG indicator variables with different thresholds, greater than 60, 80, and less than 40 and 20% White or Asian. A school that is coded as “1” for the variable hsg60 is a school with a student body more than 60% White or Asian and less than 40% Black, Hispanic, Multiracial, or Native American. A school that is coded as “1” for hsg20 is a school with a student body that is less than 20% White or Asian and more than 80% Black, Hispanic, Multiracial, or Native American.
These thresholds were selected after considering common thresholds in the literature. For instance, districts with an unevenness score of 0.6 or higher are considered to be highly
threshold of either 80% White or 80% of students of color to indicate an extremely segregated school. After looking at other indices of segregation and thresholds for extreme segregation in other articles, the four HSG thresholds were created to be used as outcome variables.
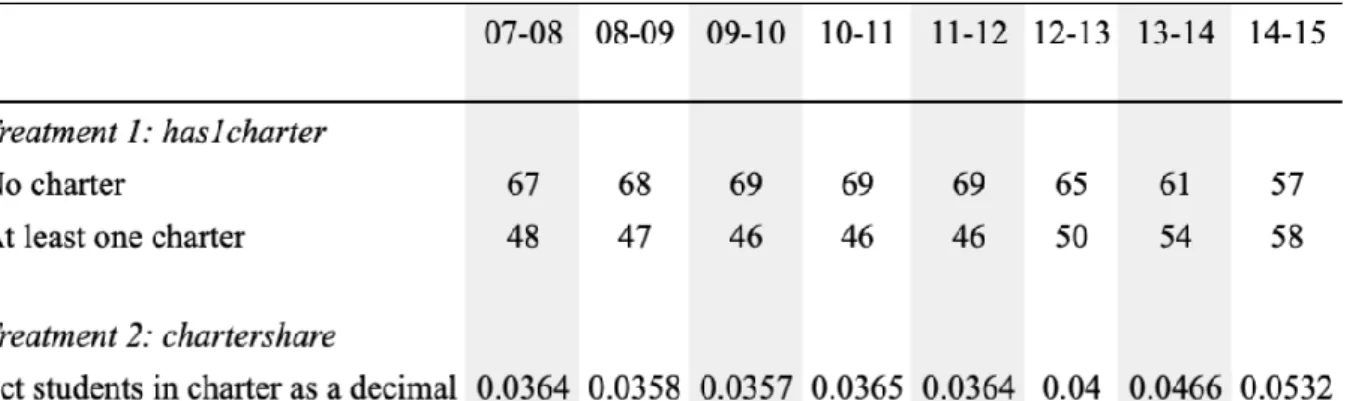
Table 1 below includes the mean values for each of the four outcome variables by year. These numbers indicate the percent, decimal form, of hyper-segregated schools in North Carolina according to the thresholds of 60, 80, 40, and 20% White or Asian.
TABLE 1. Descriptive Statistics for Outcome Variables
Treatment Variables
Two treatment variables in this study capture the growth of the charter school sector as well as a growing student population. The first, the binary variable has1charter, captured the number of districts that have at least one charter school. The second, the continuous variable chartershare, measures the percentage of students enrolled in a charter school within each
TABLE 2. Descriptive Statistics of Treatment Variables
Control Variables
Each of the analyses controls for sex, receiving free or reduced-price lunch, currently or formerly being an English Language Learner, being gifted, and being disabled. In the EPIC dataset, each of these variables are calculated as the mean percent of students who qualify as belonging to one of the groups by year and school district. Therefore the control variables, named male, frlnch, islep, waslep, ex_aig, and ex_dis, each are continuous variables. Estimation Sample
district in which no child attends a charter school, but the variation of percent of schools attended may provide more insight into what level of density, if any, impacts segregation district-wide.
This sample includes 920 observations. The table below lists the summary statistics for each of the variables used directly, and demographic variables used indirectly, in the analysis. All of the control and demographic variables, except for the days attended in school, are the mean percentage across the state, but recorded in decimal form.
Empirical Methodology Difference-in-Difference Model
The difference-in-difference model, estimated at the district-year level, helps to determine whether the prevalence of charter schools increases the proportion of highly segregated schools. Comparing the levels of segregation before and after the 100-school cap was lifted in 2011, shows the effect of the policy change and the causal relationship between charter school enrollment and the proportion of different classifications of HSGs. The equation for the difference-in-difference model lies below.
Υ
4it= β
0+ β
1X
it+
૪
0Τ
2i+
૪
1Ρ
t+
૪
2Τ
2i*Ρ
t+
ε
itIn the difference-in-difference model Υ4it, represents the four outcome variables, hsg60, hsg80,
hsg40, and hsg20. The control variable vector is represented by
X
it,, and represents the sixcontrol variables included in each model, male, frlnch, islep, waslep, ex_aig, and ex_dis. The treatment variables are represented as Τ2i, which are has1charter and chartershare. The error
term is
ε
itin the equation. Ρtis the post-reform variable and equals “1” if an observation occursbefore the policy enaction in 2011 and “0” if after. Τ2i
*Ρ
t,
the interaction term betweentreatment and time, is also included in the difference-in-difference model. The coefficient of this term shows the policy effect of the lifted cap on the segregation within a district. For each of the variables, the subscript “i” designates the district and “t” the year. Each analysis used a
Chapter Four: Results Trend Analysis
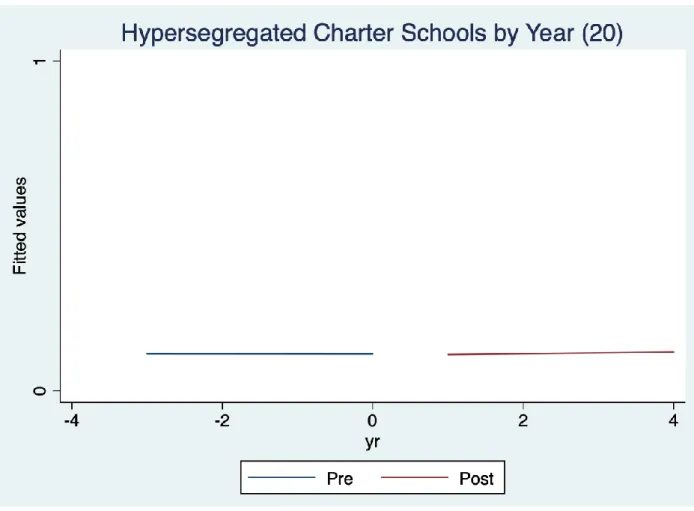
Figures A through D included below show the average percent of hyper-segregated schools (HSG) by year. These data are also included in Table 1 in Chapter Three. The visual representation of the prevalence of HSG shows the trends before and after the policy change occurred in 2011 when the limit on charter schools was removed in North Carolina. These figures do not indicate causal relationships, but they do visually show how little the policy change impacted the percent of HSG in North Carolina school districts on average. The percentage of HSG per school district barely changes in Figures A through D.
Figure A shows the trends of HSG, when HSG are classified as having a student body that is greater than 60% White or Asian. Both before and after the cap was lifted, the trend of this specification of this HSG decreased. In the post-reform period, the decline slightly flattens, however the rate of change is not significant enough to suggest that the policy impacted the percent of schools that were this type of HSG.
FIGURE B. HSG by year (>80% White/Asian)
FIGURE C. HSG by year (<40% White/Asian)
FIGURE D. HSG by year (<20% White/Asian)
Figure D shows the trends of hyper-segregated schools (HSG), when HSG are classified as having a student body that is less than 20% White or Asian. This figure indicates that the amount of HSG with a student body comprising over 80% Black, Hispanic, Multiracial and Native American students largely remains flat, similarly to Figures A through C.
Difference-In-Difference Analysis
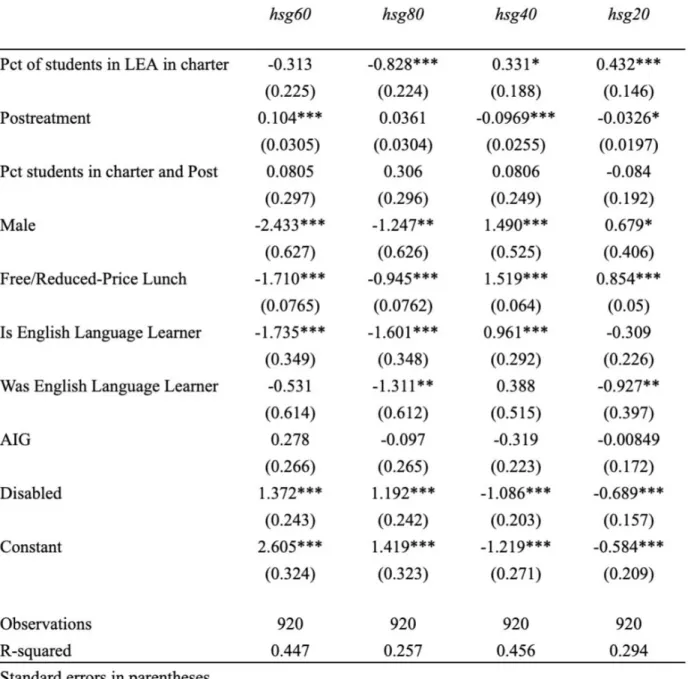
TABLE 4. Difference-in-Difference Results: Percentage of students in charter
No Significant Interactions
effect on the percent of HSG in the district, at least the 10% confidence level. Additionally, belonging to the post-reform period has a significant effect on the percent of HSG at all thresholds except hsg80, greater than 80% White or Asian. However, none of the analyses showed that having at least one charter in the school district after the post-reform period had a significant effect on the proportion of hyper-segregated schools in the district. For the analyses using the percent of students in a school district enrolled in the charter school, the same findings hold true. Based on these data, I reject the research hypothesis, that lifting the cap on the number of charter schools in North Carolina increases the prevalence of HSG. In the future, datasets that include a greater amount of year both before and after the cap lift may reveal different trends. As referenced in Table 2, both the number of districts with at least one charter school and the
percentage of students enrolled in a charter school increases steadily until at least two years after the policy change. Datasets with information about these treatment variables in future years may better the true effects of the policy change on the prevalence of HSG.
Charter School and Post-Reform Effects
Table 5 shows similar trends to those of Table 4, as the effect of increasing the percent of students who attend a charter within a district decreases the percentage of hyper-segregated schools with greater than 60% and 80% of White and Asian students and increases the hyper-segregated schools with less than 40% and 20% of White and Asian students. Specifically, increasing the percentage of students in charter schools within a district by one percent decreases the proportion of hsg80, and increases hsg40 and. In the post-reform period, the proportion of hyper-segregated schools with greater than 40 percent of students who are White and Asian drops, on average. The trends of charter school prevalence and being in the post-reform period differ in direction for hyper-segregated schools that are majority White and Asian and minority White and Asian. For hsg40 and hsg20, being in the post-reform period reduces the proportion of these.
The trends in both Tables 4 and 5 confirm the patterns seen in Figures A through D. The percentage of HSG per school district serving a majority of Black, Hispanic, Multiracial, and American Indian students barely increases after the policy change, while the opposite happens for schools that serve a majority of White and Asian students.
Increasing the proportion of students who receive free or reduced-price lunch
Chapter Five: Conclusions and Recommendations
The findings of the analyses partially answered the original research questions but did not support the hypothesis. The primary research questions of this study are:
(1) What are the effects of increasing charter school enrollment on the number of hyper-segregated schools in North Carolina school districts?
(2) What are the effects of increasing the number of districts with at least one charter school on the number of hyper-segregated schools in North Carolina school districts?
While the results from the analyses did provide insight for these two questions, the hypothesis, that lifting the cap on charter schools, which increases the number of charter schools and the rate of charter school attendance, increases the prevalence of hyper-segregated schools within school districts, was not upheld by the findings.
One of the largest limitations of the findings is the range of years included in the dataset. Incorporating more years after the cap was lifted would show how rapidly the charter school sector has grown over time. Another limitation of the study regards the treatment variables used in the analysis. The majority of literature on segregation uses exposure and dissimilarity
measures, which were not possible to calculate with this dataset. The implications of this paper may be restricted by the chosen measure of segregation, since it may be difficult to compare these findings to those of studies using exposure and dissimilarity indices. On the other hand, the use of a different treatment variable may bolster the relevance of these findings, the HSG
Policy Implications and Future Studies
The results of this analysis do not suggest the benefit of any particular policy. Since the relationship between the interaction of charter school treatment variable and the post-reform variable on the percent of HSG was not statistically significant, the suggestion to replace the cap, or limit the number of charters in general, is not supported by this analysis. However, the results do suggest that there is a correlation between the prevalence of charter schools and HSG. While these results do not point to what factors of charter schools cause HSG to grow, this study proves that the relationship does exist. Additionally, the significance of the post-reform variable
suggests that the greater prevalence of charter schools has an impact on HSG growth as well. In the 2020 Charter School Annual Report, this statement falls under the subtitle “A Closer Look at Racial/Ethnic Diversity in Charter Schools”:
To give appropriate insight on the extent to which charter schools reasonably reflect the areas in which they are located, significant research would need to be conducted to disaggregate the racial and ethnic breakdown of traditional schools and charter schools serving diverse communities within all LEAs in the state. (NCDPI, 2020)
it may be interesting to focus on how traditional public schools are affected by concentrations of charter schools in particular districts, such as Durham, Wake, or Charlotte Mecklenburg
Counties.
References
Ayscue, J., Nelson, A. H., Mickelson, R. A., Giersch, J., & Bottia, M. A. (2018). Charters as a Driver of Resegregation. The Civil Rights Project. https://www.civilrightsproject.ucla. edu/research/k-12-education/integration-and-diversity/charters-as-a-driver-of-resegregati on/Charters-as-a-Driver-of-Resegregation-012518.pdf.
Benjamin, K. (2019). The dream revisited: Contemporary debates about housing, segregation, and opportunity: Edited by Ingrid Gould Ellen and Justin Peter Steil, New York: Columbia University Press, 2019, ISBN 978-0231183635. Ethnic and Racial Studies, 1-3. doi:10.1080/01419870.2019.1685118
Bifulco, R., & Ladd, H. F. (2007). School choice, racial segregation, and test-score gaps: Evidence from North Carolina's charter school program. Journal of Policy Analysis and Management, 26(1), 31-56. doi:10.1002/pam.20226
Bifulco, R., Ladd, H. F., & Ross, S. L. (2009). Public school choice and integration evidence from Durham, North Carolina. Social Science Research, 38(1), 71-85.
doi:10.1016/j.ssresearch.2008.10.001
Chubb, J. E., & Moe, T. M. (1990). Politics, markets, and America's schools. Washington, DC: Brookings Institution Press.
Cobb, C. D., & Glass, G. V. (2009). School choice in a post-desegregation world. Peabody Journal of Education, 84(2), 262-278. doi:10.1080/01619560902810187
North Carolina Department of Instruction. (2019). Charter Schools Annual Report Draft
North Carolina Department of Instruction. (2020). Charter Schools Annual Report. Retrieved
From: https://files.nc.gov/dpi/documents/charterschools/resources/report-charter-s
Frankenberg, E., Siegel-Hawley, G., & Wang, J. (2011). Choice without equity: Charter school segregation. Education Policy Analysis Archives, 19(1), 1. doi:10.14507/epaa.v19n1.2011 Garcia, D. R. (2008). The impact of school choice on racial segregation in charter schools.
Educational Policy, 22(6), 805-829. doi:10.1177/0895904807310043
Hui, T. K. (2020, January 3). Report looked at racial impact of NC charter schools. That section is being removed. The News & Observer. Retrieved from
https://www.newsobserver.com/news/local/education/article238936383.html
Ladd, H. F., Clotfelter, C. T., & Holbein, J. B. (2017). The growing segmentation of the charter school sector in North Carolina. Education Finance and Policy, 1-48.
doi:10.1162/EDFP_a_00226
Massey, D. S. & Denton, N. A. (1993) American Apartheid: Segregation and the Making of the
Underclass. Harvard University Press, Cambridge, MA.
Monarrez, T., Kisida, B., and Chingos, M. M. (2019). Do charter schools increase segregation? Education Next, 19(4). Retrieved from https://www.urban.org/sites/default/files/
publication/100689/charter_school_effects_on_school_segregation_0.pdf.
Paino, M., Renzulli, L. A., Boylan, R. L., & Bradley, C. L. (2014). For Grades or Money? Charter School Failure in North Carolina. Educational Administration Quarterly, 50(3), 500–536. https://doi.org/10.1177/0013161X13505289
Public Schools First NC. (n.d.) Cumulative total state funding NC charter schools 1997-1998 thru 2018-2019. Retrieved from: https://www.publicschoolsfirstnc.org/wp-content/ uploads/2019/10/State-Funding-NC-Charter-Schools-1997-1998-_2018-2019-1.pdf Reardon, S. F., & Owens, A. (2014). 60 years after brown: Trends and consequences of school
-043152
Ritter, G., Jensen, N., Kisida, B., and McGee, J. (2010). A closer look at charter schools and
segregation. Education Next; Cambridge, 10(3).
Saporito, S. (2003). Private Choices, Public Consequences: Magnet School Choice and
Segregation by Race and Poverty. Social Problems,50(2), 181-203.
doi:10.1525/sp.2003.50.2.181
Stoop, T. (2019). Leandro and the financial impact of charter schools on districts. The John
Locke Foundation. Retrieved from https://www.johnlocke.org/update/leandro-and-
the-financial-impact-of-charter-schools-on-districts/.
The Charter School Act, State Abbreviation Code Abbreviation G.S. 115C.14a § 115C-218 (1996).
U.S. Department of Education (2009). States open to charters start fast in “Race to Top” [press release].Retrieved from https://www2.ed.gov/news/pressreleases/2009/06/
06082009a.html
Z. Smith Reynolds Foundation. North Carolina voters and the value of public education 2015: Survey highlights. (2015). Retrieved from https://www.zsr.org/sites/default/files/