First year physical activity findings from turn
up the HEAT (Healthy Eating and Activity Time)
in summer day camps
R. Glenn Weaver1*, Keith Brazendale1, Jessica L. Chandler1, Gabrielle M. Turner-McGrievy2, Justin B. Moore3, Jennifer L. Huberty4, Dianne S. Ward5, Michael W. Beets1
1 University of South Carolina, Department of Exercise Science, Columbia, South Carolina, United States of
America, 2 University of South Carolina, Department of Health Promotion, Education, and Behavior, Columbia, South Carolina, United States of America, 3 Wake Forest School of Medicine, Department of Family and Community Medicine, Winston-Salem, North Carolina, United States of America, 4 Arizona State University, School of Nutrition and Health Promotion, Phoenix, Arizona, United States of America,
5 University of North Carolina at Chapel Hill, Department of Nutrition, Chapel Hill, North Carolina, United
States of America
Abstract
Background
Summer day camps (SDCs) serve 14 million children yearly in the U.S. and aim to provide participating children with 60 minutes of moderate-to-vigorous physical activity (MVPA). This study evaluated an intervention designed to increase the percent of children meeting this MVPA guideline.
Design
Two-group, pre-post quasi-experimental.
Setting/Participants
Twenty SDCs serving 1,830 children aged 5–12 years were assigned to MVPA intervention (n = 10) or healthy eating attention control (n = 10).
Intervention
The STEPs (Strategies to Enhance Practice) intervention is a capacity-building approach grounded in the Theory of Expanded, Extended and Enhanced Opportunities. Camp leaders and staff receive training to expand (e.g., introduction of activity breaks/active field trips), extend (e.g., schedule minimum of 3 hours/day for PA opportunities), and enhance (e.g., maximize MVPA children accumulate during schedule activity) activity opportunities. Camps in the comparison condition received support for improving the types of foods/bever-ages served.
Main outcome measures
Percent of children accumulating the 60min/d MVPA guideline at baseline (summer 2015) and post-test (summer 2016) measured via wrist-accelerometry.
a1111111111 a1111111111 a1111111111 a1111111111 a1111111111
OPEN ACCESS
Citation: Weaver RG, Brazendale K, Chandler JL,
Turner-McGrievy GM, Moore JB, Huberty JL, et al. (2017) First year physical activity findings from turn up the HEAT (Healthy Eating and Activity Time) in summer day camps. PLoS ONE 12(3): e0173791.https://doi.org/10.1371/journal. pone.0173791
Editor: Jacobus P. van Wouwe, TNO,
NETHERLANDS
Received: December 5, 2016
Accepted: February 25, 2017
Published: March 28, 2017
Copyright:©2017 Weaver et al. This is an open access article distributed under the terms of the
Creative Commons Attribution License, which permits unrestricted use, distribution, and reproduction in any medium, provided the original author and source are credited.
Data Availability Statement: Public sharing of data
is restricted to preserve the confidentiality of study participants. STATA code, a data dictionary, and a de-identified, ethically compliant data set underlying the study findings will be made available upon request. Requests for a data set and documentation can be addressed by contacting the lead author at:[email protected].
Funding: This study was funded by the Eunice
Results
Multilevel logistic regression conducted fall 2016 indicated boys and girls attending interven-tion SDCs were 2.04 (95CI = 1.10,3.78) and 3.84 (95CI = 2.02,7.33) times more likely to meet the 60min/d guideline compared to boys and girls attending control SDCs, respec-tively. This corresponded to increases of +10.6% (78–89%) and +12.6% (69–82%) in the percentage of boys and girls meeting the guideline in intervention SDCs, respectively. Boys in comparison SDCs increased by +1.6% (81–83%) and girls decreased by -5.5% (76– 71%). Process data indicated intervention SDCs successfully extended and enhanced PA opportunities, but were unable to expand PA opportunities, compared to control SDCs.
Conclusions
Although substantial proportions of children met the MVPA guideline at baseline, no SDCs ensured all children met the guideline. This intervention demonstrated that, with support, SDCs can help all children in attendance to accumulate their daily recommended 60min MVPA.
Trial registration
ClinicalTrials.govNCT02161809
Introduction
The largest providers of summer day camps (SDCs) in the U.S., such as the YMCA of the USA [1], the Boys and Girls Clubs of America [2], and the National Recreation and Parks Associa-tion [3], recently adopted physical activity guidelines that call for SDCs to ensure all children accumulate 60 minutes/day of moderate-to-vigorous physical activity (MVPA) while in atten-dance. This guideline has the potential to impact the health of the 14 million youth that attend SDCs annually in the U.S. [4] Moreover, this guideline is especially important as summer (commonly 2–3 months) has been identified as a “window of vulnerability” for children in terms of health outcomes. Recent studies have clearly demonstrated that children gain excess weight [5,6] and lose fitness [7,8] over the summer when compared to the school year. Thus, interventions targeting settings during times when children are vulnerable to unhealthy behav-iors are critically important.
Few studies have examined children’s accumulation of MVPA during SDCs, and a dearth of studies evaluating interventions to increase children’s physical activity in this setting exist. Those studies that do exist [9–11] report widely different levels of MVPA ranging from 36.9 min/d [9] to 86.0 min/d [11]. These varying estimates are due to the use of different measure-ment devices (e.g., pedometers vs. accelerometers), and small sample sizes (e.g., 184 children in 5 SDCs) [11]. Thus it is challenging to estimate the amount of MVPA camps currently pro-vide the children that attend. Further, studies that have targeted increasing children’s physical activity during SDCs have focused almost exclusively on creating new, specialty camps that tar-get relatively small, mostly middle to upper income, segments of the population. For instance, several studies have created residential weight loss camps to evaluate their efficacy in reducing weight in overweight youth [12–14] or evaluated the effectiveness of a SDC that was created for a small number of low income minority girls (N = 19) [10]. Only one study to date has eval-uated the effectiveness of an intervention designed to enhance the amount of MVPA accumu-lated by children attending pre-existing non-specialty SDCs [15,16]. While the study did not & Human Development award R01HD079372. The
funder had no role in study design, data collection and analysis, decision to publish, or preparation of the manuscript.
Competing interests: The authors have declared
have a comparison group and was limited to four SDCs, it showed promising increases in staff promotion of physical activity during the SDC and corresponding increases in the percent of children engaged in MVPA during physical activity opportunities [15,16]. However, because of the use of systematic observation, estimation of the proportion of children meeting the 60 min/d of MVPA guideline is not possible.
Given the potential impact of SDCs on the MVPA of attending youth and potential for excessive weight gain and loss of fitness during the summer, especially in the most vulnerable youth, it is critically important to understand the dose of MVPA these SDCs are providing for children who attend. This information can inform the development of interventions to maxi-mize SDCs impact on the achievement of the 60 min/d MVPA guideline. The objective of this study was to evaluate the implementation and effectiveness of a theory-based, multi-compo-nent adaptive intervention in SDCs. The goal of the intervention was to increase the percent-age of children meeting the 60 min/d MVPA guideline while in attendance. This study is reported in accordance with the Transparent Reporting of Evaluations with Nonrandomized Designs (TREND) statement [17].
Methods
Study population, setting, and design
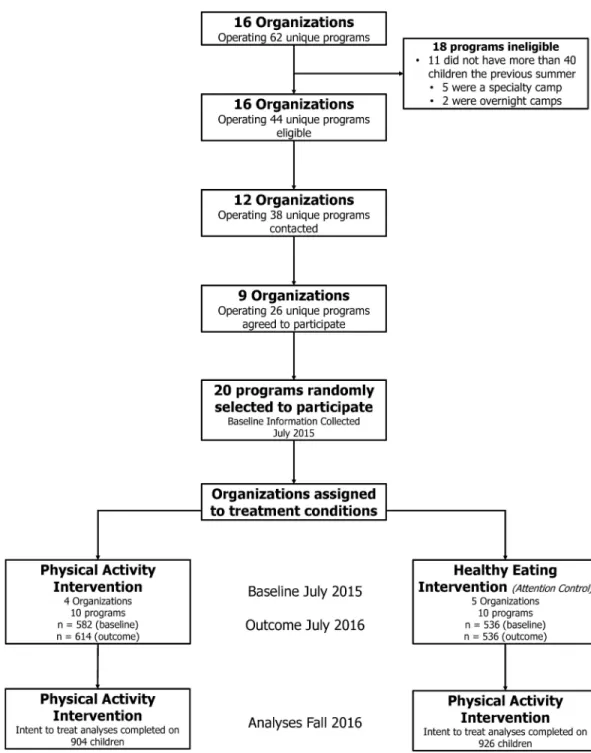
A total of 20 SDCs operated by nine organizations were recruited to participate in this study. SDCs were identified from a list of 62 unique SDCs operated by 16 organizations in one south-eastern U.S. state. The list of SDCs was compiled via internet searches for SDCs and summer programs operating within a 120-minute drive of the principal investigator’s (PIs) university. SDCs were defined as operating Monday-Friday, for at least 8 hours per day (8AM to 6PM), for a minimum of 8 weeks during the summer. Further, SDCs could not provide accommoda-tions for children to stay overnight and could not have a singular focus such as sports, arts, or academics. SDCs serving fewer than 40 children were also excluded from participation. Of the 62 SDCs identified 44 met inclusion criteria. Of the 18 that did not meet inclusion criteria, 11 did not serve at least 50 children, 5 were specialty SDCs, and 2 were overnight camps. Organi-zations were randomly selected from this list and invited to participate in the study. A total of nine organizations operating 26 unique programs agreed to participate. All children, staff, and SDC leaders at the participating SDCs were eligible to participate. However, children that were unable to engage in physical activity without an assistive device (e.g., wheelchair, crutches) were excluded from participation in the MVPA outcome assessment using accelerometry. See Table 1for complete details on the characteristics of the SDCs included in this study. All study procedures were approved by the University of South Carolina institutional review board.
The information presented herein represents the first year physical activity outcomes from baseline (summer 2015) to end of first year (summer 2016) of a three-year intervention. The study used a repeated cross-sectional, quasi-experimental design. This design is consistent with recent large scale interventions that target changes at a program level [18,19]. Following baseline data collection, the 20 SDCs were assigned to one of two conditions 1) physical activ-ity intervention 2) or healthy eating intervention (attention control).
Assignment to study arm
SDC organizations (a focus of the healthy eating intervention in the comparison group). Thus, organizations and their SDCs were equally divided based upon the separation of food provid-ers into two groups of 10 SDCs each and assigned to receive either the physical activity or healthy eating intervention. Participating SDCs were not blinded to which study arm they had been assigned.
Intervention
The intervention to meet the guideline of 60 min/d of MVPA [20] was guided by Strategies to Enhance Practice (STEP) framework [21], which is a multi-component competency building framework that was developed using principles of community-based participatory research [22], adaptive interventions [23], and systems frameworks [24] and is primarily driven by practical application of the strategies by practitioners in the framework. STEPs is a framework for identifying modifiable SDC components to increase children’s physical activity during SDC time. The STEPs model is conceptualized as a multi-step, adaptive process where founda-tional programmatic components essential to increasing attendee’s MVPA are identified and
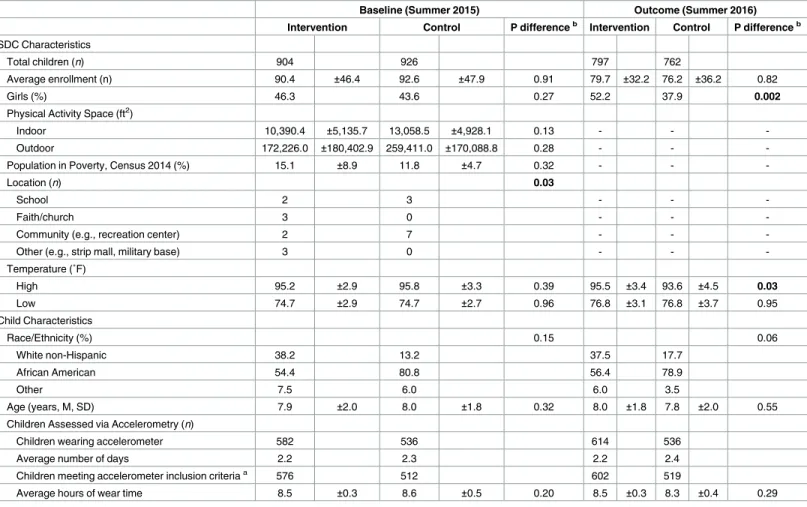
Table 1. Characteristics of participating summer day camps (SDCs) and children by intervention and control at baseline.
Baseline (Summer 2015) Outcome (Summer 2016)
Intervention Control P differenceb Intervention Control P differenceb
SDC Characteristics
Total children (n) 904 926 797 762
Average enrollment (n) 90.4 ±46.4 92.6 ±47.9 0.91 79.7 ±32.2 76.2 ±36.2 0.82
Girls (%) 46.3 43.6 0.27 52.2 37.9 0.002
Physical Activity Space (ft2)
Indoor 10,390.4 ±5,135.7 13,058.5 ±4,928.1 0.13 - -
-Outdoor 172,226.0 ±180,402.9 259,411.0 ±170,088.8 0.28 - -
-Population in Poverty, Census 2014 (%) 15.1 ±8.9 11.8 ±4.7 0.32 - -
-Location (n) 0.03
School 2 3 - -
-Faith/church 3 0 - -
-Community (e.g., recreation center) 2 7 - -
-Other (e.g., strip mall, military base) 3 0 - -
-Temperature (˚F)
High 95.2 ±2.9 95.8 ±3.3 0.39 95.5 ±3.4 93.6 ±4.5 0.03
Low 74.7 ±2.9 74.7 ±2.7 0.96 76.8 ±3.1 76.8 ±3.7 0.95
Child Characteristics
Race/Ethnicity (%) 0.15 0.06
White non-Hispanic 38.2 13.2 37.5 17.7
African American 54.4 80.8 56.4 78.9
Other 7.5 6.0 6.0 3.5
Age (years, M, SD) 7.9 ±2.0 8.0 ±1.8 0.32 8.0 ±1.8 7.8 ±2.0 0.55
Children Assessed via Accelerometry (n)
Children wearing accelerometer 582 536 614 536
Average number of days 2.2 2.3 2.2 2.4
Children meeting accelerometer inclusion criteriaa 576 512 602 519
Average hours of wear time 8.5 ±0.3 8.6 ±0.5 0.20 8.5 ±0.3 8.3 ±0.4 0.29
aAccelerometer inclusion criteria wear time240 minutes per day.
bP-value for comparison between intervention and control at baseline and outcome. Continuous variables at the SDC-level compared using two-sample
t-tests or Mann Whitney U-test where appropriate; categorical variables compared usingχ2 tests. Statistically significant differences are bolded.
modified. Importantly, STEPs allows for local tailoring to individual SDC needs, recognizing that no two SDCs are alike and different strategies or resources may be necessary for different SDCs to increase children’s MVPA. The model is also designed so that SDCs can enter into the process anywhere along a continuum of support. This allows for SDCs with varying levels of physical activity promotion to benefit from implementation of STEPs.
Strategies to increase children’s physical activity while in attendance at SDCs were guided by the Theory of Expanded, Extended, and Enhanced Opportunities [25]. This theory posits that the primary mechanism for increasing children’s accumulation of physical activity is through the provision of opportunities to be physically active. The Theory of Expanded, Extended, and Enhanced Opportunities includes three broad mechanisms for target by an intervention to increase children’s MVPA. These include: 1) expanding physical activity opportunities (i.e., adding new physical activity opportunities), 2) extending physical activity opportunities (i.e., allocating additional time for existing physical activity opportunities), and 3) enhancing physical activity opportunities (i.e., augmenting existing physical activity oppor-tunities to maximize the amount of physical activity youth accumulate). The utility of the The-ory of Expanded, Extended, and Enhanced Opportunities is in its practical application of identified mechanisms for increasing children’s MVPA in any setting, including summer SDCs.
In the Spring of 2016 (February-May), intervention staff met with all SDC program leaders to develop physical activity schedules. The objective was for programs to provide a minimum of three hours of scheduled physical activity time each day. The rationale for providing three hours was based on baseline data that showed, on average, children spent approximately 1/3 of time scheduled for physical activity engaged in MVPA [26]. Thus three hours are necessary to achieve the 60 min/d guideline. The primary intervention strategy to accomplish this goal was to extend existing physical activity opportunities to three hours, given all SDCs had PA oppor-tunities scheduled at baseline (summer 2015). When it was not possible to extend PA opportu-nities, SDCs were encouraged to expand PA opportunities by integrating PA into enrichment time through short activity breaks (e.g., energizers, brain breaks, etc.). SDCs were also encour-aged to expand PA opportunities by exchanging inactive field trips (e.g., movie theatre) for more active field trips (e.g., pool, park).
Finally, all staff employed at intervention SDCs participated in a single 90-minute profes-sional development training covering the topic of enhancing the amount of activity children accumulated during activity opportunities prior to the start of the SDC (May 2016). The pro-fessional development training was experiential in nature and founded on the integration of the LET US (i.e., line, elimination, team size, uninvolved staff/children, and space, equipment and rules) Play principles into common games in SDCs [27–31]. These principles help staff identify and modify components of commonly played games that may limit children’s physical activity. During training research staff played common games with SDC staff and identified ways to modify games in order to comply with the LET US Play principles.
Measures
Outcome evaluation. All measurement occurred during the summer of each project year
(July-August). Consistent with previously established protocols [26], children’s physical activ-ity was captured on four nonconsecutive unannounced days (Monday-Thursday). On these days ActiGraph accelerometers (version wGT3X-BT and Link—Shalimar, FL) were placed on children’s non-dominant wrist immediately upon arrival to the camp in the morning. The time each child received an accelerometer was recorded (arrival time) by research staff and children were allowed to participate in regularly scheduled activities throughout the SDC, including all water based (e.g., swimming, splash pad) activities. Prior to departure at the end of the day, research staff removed accelerometers from children and recorded the time (depar-ture time). Cutpoints associated with children’s MVPA (530 counts/5 seconds—[32]) and sedentary behaviors (<202 counts/5 seconds—[33]) were applied to distill the data using five second epochs. A valid day of wear time (departure time minus arrival time) was considered greater than 240 minutes, or attendance at the SDC for approximately half the day. SDCs were also visited on an additional two days at the beginning of summer (first two weeks of June) and two days at the end of summer (first two weeks of August) for height and weight measure-ments. During these visits children’s height (cm) and weight (kg) were measured using stan-dard protocols with children removing their shoes [34]. BMI was calculated and transformed into age and gender specific percentiles [35]. Demographics (i.e., age, race, sex) were also col-lected at this time. Assent was obtained from all children on each data collection day. Due to the observational nature of the data collected an opt-out protocol was used to obtain passive consent from participating children’s parents. Prior to data collection SDCs provided parents with informational fliers about the data collection procedures, and directions on how to opt out of the study.
Process evaluation. Process evaluation data were collected concurrently with outcome
data on each data collection day (i.e., the same four non-consecutive unannounced days). Imple-mentation of the Theory of Expanded, Extended, and Enhanced Opportunities components were measured via the System for Observing Staff Promotion of Activity and Nutrition (SOSPAN) [36]. Trained observers, which were blinded to all SDCs treatment condition, rotated through pre-defined target areas while completing continuous scans from the beginning (morning, ~7:30AM) until the end (afternoon, ~6:00PM) of the SDC. An average of 1,182 scans were col-lected at each SDC each summer across the 4 observation days. Training on the SOSPAN instru-ment included classroom sessions, video analysis, and field practice prior to data collection. Classroom sessions included orientation to the instrument, a review of study protocols, and com-mitting observational codes to memory. Video analysis included the review and rating of video clips from SDCs using established protocols. Field practice/reliability scans were completed on at least four days in SDCs that were not participating in the study (i.e. three hours per day) prior to the start of data collection. Inter-rater agreement criteria were set at>80% using interval-by-interval agreement for each category, and reliability was collected prior to measurement and each day of data collection [36,37]. Inter-observer reliability was estimated via percent agreement and weighted kappa (κw). Percent agreement ranged from 93.9–99.8% (median = 98.3) andκw ran-ged from 0.50–0.92 (median 0.77). Reliability was checked daily to identify disagreements. Opera-tional definitions of variables with borderline or low reliability (<90% agreement) were discussed with observers to ensure acceptable reliability and prevent observer drift.
Expand. Implementation of expanded physical activity opportunities was measured via
setting (e.g., during enrichment taking place in a classroom). Second, SDCs were encouraged to expand activity time in their field trips by replacing non-active field trips (e.g., movies) with active field trips (e.g., parks/playground, pools). A field trip was defined as any instance when children and counselors left the normal SDC location. Observers accompanied SDCs on field trips and noted the location, duration, and specific details of the activities.
Extend. To identify the amount of time SDCs allotted for physical activity and other SDC
scheduled activities (e.g., enrichment, meals/snacks) two methods were used. First, a schedule was collected from the SDC each observation day. Second, at the beginning of each SOSPAN scan data collectors indicated in what “context” the SDC was currently engaged. Possible con-texts included: meal or snack, enrichment, academics, physical activity, or other (transition, camp assembly, etc.). The percentage of scans completed within a given context was used to identify the percentage of a SDCs’ schedule allocated for each context. Percentage of scans in each context was compared to written SDC schedules to identify any discrepancies between written and observed schedules. When discrepancies occurred the observed time was used as the indicator of allotted program time.
Enhance. A total of 12 LET US Play principles were collected via SOSPAN during PA
opportunities. On each day of observation, the percentage of scans during physical activity opportunities were computed for the following: children waiting in line for turn, children eliminated, small sided-games, staff actively engaged in activity, staff verbally encouraging activity, staff leading an activity, choice of two or more activities offered, girl’s provided with their own physical activity opportunities, staff giving instructions on how to play games, chil-dren waiting for activity to start (i.e., idle time), staff withholding physical activity as punish-ment, and staff disciplining children with physical activity. The distribution of each of the LET US Play principle was divided into tertiles based on the 33rd and 66th percentile for the princi-ple at baseline. SDCs were assigned a one (<33rd centile), two (33rd to 66th centile), or three (>66th centile) for each principle. Scores were summed to represent an overall LET US Play implementation score at baseline and outcome (possible range of scores = 12–36 points).
Statistical analysis
Results
Outcome evaluation
Characteristics of the SDCs and children at baseline and outcome, along with the number of children enrolled and meeting the wear-time inclusion criteria, are presented inTable 1. &Fig 1details the flow of SDCs and children from recruitment to final outcome evaluation. Change in the percent of children meeting the 60 min/d guideline (primary outcome) and min/d in MVPA and sedentary are presented inTable 2.
Fig 1. Flow chart of participants for recruitment, data collection, and analyses.
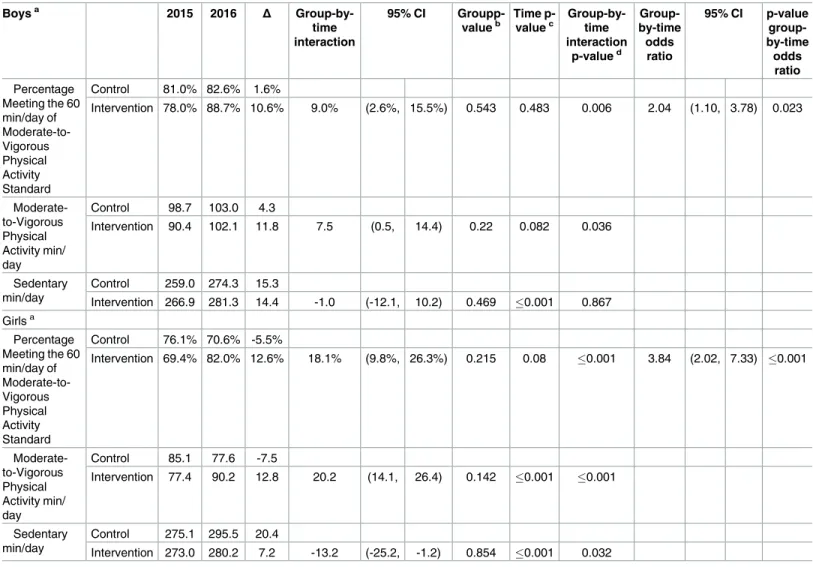
At outcome boys and girls attending the intervention camps were 2.04 (95CI 1.10, 3.78) and 3.84 (95CI 2.02, 7.33) times more likely to meet the 60 min/day guideline than boys and girls attending attention control camps, respectively. There were no significant main effects for group. For time there were significant main effects for boys and girls sedentary min/d, and girls MVPA min/d. These indicate that both boys and girls in intervention and control increased sedentary min/d from baseline to outcome and girls in both intervention and control increased MVPA min/d from baseline to outcome. For the group-by-time interaction there were significant main effects for the proportion of boys and girls meeting the MVPA guideline, the and the MVPA min/d. These differences favored the intervention. For girls there was also a significant main effect for sedentary min/d favoring girls at intervention SDCs. Thus, at out-come boys and girls attending the intervention SDCs were 2.04 value = 0.02) and 3.84 (p-value0.001) times more likely to meet the 60 min/d guideline than boys and girls attending
Table 2. Model implied and raw changes in physical activity levels of children during Summer Day Camp (SDC) program time.
Boysa 2015 2016 Δ
Group-by-time interaction
95% CI
Groupp-valueb Time p-valuec Group-by-time interaction p-valued Group-by-time odds ratio
95% CI p-value
group-by-time
odds ratio
Percentage Meeting the 60 min/day of Moderate-to-Vigorous Physical Activity Standard
Control 81.0% 82.6% 1.6%
Intervention 78.0% 88.7% 10.6% 9.0% (2.6%, 15.5%) 0.543 0.483 0.006 2.04 (1.10, 3.78) 0.023
Moderate-to-Vigorous Physical Activity min/ day
Control 98.7 103.0 4.3
Intervention 90.4 102.1 11.8 7.5 (0.5, 14.4) 0.22 0.082 0.036
Sedentary min/day
Control 259.0 274.3 15.3
Intervention 266.9 281.3 14.4 -1.0 (-12.1, 10.2) 0.469 0.001 0.867 Girlsa
Percentage Meeting the 60 min/day of Moderate-to-Vigorous Physical Activity Standard
Control 76.1% 70.6% -5.5%
Intervention 69.4% 82.0% 12.6% 18.1% (9.8%, 26.3%) 0.215 0.08 0.001 3.84 (2.02, 7.33) 0.001
Moderate-to-Vigorous Physical Activity min/ day
Control 85.1 77.6 -7.5
Intervention 77.4 90.2 12.8 20.2 (14.1, 26.4) 0.142 0.001 0.001
Sedentary min/day
Control 275.1 295.5 20.4
Intervention 273.0 280.2 7.2 -13.2 (-25.2, -1.2) 0.854 0.001 0.032
a
Estimates adjusted for age (years), camp enrollment, and race (White non-Hispanics vs. Other).
b
Statistically significant value would indicate intervention and control have different values at baseline.
c
Statistically significant value would indicate that values for intervention and control are changing over time.
d
Statistically significant value would indicate that intervention and control are changing differently over time (interpreted for intervention effect).
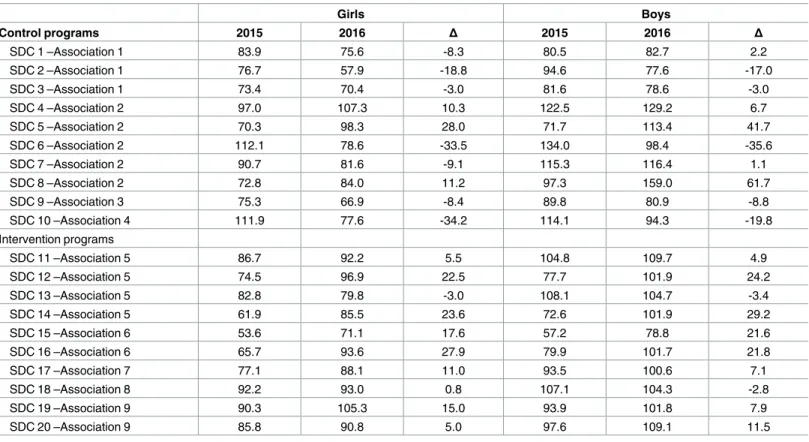
attention comparison SDCs, respectively. This increase in the likelihood of meeting the guide-line was driven by a 10.6% and 12.6% increase in the percent of boys and girls meeting the 60 min/d guideline, respectively, in intervention SDCs. Over the same time period a small increase in the percent of boys (+1.6%) and a decrease in the percent of girls (-5.5%) meeting the 60 min/d guideline was observed in attention control SDCs. Increases of 11.8 and 12.8 min/d of MVPA were observed for boys and girls attending the intervention SDCs, while an increase of 4.3 min/d of MVPA was observed for boys and a decrease of 7.5 min/d of MVPA was observed for girls in the attention control SDCs. Boys and girls in both intervention and attention control SDCs increased time sedentary from baseline to outcome. However, girls in intervention SDCs increased by 13.2 minutes less (7.2 vs. 20.4) than those in attention control SDCs. The time boys’ spent sedentary increased by 14.4 and 15.3 minutes from baseline to out-come in intervention and control SDCs, respectively. Change in the minutes of MVPA accu-mulated for each SDC is presented separately for boys and girls inTable 3. For boys, a total of 8 of the 10 intervention SDCs increased min/d of MVPA compared to 5 of the 10 attention control SDCs. Similarly, for girls, a total of 9 of the 10 intervention SDCs increased min/d of MVPA compared to 4 of the 10 attention control SDCs
Process evaluation
Implementation of expanded, extended, and enhanced physical activity opportunities are pre-sented inTable 4. Across both intervention and control SDCs, the total daily operating time increased from baseline to outcome by 37 and 38 minutes, respectively. Intervention SDCs
Table 3. Individual SDC changes.
Girls Boys
Control programs 2015 2016 Δ 2015 2016 Δ
SDC 1 –Association 1 83.9 75.6 -8.3 80.5 82.7 2.2
SDC 2 –Association 1 76.7 57.9 -18.8 94.6 77.6 -17.0
SDC 3 –Association 1 73.4 70.4 -3.0 81.6 78.6 -3.0
SDC 4 –Association 2 97.0 107.3 10.3 122.5 129.2 6.7
SDC 5 –Association 2 70.3 98.3 28.0 71.7 113.4 41.7
SDC 6 –Association 2 112.1 78.6 -33.5 134.0 98.4 -35.6
SDC 7 –Association 2 90.7 81.6 -9.1 115.3 116.4 1.1
SDC 8 –Association 2 72.8 84.0 11.2 97.3 159.0 61.7
SDC 9 –Association 3 75.3 66.9 -8.4 89.8 80.9 -8.8
SDC 10 –Association 4 111.9 77.6 -34.2 114.1 94.3 -19.8
Intervention programs
SDC 11 –Association 5 86.7 92.2 5.5 104.8 109.7 4.9
SDC 12 –Association 5 74.5 96.9 22.5 77.7 101.9 24.2
SDC 13 –Association 5 82.8 79.8 -3.0 108.1 104.7 -3.4
SDC 14 –Association 5 61.9 85.5 23.6 72.6 101.9 29.2
SDC 15 –Association 6 53.6 71.1 17.6 57.2 78.8 21.6
SDC 16 –Association 6 65.7 93.6 27.9 79.9 101.7 21.8
SDC 17 –Association 7 77.1 88.1 11.0 93.5 100.6 7.1
SDC 18 –Association 8 92.2 93.0 0.8 107.1 104.3 -2.8
SDC 19 –Association 9 90.3 105.3 15.0 93.9 101.8 7.9
SDC 20 –Association 9 85.8 90.8 5.0 97.6 109.1 11.5
All estimates are raw MVPA min/d means
increased the percentage of the daily schedule allocated for physical activity (i.e., extension) by 9.9% (~67 minutes), while control SDCs increased by 0.8% (~5 minutes). Observers accompa-nied SDCs on 38 field trips lasting for an average of two hours and 50 minutes (range = 45 minutes to 6 hours and 30 minutes) across both summers. Intervention SDCs went on eight active field trips at baseline and at outcome, while control SDCs took fewer active fieldtrips at outcome (n = 1) than at baseline (n = 3). The number of days that activity breaks were observed in intervention SDCs increased by 15 (1 at baseline to 16 at outcome) while activity breaks were observed on six more days in control SDCs (3 at baseline to 9 at outcome). Finally, seven of the 10 intervention SDCs increased their average LET US Play implementation score while only three of 10 control SDCs increased from baseline to outcome. This resulted in an average increase for intervention SDCs of +1.2 points (20.4 to 21.6) while control SDCs reduced their implementation score by -2.6 points (22.5 to19.9), from baseline to outcome.
Discussion
SDCs have tremendous potential to help the 14 million children[4] they serve annually in the U.S. meet their daily recommended 60 minutes of MVPA. This potential is recognized by sev-eral national organizations that have adopted standards calling for SDCs to provide children with all of their daily recommended 60 minutes of MVPA [1–3]. This study is among the first to evaluate the effects of a theory-based, multi-component intervention on the proportion of children meeting the MVPA guideline in the SDC setting. The intervention resulted in a greater likelihood for boys and girls to meet the MVPA guidelines, with eight of 10 interven-tion SDCs increasing the average minutes of MVPA accumulated by boys and nine of 10 inter-ventions SDCs doing the same for girls. Further, at outcome 88.7% of boys and 82.0% of girls in intervention SDCs were meeting the MVPA guideline, representing a 10.6% and 12.6% increase in the proportion of boys and girls, respectively, meeting the 60 MVPA min/d guide-line at outcome. If this increase was extrapolated to all 14 million children attending SDCs it would mean an additional 749,000 and 882,000 boys and girls respectively, would meet this
Table 4. Implementation of Expanded, Extended, and Enhanced Physical Activity Opportunities.
Intervention Control
Baseline Outcome Δ Baseline Outcome Δ
Expand
Total field trips (n) 12 13 1 9 4 -5
Active field trips (%) 8 8 0 3 1 -2
Total days activity breaks observed 1 16 15 3 9 6
Extend
Daily operating time (min) 635 673 38 617 654 37
Percentage of daily schedule allocated for:
Meal or Snack (%) 16.5% 14.4% -2.1% 16.6% 15.2% -1.4%
Enrichment (%) 46.9% 42.1% -4.8% 36.2% 42.2% +6.0%
Academics (%) 2.3% 1.7% -0.5% 3.6% 1.4% -2.2%
Other (%) 9.2% 6.7% -2.5% 9.5% 6.3% -3.3%
Physical Activity (%) 25.2% 35.1% +9.9% 34.1% 34.9% +0.8%
- Free play (%) 13.2% 19.8% +6.6% 14.8% 14.3% -0.5%
- Organized (%) 12.0% 15.3% +3.3% 19.3% 20.6% +1.3%
Enhance
LET US Play index score 20.4 21.6 1.2 22.5 19.9 -2.6
Number of programs that increased LET US Play index score 7 3
important public health guideline. These findings suggest that SDCs can play a major role in providing all children in attendance with their daily recommended amount of MVPA.
To the authors’ knowledge, this is the first large-scale intervention to target increasing attendee’s accumulation of MVPA at pre-existing SDCs. Previous interventions have targeted specific sub-groups, such as overweight or obese children [12–14] or low income adolescent girls [10] and were created and operated by research personnel [41,42]. While these interven-tions have been shown to positively influence health behaviors, their reach and sustainability over time is limited (i.e., once the grant funding ends the camp ends). Targeting pre-existing SDCs expands the potential reach and generalizability of interventions for this setting, since pre-existing SDCs are numerous, serve a diverse population of children, and have extensive contact time with the children attending [4].
This study was guided by the Theory of Expanded, Extended, and Enhanced Opportunities, which focuses on simple and practical strategies to increase children’s physical activity. The three main strategies were to: 1) expand physical activity opportunities (i.e., adding new physi-cal activity opportunities), 2) extend physiphysi-cal activity opportunities (i.e., allocating additional time for existing physical activity opportunities), and 3) enhance physical activity opportuni-ties (i.e., augmenting existing physical activity opportuniopportuni-ties to maximize the amount of physi-cal activity youth accumulate). Intervention SDCs successfully extended current physiphysi-cal activity opportunities with an average increase in scheduled time dedicated to physical activity of 9.9% (~67 minutes). Increases in the quality of activities offered were also observed with 7 intervention programs increasing their LET US Play index score from baseline to outcome. Intervention SDCs also successfully added activity breaks to their schedules (1 vs. 16 activity breaks observed from baseline to outcome). The strategies of expanding, extending, and enhancing physical activity opportunities appear to be in the control of staff and program lead-ers and readily modifiable with proper guidance and support. Further, the large increases in both boys and girls MVPA in intervention SDCs highlight the utility of these strategies to increase physical activity.
It is important to recognize that all SDCs, both intervention and control, provided substan-tial amounts of MVPA for both boys and girls prior to the intervention (seeTable 2). This is likely because SDCs are dedicating significant amounts of program time to physical activity opportunities. At baseline and outcome, control SDCs dedicated almost four hours per day to physical activity opportunities on average, with six programs dedicating three or more hours to physical activity. Intervention SDCs dedicated 2.6 hours to physical activity at baseline with only two programs dedicating more than three hours to physical activity. Correspondingly, on average, boys in intervention and control SDCs accumulated over 1.5 times the daily recom-mended amounts of MVPA, with girls in both treatment groups accumulating well over the 60-minute recommendation as well. This finding highlights the potential of the SDC setting for helping all children accumulate health enhancing levels of physical activity. Further, with minimal assistance, SDCs may be able to provide all attendees with their daily recommended amounts of MVPA. This is especially important as summer vacation is a “window of vulnera-bility” and is recognized as a period of extended time (typically 3 months) in which numerous negative effects on a child’s health can occur [5,8]. Identifying strategies to provide children access to SDCs and then providing support could play an important role in mitigating these negative health impacts.
MVPA of the children attending the intervention SDCs are likely due to the intervention. How-ever, there are important considerations that must be taken into account when interpreting the findings of this study. First, while there was a control group, SDCs were not randomized to intervention condition. Randomization was intended but not possible due to the constraints of working with multiple camps serviced by the same food provider. Further, while the sample was large and diverse, it was restricted to camps in one southeastern U.S. state.
Conclusions
The results of this repeated cross-sectional quasi-experimental study suggest that the STEPs approach is promising for assisting SDCs in their attempt to meet physical activity guidelines. SDCs are an important setting for providing children with health enhancing levels of MVPA, and, with additional support, camps have the potential to provide all children attending 60 minutes of MVPA per day.
Supporting information
S1 File. Institutional Review Board Approval Letter.
(PDF)
S2 File. Study Protocol.
(DOCX)
S3 File. Clinical Trials Registration Information.
(PDF)
S4 File. Trend Checklist.
(PDF)
Acknowledgments
We would like to acknowledge the SDC staff and program leaders at our participant SDCs for their support of this project. Without their dedication to the health of the children they serve this project would not have been possible.
Author Contributions
Conceptualization: RGW KB JC GT JM JH DW.
Data curation: RGW KB JC MB.
Formal analysis: RGW MB.
Funding acquisition: RGW MB GT JM DW.
Investigation: RGW MB KB JC.
Methodology: RGW MB GT JM JH DW.
Project administration: RGW MB KB JC.
Resources: RGW MB KB JC.
Software: RGW MB KB JC.
Visualization: RGW MB.
Writing – review & editing: RGW KB JC GT JM JH DW.
References
1. YMCA of the USA. Choices Within Limits: Healthy Eating and Physical Activity Standards: YMCA of the USA; 2014 [Available from:http://www.ymca.net/hepa/standards/.
2. Boys & Girls Clubs of America. Boys & Girls Clubs of America and National Recreation and Park Asso-ciation Join Partnership for a Healthier America: Creating a Healthier Environments for Five Million Kids 2015 [Available from:http://www.bgca.org/newsevents/PressReleases/Pages/
PartnershipForAHealthierAmerica.aspx.
3. National Recreation and Parks Association. Commit to Health 2015 [Available from:http://www.nrpa. org/committohealth/.
4. American Camp Association. Camp Trends Fact Sheet. 2016 [Available from:http://www.acacamps. org/media-center/camp-trends/fact.
5. von Hippel PT, Powell B, Downey DB, Rowland NJ. The effect of school on overweight in childhood: gain in body mass index during the school year and during summer vacation. Am J Public Health. 2007; 97(4):696–702.https://doi.org/10.2105/AJPH.2005.080754PMID:17329660
6. von Hippel PT, Workman J. From Kindergarten Through Second Grade, US Children’s Obesity Preva-lence Grows Only During Summer Vacations. Obesity. 2016; 24(11):2296–300.https://doi.org/10.1002/ oby.21613PMID:27804271
7. Carrel AL, Clark RR, Peterson S, Eickhoff J, Allen DB. School-based fitness changes are lost during the summer vacation. Arch Pediatr Adolesc Med. 2007; 161(6):561–4.https://doi.org/10.1001/archpedi. 161.6.561PMID:17548760
8. Gutin B, Yin Z, Johnson M, Barbeau P. Preliminary findings of the effect of a 3-year after-school physi-cal activity intervention on fitness and body fat: The Mediphysi-cal College of Georgia Fitkid Project. Interna-tional Journal Of Pediatric Obesity: IJPO: An Official Journal Of The InternaInterna-tional Association For The Study Of Obesity. 2008; 3 Suppl 1:3–9.
9. Beets MW, Morgan CF, Banda JA, Bornstein D, Byun W, Mitchell J, et al. Convergent validity of pedom-eter and accelerompedom-eter estimates of moderate-to-vigorous physical activity of youth. J Phys Act Health. 2011; 8(Suppl 2):S295–S305.
10. Baranowski T, Baranowski JC, Cullen KW, Thompson DI, Nicklas T, Zakeri IE, et al. The Fun, Food, and Fitness Project (FFFP): the Baylor GEMS pilot study. Ethn Dis. 2003; 13(1 Suppl 1):S30–9.
11. Barrett JL, Cradock AL, Gortmaker SL, Lee RM, Giles CM, Malsberger BA. Accelerometer Assessment of Children’s Physical Activity Levels at Summer Camps. Active Living Research Annual Conference; San Diego, CA2014.
12. Huelsing J, Kanafani N, Mao J, White NH. Camp jump start: effects of a residential summer weight-loss camp for older children and adolescents. Pediatrics. 2010; 125(4):e884–90.https://doi.org/10.1542/ peds.2009-1007PMID:20194273
13. Wong WW, Abrams SH, Mikhail C, Terrazas NL, Wilson TA, Arceo D, et al. An innovative summer camp program improves weight and self-esteem in obese children. J Pediatr Gastroenterol Nutr. 2009; 49(4):493–7.https://doi.org/10.1097/MPG.0b013e31819b5da2PMID:19590448
14. Gately PJ, Cooke CB, Butterly RJ, Mackreth P, Carroll S. The effects of a children’s summer camp pro-gramme on weight loss, with a 10 month follow-up. Int J Obes Relat Metab Disord. 2000; 24(11):1445– 52. PMID:11126341
15. Weaver R, Beets M, Saunders R, Beighle A. A Coordinated Comprehensive Professional Development Training’s Effect on Summer Day Camp Staff Healthy Eating and Physical Activity Promoting Behav-iors. Journal of physical activity & health. 2014; 11(6):1170–8.
16. Weaver RG, Beets MW, Turner-Mcgrievy G, Webster CA, Moore J. Effects of a Competency-Based Professional Development Training on Children’s Physical Activity and Staff Physical Activity Promotion in Summer Day Camps. New directions for youth development. 2014; 2014(143):57–78.https://doi.org/ 10.1002/yd.20104PMID:25530241
17. Des Jarlais DC, Lyles C, Crepaz N. Improving the reporting quality of nonrandomized evaluations of behavioral and public health interventions: the TREND statement. American journal of public health. 2004; 94(3):361–6. PMID:14998794
19. Webber LS, Catellier DJ, Lytle LA, Murray DM, Pratt CA, Young DR, et al. Promoting physical activity in middle school girls: Trial of Activity for Adolescent Girls. Am J Prev Med. 2008; 34(3):173–84.https:// doi.org/10.1016/j.amepre.2007.11.018PMID:18312804
20. Wiecha JL, Gannett L, Hall G, Roth BA. National Afterschool Association Standards for Healthy Eating and Physical Activity in Out-Of-School Time Programs Wellesley, MA2011 [Available from:http://www. niost.org/images/host/Healthy_Eating_and_Physical_Activity_Standards.pdf.
21. Beets MW, Weaver RG, Turner-McGrievy G, Huberty J, Ward D, Freedman DA, et al. Making Healthy Eating and Physical Activity Policy Practice: The Design and Overview of a Group Randomized Con-trolled Trial in Afterschool Programs. Contemporary Clinical Trials. 2014; 38(2):291–303.https://doi. org/10.1016/j.cct.2014.05.013PMID:24893225
22. Israel BA, Coombe CM, Cheezum RR, Schulz AJ, McGranaghan RJ, Lichtenstein R, et al. Community-based participatory research: a capacity-building approach for policy advocacy aimed at eliminating health disparities. Journal Information. 2010; 100(11).
23. Collins LM, Murphy SA, Bierman KL. A conceptual framework for adaptive preventive interventions. Prev Sci. 2004; 5(3):185–96. PMID:15470938
24. Foster-Fishman PG, Nowell B, Yang H. Putting the system back into systems change: a framework for understanding and changing organizational and community systems. Am J Community Psychol. 2007; 39(3–4):197–215.https://doi.org/10.1007/s10464-007-9109-0PMID:17510791
25. Beets MW, Oakley A, Weaver RG, Webster CA, Lubans D, Brusseau TA, et al. The Theory of Expanded, Extended, and Enhanced Opportunities for Youth Physical Activity Promotion. Int J Behav Nutr Phy. in press.
26. Brazendale K, Beets MW, Weaver RG, Chandler JL, Randel AB, Turner-McGrievy G, et al. Children’s moderate-to-vigorous physical activity attending summer day camps. American Journal of Preventive Medicine. in review.
27. Weaver RG, Beets MW, Saunders RP, Beighle A. A coordinated comprehensive professional develop-ment training’s effect on summer day camp staff healthy eating and physical activity promoting behav-iors. Journal of physical activity & health. 2014; 11(6):1170.
28. Beets MW, Weaver RG, Moore JB, Turner-McGrievy G, Pate RR, Webster C, et al. From Policy to Prac-tice: Strategies to Meet Physical Activity Standards in YMCA Afterschool Programs. Am J Prev Med. 2014; 46(3):281–8.https://doi.org/10.1016/j.amepre.2013.10.012PMID:24512867
29. Beets MW, Weaver RG, Turner-McGrievy G, Huberty J, Ward D, Freedman DA, et al. Making Healthy Eating and Physical Activity Policy Practice: The Design and Overview of a Group Randomized Con-trolled Trial in Afterschool Programs. Contemporary Clinical Trials. in press.
30. Weaver RG, Beets MW, Saunders R, Webster C, Beighle A. A Comprehensive Professional Develop-ment Training’s Effect on Afterschool Program Staff Behaviors to Promote Healthy Eating and Physical Activity. Journal Public Health Management and Practice. in press.
31. Weaver RG, Beets MW, Webster C. LET US Play: Maximizing children’s physical activity in physical education. Strategies. in press.
32. Chandler J, Brazendale K, Beets M, Mealing B. Classification of physical activity intensities using a wrist-worn accelerometer in 8–12-year-old children. Pediatric obesity. 2015.
33. Chandler JL, Beets MW, Saint-Maurice P, Weaver RG, Cliff DP, Drenowatz C, et al. Wrist-Based Accel-erometer Counts during Sedentary Activities in 5–11 year olds. Pediatric Obesity. in review.
34. Ogden CL, Carroll MD, Kit BK, Flegal KM. Prevalence of Obesity and Trends in Body Mass Index Among US Children and Adolescents, 1999–2010. Jama-Journal of the American Medical Association. 2012; 307(5):483–90.
35. Kuczmarski R, Ogden C, Guo S, Grummer-Strawn L, Flegal K, Mei Z, et al. CDC growth charts for the US: methods and development. Vital Health Stat. 2002; 11(246):1–190.
36. Weaver R, Beets M, Webster C, Huberty J. System for Observing Staff Promotion of Activity and Nutri-tion (SOSPAN). Journal of physical activity & health. 2014; 11(1):173–85.
37. McKenzie T. SOFIT-System for observing fitness instruction time: SOFIT Protocol. San Diego, CA: San Diego State University. 2009.
38. Trost SG, Rosenkranz RR, Dzewaltowski D. Physical activity levels among children attending after-school programs. Med Sci Sports Exerc. 2008; 40(4):622–9.https://doi.org/10.1249/MSS. 0b013e318161eaa5PMID:18317385
40. Beets MW, Huberty J, Beighle A. Physical Activity of Children Attending Afterschool Programs Research- and Practice-Based Implications. Am J Prev Med. 2012; 42(2):180–4.https://doi.org/10. 1016/j.amepre.2011.10.007PMID:22261215
41. Hopkins L, Rose A, Gunther C. Camp NERF: Feasibility, Acceptability, and Potential Efficacy of a The-ory-Based Nutrition Education Recreation and Fitness Program Aimed at Preventing Unhealthy Weight Gain in Disadvantaged Children during Summer Months. The FASEB Journal. 2015; 29(1
Supplement).