GENETIC REGULATION OF EPIGENETIC PROCESSES IN MOUSE: DNA METHYLATION AND X CHROMOSOME INACTIVATION
John Douglas Calaway
A dissertation submitted to the faculty of the University of North Carolina at Chapel Hill in partial fulfillment of the requirements for the degree of Doctor of Philosophy in the
Curriculum in Genetics and Molecular Biology.
Chapel Hill 2014
Approved by:
Fernando Pardo-Manuel de Villena Corbin Jones
ABSTRACT
John Douglas Calaway: GENETIC REGULATION OF EPIGENETIC PROCESSES IN MOUSE: DNA METHYLATION AND X CHROMOSOME INACTIVATION
(Under the direction of Fernando Pardo-Manuel de Villena)
Epigenetics is the study of inheritance not encoded by primary DNA sequence. In mammals, epigenetic processes are required for proper development, gene regulation, chromosome function (e.g., X-chromosome inactivation (XCI)), and genome stability. Misregulation of epigenetic processes is typically a hallmark of disease. Epigenetic marks vary depending on genomic position, cell type, environment, time, sex, and even between individuals within a population. Genetic variation is one source of epigenetic variability that has only recently been appreciated. It is unknown how prevalent and to what extent underlying genetic variation influences epigenetic variability, and
furthermore, how this epigenetic variability contributes to phenotypic variation within a population. It has been postulated that epigenetic variation between individuals may help solve the ‘missing heritability’ problem.
that these strain-specific cis-acting loci also influence a parent-of-origin differentially methylated region in the 3’UTR of the Actn1 gene, which suggests that genetic variation might also influence highly conserved imprinted regions as well.
In the second section, I mapped a cis-acting locus called the X-chromosome
controlling element (Xce) that influences XCI choice in mouse. I reduced the Xce candidate interval to a 176 kb region located approximately 500 kb proximal to Xist. I extensively characterized the genetic architecture of the new candidate interval in over 300 inbred and wild-caught mice. I conclude that each mouse taxa examined has a different functional Xce allele and there is no sharing. I identified two new Xce alleles (Xcee and Xcef) that bring the
number to six functional alleles in Mus. I propose that structural variation of segmental duplications within this interval explains the presence of multiple functional Xce alleles.
ACKNOWLEDGMENTS
I would like to thank:
My thesis advisor Fernando Pardo-Manuel de Villena for his unyielding support, generosity and guidance throughout the course of my doctoral research
My family and friends for their love and support
TABLE OF CONTENTS
LIST OF TABLES...x
LIST OF FIGURES ... xi
LIST OF ABBREVIATIONS ... xiii
Chapter: I. INTRODUCTION...1
The genetic regulation of epigenetics ...2
II. GENOME-WIDE DIFFERENTIAL METHYLATION PATTERNS IN INTERSUBSPECIFIC HYBRID MICE ...5
DNA methylation is variable ...6
Local DNA effects on cytosine methylation...6
Experimental design...8
Mouse as a model for the genetic regulation of cytosine methylation...9
RESULTS ... 12
Global MSNP analysis ... 12
Allele-specific analysis of mouse brain DNA reveals strain and parent-of-origin differences in methylation ... 15
Functional relevance of strain-specific DMRs ... 17
DISCUSSION ... 20
MATERIALS AND METHODS ... 24
III. INTRONIC PARENT-OF-ORIGIN DEPENDENT DIFFERENTIAL
METHYLATION AT THE ACTN1 GENE IS CONSERVED IN RODENTS
BUT IS NOT ASSOCIATED WITH IMPRINTED EXPRESSION... 33
RESULTS ... 33
A novel Actn1 DMR has preferential maternal methylation in diverse mouse tissues ... 33
Actn1 DMR extent and conservation in murine rodents ... 36
Expression studies of Actn1 do not reveal imprinting effects ... 40
DISCUSSION ... 41
MATERIALS AND METHODS ... 44
SUPPORTING MATERIAL... 48
IV. GENETIC ARCHITECTURE OF SKEWED X INACTIVATION IN THE LABORATORY MOUSE ... 56
X chromosome inactivation (XCI): a paradigm of genetic-epigenetic regulation... 57
XCI choice ... 59
Genetics of XCI choice: The X chromosome controlling element (Xce)... 60
Parent-of-origin effects, autosomal modifiers and secondary skewing ... 62
Challenges of mapping Xce ...63
RESULTS ... 64
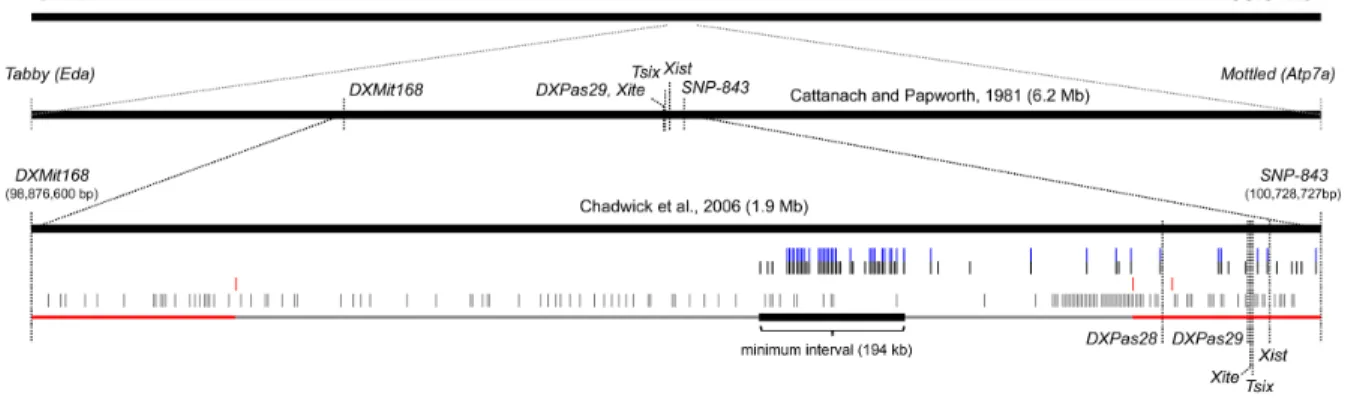
Association mapping based on public data narrows the Xce candidate interval to 194 kb ... 64
XCI skewing in experimental F1 hybrids derived from inbred strains within unknown Xce ...67
Analysis of the Xce candidate interval reveals a set of segmental duplications associated with each functional Xce allele ... 70
Phylogenetic analysis of the Xce candidate interval ... 74
Maternal inheritance of the strong Xce allele magnifies XCI skewing... 77
DISCUSSION ... 79
SUPPORTING MATERIAL... 90
V. SUMMARY AND FUTURE DIRECTIONS ... 98
Sequence variation and parent-of-origin DMRs ... 98
Ongoing work: An optimized MSNP protocol to investigate additional variables affecting DNA methylation in mouse ... 101
The Xce candidate interval... 105
Xce allelic series... 107
The evolution of the Xce allelic series ... 109
How our results fit the current model of XCI ... 109
Modeling XCI choice ... 111
Phenotypic consequences of skewed XCI ... 114
Ongoing work: sequence characterization of the Xce candidate interval... 115
Ongoing work: Mapping parent-of-origin and autosomal modifiers... 119
The genetics of epigenetics ... 121
MATERIALS AND METHODS ... 122
LIST OF TABLES
LIST OF FIGURES
2-1. F1 hybrids as a tool for discovering cis-acting variants that direct
DNA methylation ...7
2-2. Experimental design ...9
2-3. Classification of MDA probes according to the CpG methylation status of tagged HpaII sites ... 14
2-4. Global and allele-specific maps of methylation patterns in the mouse brain ... 15
2-5. Functional analysis of strain-specific DMRs ... 19
3-1. Maternal methylation of a novel DMR at the Actn1 genein diverse mouse tissues ... 35
3-2. Bisulfite sequencing analysis of the Actn1 DMR in mouse, rat and human tissues... 37
3-3. Actn1 allelic expression analysis by SNuPE... 39
3-4. Mouse Actn1 isoforms... 40
4-1. Global analysis of X inactivation and dosage compensation... 57
4-2. The Xce allelic series... 61
4-3. Inbred mouse strains with known Xce phenotype and their phylogenetic relationship ... 65
4-4. The Xce candidate interval based on historical data ... 66
4-5. Allelic imbalance in selected female F1 hybrids ... 70
4-6. Sequence analysis of the candidate interval ... 72
4-7. Principal component analysis of Xce MegaMUGA probes ... 73
4-8. Natural history of Xce... 76
4-8. Maternal inheritance magnifies XCI skewing... 77
5-1. Genes imprinted in the mouse brain... 100
5-2. Experimental design ... 103
5-3. Global differences in DNA methylation at 26-weeks of age... 103
5-5. How Xce fits into the current XCI choice mechanism ... 110
5-6. Factors influencing XCI choice ... 113
5-7. X chromosome-wide allelic imbalance as a results of XCl skewing ... 115
5-8. Map of BACs that span the candidate interval... 116
5-9. Mapping the parent-of-origin effect... 120
LIST OF ABBREVIATIONS
BAC BACTERIAL ARTIFICIAL CHROMOSOME
BP BASE PAIR(S)
CNV COPY NUMBER VARIATION
CpG CYTOSINE PHOSPHODIESTER GUANINE
DMR DIFFERENTIALLY METHYLATED REGION
µg MICROGRAM
MDA MOUSE DIVERSITY ARRAY
MSNP METHYLATION-SENSITIVE SINGLE NUCLEOTIDE
POLYMORPHISM ANALYSIS
MS-RFLP METHYLATION-SENSITIVE RESTRICTION FRAGMENT LENGTH POLYMORPHISM
PCA PRINCIPAL COMPONENT ANALYSIS
PCR POLYMERASE CHAIN REACTION
PoO PARENT-OF-ORIGIN
eQTL EXPRESSED QUANTITATIVE TRAIT LOCUS
SD SEGMENTAL DUPLICATION
SDP STRAIN DISTRIBUTION PATTERN
SNP SINGLE NUCLEOTIDE POLYMORPHISM
eSNP EXPRESSED SINGLE NUCLEOTIDE POLYMORPHISM
UTR UNTRANSLATED REGION
Xce X CHROMOSOME CONTROLLING ELEMENT
XCI X CHROMOSOME INACTIVATION
CHAPTER I: INTRODUCTION
Epigenetics is the study of inheritance that is not encoded by primary DNA
sequence. It encompasses a wide-range of biological processes and involves a diverse set of molecular players that include DNA methylation, histone post-translational modification, microRNA, long non-coding RNA, and prions [5-8]. In mammals, epigenetics is required for a single cell to give rise to a complex, multicellular organism through dynamic regulation of gene expression. Furthermore, epigenetics has additional roles in determining and
maintaining the functional architecture of genomes and chromosomes (e.g., X chromosome inactivation (XCI)) [9, 10]. Accordingly, aberrant epigenetic regulation is associated with many human diseases, including cancer [8].
Epigenetics is context specific and varies depending on genomic position, cell type, environment, time, sex, and between individuals within a population. This poses
impacted most major fields of biology including practical applications in both medicine and
1
agriculture [16-19].
2
The genetic regulation of epigenetics
3
Like two sides of a coin, the functional role of mammalian genomic DNA is
4
incomplete without also considering its epigenetic component and viceversa. Both DNA and
5
epigenetic players act in concert to bring about the complex genic regulation required for
6
proper development and homeostasis [7]. Thus it stands to reason that changes in one may
7
elicit a change in the other. Mutations in DNA sequence encoding epigenetic machinery
8
have drastic and obvious effects, for example, deletions of methyl transferases have
9
genome-wide effects on CpG methylation [20-22]. On the other hand, redundant epigenetic
10
mechanisms are in place to maintain the structural integrity of the genome [23, 24]. Without
11
such mechanisms, transposable elements would proliferate unchecked [25]. In fact, these
12
epigenetic mechanisms guard the genome during chromosome segregation, recombination,
13
and double strand break repair and are key for faithful transmission of the genome from one
14
generation to the next [26]. Although these examples provide evidence of the critical link
15
between DNA sequence and epigenetics, they do not provide insight into how changes in
16
underlying DNA sequence influence epigenetics. In other words, understanding the role
17
genetic variation plays in epigenetic variability within a population. In its broadest sense, this
18
work aims to investigate how DNA sequence variability impacts epigenetics by means of two
19
epigenetic processes: DNA methylation and XCI. Some important questions for the genetic
20
regulation of epigenetics are: To what extent does genetic variability within a population
21
influence epigenetics and impact epigenetic variability? And ultimately, what effect does
22
epigenetic variability have on phenotypic variability?
23
In the first section (Chapters II and III), I demonstrate that differentially methylated
24
regions (DMRs) are determined by genetic variation in cis. The DMRs are found genome-
25
sequence variation on DNA methylation in the mouse is pervasive with an estimated 13,000
27
differentially methylation CpGs genome-wide. Furthermore, there is an enrichment of DMRs
28
found near transcription start sites that may indicate a functional role in differential gene
29
expression. Based on my results using two inbred mouse lines (129S1/SvlmJ and
30
PWK/PhJ) that capture only a small fraction of the genetic diversity in Mus musculus (~1/3).
31
I conclude thatlocal DNA sequence variation contributes to substantial genome-wide DNA
32
methylation variation in mouse than previously thought [27]. However, it is clear that the
33
functional significance of these DMRs needs to be determined before conclusions can be
34
drawn regarding their contribution to true phenotype variation. I further demonstrate that
35
local genetic variation affects differential methylation at a maternally methylated region in
36
the 3’UTR of Actn1 in mouse. I show that parent-of-origin DMRs are influenced by local DNA
37
sequence and speculate that genetic variation within DMRs at imprinting control regions
38
may in fact alter expression at imprinted regions.
39
In the second section (Chapters IV and V), I examine the genetic regulation of XCI
40
choice by mapping and characterizing a cis-acting locus called the X-chromosome
41
controlling element (Xce). By using a combination of historical phenotyping data and new
42
mouse genetic resources [1, 2], I narrowed the Xce candidate interval 10-fold to a region
43
that lies 500 kb proximal to Xist, thereby excluding Xite, Xist, and Tsix as Xce candidates.
44
It is thought that Xce serves as a trans-factor binding site that determines which X
45
chromosome will undergo XCI, a multistep epigenetic process that functionally inactivates
46
an entire X chromosome [28]. I show that the new Xce candidate interval contains a series
47
of segmental duplications and an inversion in the C57BL/6J reference assembly. I postulate
48
that the different functional alleles of Xce in Mus can be explained by structural variation
49
within the segmentally duplicated regions.
50
Furthermore, I investigated the genetic architecture of the new Xce candidate interval
51
mice. I conclude that each species or subspecies of mouse appears to have its own
53
functional Xce allele. XCI skewing is common in the laboratory mouse, and the degree of
54
XCI skewing, determined by genetics alone, might reach complete skewing in favor of one X
55
CHAPTER II: GENOME-WIDE DIFFERENTIAL METHYLATION PATTERNS IN
57
INTERSUBSPECIFIC HYBRID MICE1
58
59
60
BACKGROUND AND INTRODUCTION
61
62
DNA methylation is an epigenetic process that covalently binds a methyl group to a
63
DNA base [30]. At the molecular level, methylated DNA may affect the binding of cellular
64
machinery [30, 31], influence the positioning of nucleosomes [32], and even change the
65
shape of DNA itself [33]. There are examples of DNA methylation utilized in all three major
66
branches of life [34]. Mammalian DNA methylation is predominantly 5-methylcytosine within
67
the context of a CpG dinucleotide motif (mCpG). 5-methylcytosine does exist outside of the
68
CpG motif, albeit limited and primarily restricted to early development [35]. mCpG is a key
69
epigenetic mark that plays a critical role in development and cell differentiation [32, 36], XCI
70
[31, 37], tr1ansposon silencing [38], tumorigenesis [39], and overall genomic stability [40]. As
71
with other critical epigenetic marks, disruption of normal methylation patterns has severe
72
phenotypic consequences [41-43].
73
1 The following chapter describes work done in collaboration with Dr. Hyuna Yang, Dr. Elena de la Casa-Esperon, Dr. David L. Aylor, Dr. Leonard McMillan, Dr. Gary A. Churchill, and Dr.
DNA methylation is variable
74
DNA methylation is dynamic and varies widely during development with global
75
changes in methylation during the pre-implantation stages [44, 45]. Changes in DNA
76
methylation have also been associated with aging [14, 46]. Furthermore, multiple
77
environmental stimuli might also lead to changes in mCpG and there is a growing interest in
78
the intersection of epigenetics and toxicology [13, 46]. It is well established that local
79
variation in methylation along chromosomes plays a significant role in functional regulation
80
of gene expression [47-49]. In some cases, such is XCI, gene bodies are hypermethylated
81
on the active X chromosome while promoter elements are hypermethylated on the inactive
82
X chromosome [50, 51]. Methylation is also strongly associated with genomic imprinting
83
and the methylation status at the same CpG in two homologous chromosomes from a single
84
cell may vary depending on their parent-of-origin [52].
85
Local DNA effects on cytosine methylation
86
Variation in mCpG is observed among individuals from a population [27, 53]. Studies
87
of monozygotic and dizygotic twins reveal that genetic variation is a major driver of mCpG
88
variation among individuals [15, 54-56], although there is contention of whether DNA
89
sequence or environmental factors play a larger role [57]. In a previous study by Schilling
90
and coauthors [27], C57BL/6J and BALB/cJ reciprocal F1 hybrid mice were used to detect
91
allele-specific methylation. Importantly, allele-specific methylation in F1 hybrids requires cis-
92
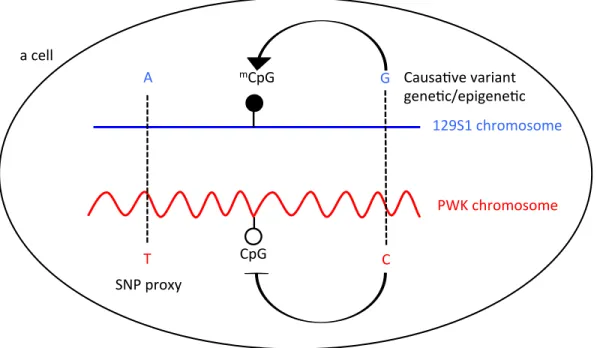
acting DNA sequence or epigenetic differences (Figure 2-1). The authors discovered that
93
differentially methylated regions (DMRs) are primarily genetic-driven (strain effect) and act in
94
cis. Furthermore, functional analysis demonstrated that strain-specific DMRs influence
95
nearby gene expression levels. In fact, their results indicate that inter-individual variation in
96
epigenetic marks may contribute to phenotypic variation and also help explain missing
97
heritability [58]. Ultimately, the identification and functional annotation of variable
98
[59, 60]. And yet, despite the increased interest in population variation of DNA CpG
100
methylation, the genetic regulation of epigenetics remains in its infancy.
101
This study aims to address some basic questions including: How prevalent is the role
102
that local genetic variation plays in variation of mCpG; how much mCpG variation can be
103
ascribed to genetic variation (strain effects) versus imprinting (parent-of-origin effects); and
104
is methylation variable depending on sex?
105
106
Figure 2-1. F1 hybrids as a tool for discovering cis-acting variants that direct DNA
107
methylation. Shown is a cell from an F1 hybrid between mouse strains 129S1/SvlmJ and
108
PWK/PhJ. Both parental chromosomes (blue, 129S1 and red, PWK) are exposed to the
109
same cellular environment that includes trans-factors. Therefore, differential methylation
110
requires a cis causative variant (genetic or epigenetic) that distinguishes the two
111
chromosomes from one another.
112
113
!"#$%
&'()&%*+,-!-.-!/%
012%*+,-!-.-!/%
3%
4%
)50%#,-67%
"89.8:;/%;8,<8=>% ?/=/:*@/#<?/=/:*% 8%*/AA%
$%
"%
Experimental Design
113
Any study aimed to answer these questions will confront several early decisions that
114
might impact the conclusions reached including: the platform used to examine mCpG, the
115
selection of organism, experimental design, and tissue(s) and/or developmental stage. In
116
the following paragraphs we briefly outline the rationale behind our choices.
117
Ideally, one would like to select a platform that estimates quantitative methylation at
118
individual CpGs within a large dynamic range in an allele-specific manner. This latter
119
requirement is critical to partition methylation levels according the genotype and the parent-
120
of-origin that requires the presence of a closely linked informative variant to the
121
corresponding CpG. The platform would interrogate as many CpGs as possible evenly
122
distributed across the genome, and residing within or near functional elements. Lastly, the
123
platform would be cost effective to allow the analysis of many biological replicates. A
124
technique was developed that satisfies many of these requirements called Methylation-
125
sensitive Single Nucleotide Polymorphism analysis (MSNP) [53, 61]. MSNP was described
126
and applied to Affymetrix human genotyping arrays that use endonucleases to fragment
127
genomic DNA followed by PCR amplification of those fragments to create a genomic library.
128
MSNP exploits the amplification step by first introducing a methylation-sensitive
129
endonuclease digestion. To determine allele-specific methylation, this method compares
130
buffer treated samples to HpaIItreated samples and looks for SNPs that shift from
131
heterozygosity to homozygosity in favor of the methylated allele [61]. Additionally, MspI
132
digestion is used a positive control. Our laboratory has developed a high-density Affymetrix
133
genotyping array for the mouse, the Mouse Diversity Array (MDA) [62]. The MDA is
134
particularly well suited to extend MSNP to the mouse because of the high density and
135
uniform distribution of SNP probes sets (>600K) that target the genetic variation of
136
laboratory mouse stocks [1]. MDA has the added value of the presence of over 900K exon
137
specific information to these probes, we can estimate the level of mCpG associated with
139
these genomic targets.
140
141
142
Mouse as a model for the genetic regulation of cytosine methylation
143
Given our focus on mammalian epigenetics, the mouse is an obvious model
144
organism. An often-cited advantage of the laboratory mouse is the availability of a large
145
collection of well-characterized inbred strains with a wide range of genetic diversity in pair
146
wise comparisons. By crossing two inbred strains, researchers can generate the desired
147
number of reciprocal F1 hybrids that for the autosomes only differ in the parental origin of
148
each pair of homologues. The ability of replicate genomes can be combined with
149
!"#$!%&'
()*+($+,-.&'
-/01234'5460.78'9:;' ()'<('%=>?7@/A')'B2?46321'C4.214/' !"#$$% &'"$% DEF4?' ;' G' !"#'H211' :0'H211' ;' G' ;' G' D?276'5460.78'9:;' I(J'/2.B14/K' ;@2B34?'1752L06'C0110M4@'>=';F=.43?7N'B?030801' '26@'8%7B'%=>?7@7O2L06' P43'H211' ()*$%#+,%-'"$% -'"$% ;' G' -'"$% -'"$% -'"$%I(J'/2.B14/K' I(J'/2.B14/K' I(J'/2.B14/K'
;' D'
environmental control to facilitate the characterization of the genetic contribution to mCpG
150
variability. Reciprocal F1 hybrid mice are particularly attractive as experimental subjects
151
because heterozygous SNPs between the two parental strains can be utilized to tag allele-
152
specific methylation and thus identify strain-dependent and parent-of-origin effects.
153
Furthermore, every strain-dependent difference in methylation identified in F1 hybrid mice
154
necessary requires the presence of a local (cis) causative variant between parental strains
155
(Figure 2-1).
156
Recent advances in genotyping and whole genome sequencing (WGS) [1, 2, 63]
157
greatly facilitates the selection of parental strains. Using WGS and imputation, one can
158
select the parental strains to have the desired level and distribution of genetic variation. On
159
the other hand, the known MDA genotypes of the parental strains can be leveraged to
160
determine the number and distribution of putatively informative CpG sites using MSNP
161
analysis. Finally, these studies can be placed in the desired evolutionary context thanks to
162
the recent assignment of every genomic region of every laboratory strain to one of the three
163
major subspecies of the house mouse [1].
164
Based on these data, we selected the 129S1/SvImJ and PWK/PhJ strains to
165
generate reciprocal F1 hybrids. These parental strains have been sequenced [2, 64], are
166
highly genetically divergent genome-wide, fully inbred, readily available, and easy to breed.
167
They are also of interest to the wider scientific community because of their common use and
168
their inclusion in new mouse resources such as the Collaborative Cross (CC) and Diversity
169
Outbred (DO) populations [64, 65]. It is important to note that 129S1/SvlmJ is mostly
170
derived from Mus musculus domesticus while PWK/PhJ is mostly derived from Mus
171
musculus musculus [1]. Although the F1 hybrids used in this study are unlike most mice
172
found in natural populations, they provide an excellent platform to determine the effect of
173
genetic diversity on epigenetic variation. It is also possible to take advantage of the fraction
174
estimate the effect of genetic variation on methylation variation within a species. Figure 2-2
176
provides detailed information about the experimental design. In contrast with the constancy
177
of genotype within an individual, the epigenome will vary depending on the tissue analyzed.
178
Here we investigate allele-specific methylation in the adult mouse brain. We chose this
179
tissue because imprinting is common in the mouse brain and thus can serve as a positive
180
control for the identification of allele-specific methylation [66]. The fact that the brain is a
181
heterogeneous tissue poses some challenges but has also advantages. Among the
182
advantages is the fact that by using a heterogeneous tissue, we will increase the number of
183
potential allele-specific and parent-of-origin CpG sites. On the negative side we may be
184
unable to detect cell-type specific effects because of noise. Ideally, we would like to
185
investigate allele-specific methylation in every cell type within the brain, but the current cost
186
would be prohibitive.
187
Here we demonstrate that MSNP analysis with the MDA platform is an effective
188
method for surveying genome-wide allele-specific mCpG. We identified overall differences
189
in DNA methylation between sexes. We discovered that strain-specific DNA methylation is
190
far more pervasive that parent-of-origin DNA methylation genome-wide.
191
RESULTS
193
194
Global MSNP analysis
195
A brief description of the 14 biological samples and 42 Affymetrix arrays is provided
196
in Figure 2-2. We classified SNP and exon probes as informative for CpG methylation by
197
either stringent (CCGGI probes) or liberal criteria (CCGGI + CCGGII probes) (see Materials
198
and Methods). According to the liberal criteria, of the 623,054 SNP probes and 597,245
199
exon probes on the MDA, we identified 340,828 SNP and 465,921 exon probes as having
200
one or more MspI restriction sites internal to its corresponding Affymetrix amplification
201
fragment (Figure 2-2 and Figure 2-3).
202
For each probe, we defined the possible methylation status of nearby CpGs based
203
on intensity differences between HpaII, MspI and buffer treated samples. We classified
204
each SNP and exon probe sets as partially methylated, fully methylated, and unmethylated
205
(see Materials and Methods). In addition, 309,278 SNP and 418,769 exon probes sets
206
cannot be classified in any of these three categories and are ignored in subsequent
207
analyses (denoted as unclassified in Figure 2-3). We reported previously that off-target
208
variants within MDA probe binding sites affect hybrization performance [67]. To determine if
209
off-target variants influence our ability to classify SNP and exon probe sets, we compared
210
the number of off-target variants between the four probe classes (Table S2-1). We found a
211
significant enrichment of probes with off-target variants in the unclassified methylation class.
212
This result suggests that our ability to assign methylation state to SNP and exon probes is
213
hindered by off-target variation in the probe binding site.
214
Among the 31,550 SNP and 47,152 exon probe sets that can be classified, 7,613
215
SNP and 38,185 exon probes are associated with fully methylated CpG(s), 3,337 SNP and
216
8,260 exon probes are associated with unmethylated CpG(s), and 497 SNP and 707 exon
217
with SNP and exon probes was mapped back to the genome to create a global methylation
219
map (liberal analysis, Figure 2-4; stringent analysis, Figure S2-1).
220
We then tested whether there are global sex-dependent methylation differences.
221
Because there were four (129S1xPWK)F1 female samples, but only two (129S1xPWK)F1
222
male samples, we randomly chose two out of the four females to have a balanced sample
223
size between the two sexes. Obviously, when female and male X chromosomes were
224
analyzed separately, we observed striking differences in the degree of X chromosome
225
methylation (Figure 2-4 and Figure S2-1). While sex differences in X chromosome
226
methylation are well documented [51, 68], the existence and direction of autosomal
227
differences is controversial. Therefore, we compared the number of methylated,
228
unmethylated, and partially methylated probes in male and female autosomes. Overall,
229
females have approximately 9% higher levels of autosomal methylation (males and females
230
have 41,643 and 45,790 SNP and exon probes associated with fully methylated CpG(s),
231
respectively. p-value = 1.55e-27). To examine the differences at a local level, we mapped
232
the methylation state associated with each probe set back to the genome to create sex-
233
specific methylation maps (Figure S2-2). Although sex specific maps are similar, there are
234
areas of apparent sex-specific methylation. For example, proximal chromosome 15 is
235
heavily methylated in females, but not males.
236
Figure 2-3. Classification of MDA probes according to the CpG methylation status of tagged HpaII sites. This Figure shows the method used to classify the MDA SNP and exon probe sets into methylation-informative subsets. The number of probe sets in each
classification was determined by liberal analysis (CCGGI, see Materials and Methods). Under each classification is a simulated two-dimensional plot to illustrate the hybridization pattern expected for each class. The y-axis represents the overall intensity and is used throughout the entire analysis. The x-axis represent the contrast between the two allelic probes at heterozygous SNPs and is used only in the strain and parent-of-origin classes. Each plot show hybridization data for a single probe set for the 14 experimental samples used in this study. Each sample is represented three times according to whether they were subject to HpaII (maroon), MspI (light green) and buffer (black) treatments. Circles and squares represent the two types of reciprocal F1 hybrids. We assigned seven different colors to seven methylation classes with consistent results. Consistently methylated CpGs class is green, consistently unmethylated CpGs class is purple, partially methylated CpGs class is orange, PWK-specific methylation class is red, 129S1 specific methylation class is blue, maternal specific methylation class is pink and paternal specific methylation is light blue. These colors are used throughout the chapter.
Contrast (A-B) Parent-of-origin
11 SNP probes Strain-of-origin 305 SNP probes
methylation state
Overall intensity (A+B) (1st dimension)
(2nd dimension)
Unknown
Mouse Diversity Array
623,054 SNP probes597,245 exon probes
MspI site Absent 282,226 SNP probes 131,324 exon probes
MspI site(s) Present 340,828 SNP probes 465,921 exon probes
partially methylated
497 SNP probes 707 exon probes
methylated
27,613 SNP probes 38,185 exon probes
Classification
unmethylated
3,337 SNP probes 8,260 exon probes
unclassified
309,278 SNP probes 418,769 exon probes
?
PWK
164 SNP probes
Paternal
3 SNP probes 141 SNP probes 129S1
Maternal
8 SNP probes
0
-1 1 -1 0 1 -1 0 1 -1 0 1
0
-1 1
0
238
Allele-specific analysis of mouse brain DNA reveals strain and parent-of-origin
239
differences in methylation.
240
241
To determine the extent and localization of allele-specific methylation we restricted our
242
analysis to SNPs that were heterozygous in our F1 hybrids and were classified as partially
243
methylated in the global analysis. These conditions ensure that our analysis focuses on the
244
SNPs with potential strain-specific and parent-of origin information. Of the 497 partially
245
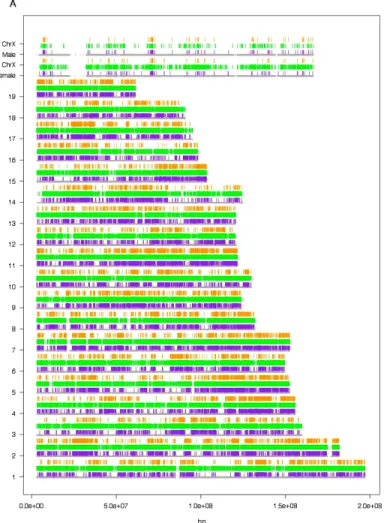
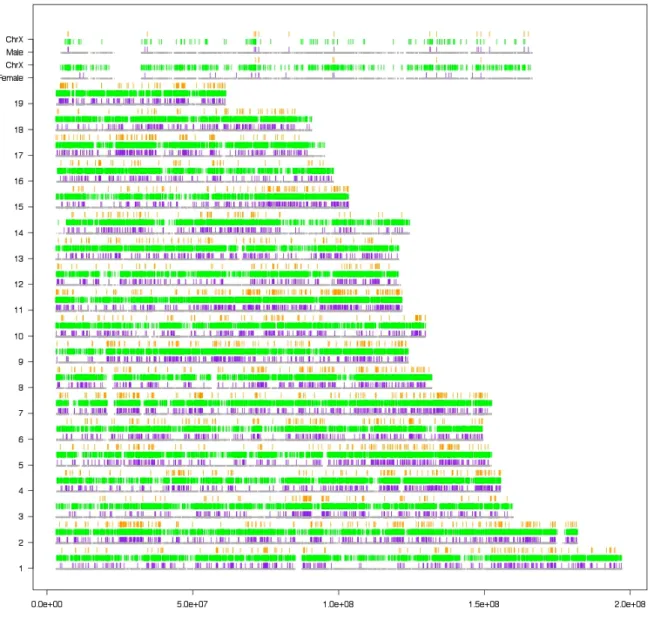
Figure 2-4. Global and allele-specific maps of methylation patterns in the mouse brain. Each tick mark represents a probe set located at its corresponding chromosome position. SNP and exon probes associated with fully methylated CpGs are shown in green, probe sets associated with unmethylated CpGs are shown in purple, and probe sets
methylated SNP probes, we identified 305 SNPs displaying a strain dependent methylation
246
patterns and 11 SNPs displaying a parent-of-origin dependent methylation patterns (Figure
247
2-3 and Table S2-2). We mapped both classes of probes back to the genome to create
248
strain-of-origin and parent-of-origin global differential methylation maps (Figure S2-3). One
249
hundred eighty-one partially methylated sites do not conform to this simple strain and
250
parental origin partition.
251
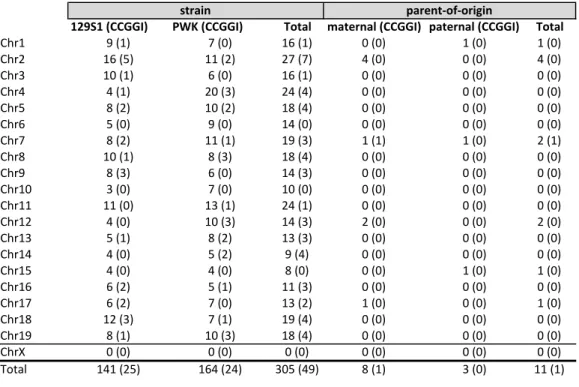
Table 2-1. Allele-specific DMRs. The table shows the breakdown of allele-specific DMRs
252
into strain, parent-of-origin, and number per chromosome. The numbers inside parenthesis
253
are from the stringent analysis (CCGGI).
254
255
Approximately half of the 305 strain dependent sites are associated with consistent
256
methylation of the allele of one of the parental strains while the other allele is consistently
257
unmethylated (i.e., 164 sites with consistent methylation of the PWK allele and 141 sites
258
with consistent methylation of the 129S1 allele). As expected there is a significant deficit of
259
strain dependent sites on the X chromosome (see Discussion). Both types of strain effects
260
!"#$!%&''(()* +,-%&''(()* ./012 31045612%&''(()* 71045612%&''(()* ./012
!"#$ %&'$( )&'*( $+&'$( *&'*( $&'*( $&'*( !"#, $+&'-( $$&',( ,)&')( .&'*( *&'*( .&'*( !"#/ $*&'$( +&'*( $+&'$( *&'*( *&'*( *&'*( !"#. .&'$( ,*&'/( ,.&'.( *&'*( *&'*( *&'*( !"#- 0&',( $*&',( $0&'.( *&'*( *&'*( *&'*( !"#+ -&'*( %&'*( $.&'*( *&'*( *&'*( *&'*( !"#) 0&',( $$&'$( $%&'/( $&'$( $&'*( ,&'$( !"#0 $*&'$( 0&'/( $0&'.( *&'*( *&'*( *&'*( !"#% 0&'/( +&'*( $.&'/( *&'*( *&'*( *&'*( !"#$* /&'*( )&'*( $*&'*( *&'*( *&'*( *&'*( !"#$$ $$&'*( $/&'$( ,.&'$( *&'*( *&'*( *&'*( !"#$, .&'*( $*&'/( $.&'/( ,&'*( *&'*( ,&'*( !"#$/ -&'$( 0&',( $/&'/( *&'*( *&'*( *&'*( !"#$. .&'*( -&',( %&'.( *&'*( *&'*( *&'*( !"#$- .&'*( .&'*( 0&'*( *&'*( $&'*( $&'*( !"#$+ +&',( -&'$( $$&'/( *&'*( *&'*( *&'*( !"#$) +&',( )&'*( $/&',( $&'*( *&'*( $&'*( !"#$0 $,&'/( )&'$( $%&'.( *&'*( *&'*( *&'*( !"#$% 0&'$( $*&'/( $0&'.( *&'*( *&'*( *&'*( !"#1 *&'*( *&'*( *&'*( *&'*( *&'*( *&'*( 23456 $.$&',-( $+.&',.( /*-&'.%( 0&'$( /&'*( $$&'$(
are represented in each autosome and the distribution is uniform. To our knowledge, the
261
strain-dependent methylation loci have not been reported before.
262
The parent-of-origin analysis identified SNPs tagging either maternal or paternal-
263
specific methylation (eight and three SNPs, respectively; Table S2-2). All but two of the
264
SNPs associated with parent-of-origin methylation are located within or near (less 500 kb)
265
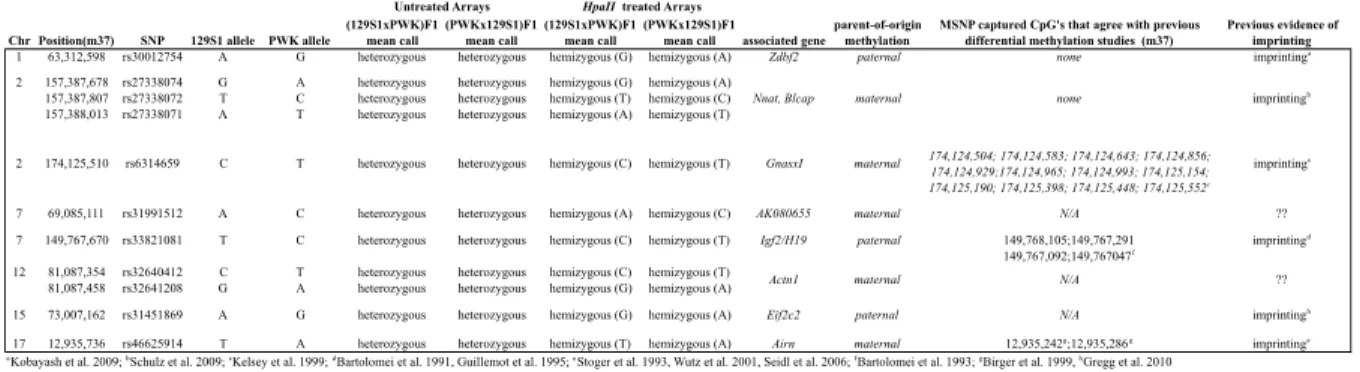
known clusters of imprinted genes [69-77]. The remaining two SNPs (rs32640412 and
266
rs32641208) tag two HpaII sites within the same Affymetrix amplicon on chromosome 12
267
(Figure S2-3). Although the allele-specific information is not independent, the methylation
268
status of the two HpaII sites must be consistent given the observed parent-of-origin effect.
269
These CpGs are maternally methylated and in the last intron of Actn1 that codes for a-
270
Actinin, a microfilament protein that interacts dynamically with Actin (see Chapter III). Note
271
that the methylation statuses of the relevant HpaII sites have not been reported previously.
272
For example, the imprinted methylation status of the site associated with SNP rs31991512
273
on chromosome 7 was previously unknown.
274
Functional relevance of strain-specific DMRs
275
DNA methylation may directly or indirectly affect gene expression (i.e., by influence
276
the binding of transcription regulatory elements or by altering the local chromatin landscape)
277
[78-80]. Typically, transcription regulatory elements reside near the transcription start sites
278
(TSS) of genes they control. To explore the possible functional role of the strain-specific
279
DMRs, we began with a simple test to determine if the strain-specific DMRs are significantly
280
closer to gene TSS than expected by chance. For each of the 305 strain-specific DMRs, we
281
calculated the distance to the immediate proximal and distal gene TSS. We then compared
282
the average of these distances to the average distance between all informative SNP probes
283
with at least one HpaII/MspI cut site (Figure 2-3). We rejected the null hypothesis that the
284
DMRs are not significantly closer to TSS than the informative SNP average (Figure 2-5A, p-
285
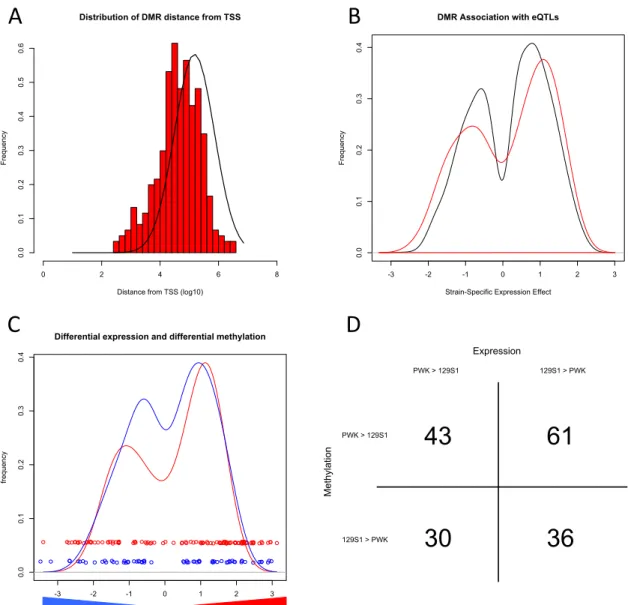
Next, we tested each of the 610 TSS for differential expression between the two
287
parental strains. We used publically available eQTL data from liver expression of Pre-
288
Collaborative Cross mice (See Materials and Methods) [29]. Of the 610 TSS nearby
289
strain-specific DMRs, we found 157 of the TSS are associated with eQTLs. We plotted the
290
frequency and direction of the differential expression and compared that to the frequency of
291
all genes with eQTLs (Figure 2-5B). The bimodal distribution of DMRs associated with
292
eQTLs is similar to that of all genes with eQTLs.
293
Lastly, we determined if the direction of allele-specific expression was correlated to
294
the direction of allele-specific methylation. To do so, we overlaid the methylation data with
295
the eQTL effect to determine if the methylation patterns correlated with the eQTL effect
296
direction (Figure 2-5C). Of the 170 DMRs associated with eQTLs, we found all four
297
possible methylation and expression combinations: 43 showed high PWK methylation and
298
high PWK expression, 61 shows high PWK methylation and low PWK expression, 30
299
showed high 129S1 methylation and low 129S1 expression, and 36 showed high 129S1
300
302
!"
Distribution of DMR distance from TSS#"
Distance from TSS (log10)
F
re
qu
en
cy
0 2 4 6 8
0.0 0.1 0.2 0.3 0.4 0.5 0.6
-3 -2 -1 0 1 2 3
0.0
0.1
0.2
0.3
0.4
DMR Association with eQTLs
Strain-Specific Expression Effect
F re qu en cy expression fre qu en cy
-3 -2 -1 0 1 2 3
0.0
0.1
0.2
0.3
0.4
Differential expression and differential methylation
$"
%&'(%")"*+," *+,")"%&'(%"
-"
PWK > 129S1
129S1 > PWK
PWK > 129S1 129S1 > PWK
Expression Me th yl at io
n
43
36
61
30
Figure 2-5. Functional analysis of strain-specific DMRs. Panel A shows the distribution of distances (log10(base pairs)) between the 305 strain-specific DMRs and TSSs
DISCUSSION
302
303
Allele-specific variation in epigenetic marks, including DNA methylation, is an
304
emerging field of great interest in basic biology and in the animal modeling of human
305
diseases. Here we report an analysis that combines MSNP with a high-density genotyping
306
array in the mouse. We identified tens of thousands of consistently methylated and
307
consistently unmethylated CpG sites distributed across the mouse genome (Figures 2-3
308
and 2-4). Equally important, we were able to examine the relationship between genetic
309
variation and epigenetic variation at hundreds of partially methylated CpGs. This extensive
310
new catalog of methylation status at CpG sites in laboratory mice can be mined to develop
311
assays to survey methylation variation during development, in different genetic backgrounds
312
and environmental conditions and healthy and diseased mice. The catalog of SNP and
313
exon probe sets with methylation information and the CpGs tagged by them can be found on
314
the UNC System Genetics webpage (http://csbio.unc.edu/CCstatus/index.py)
315
Although we were inspired by previous reports describing MSNP in humans [53, 61],
316
our study has several important differences. First, experimental design takes full advantage
317
of inbred mouse strains to disentangle relative contribution of sex, strain and parental origin
318
in a simple and elegant manner. Second, the high density of the MDA greatly increases the
319
number of surveyable mCpG’s with allele-specific information. We have also overcome
320
some of the limitations of previous analyses by determining methylation status based on
321
probe intensities instead of genotype calls. We have shown previously that this approach
322
has significant advantages in phylogenetic analyses, reduction of ascertainment biases and
323
accuracy of haplotype reconstruction [1, 64, 67, 81]. An added advantage of intensity-based
324
analysis is that it can be extended to uninformative (i.e., homozygous) SNP probes and to
325
An attractive feature of identifying allele-specific effects in F1 hybrids is that there is
327
an absolute requirement for strain specific variation in cis (i.e., local variation is necessary to
328
observed allele-specific effects, Figure 2-1). This applies to gene expression as well as to
329
DNA methylation. Thus, the work reported here provides the foundation to a genetic
330
approach to dissect an important epigenetic mark. Briefly, F1 hybrids can be used to
331
identify strain-dependent effects but provide only a rough localization of the cis genetic
332
variant causative of mCpG variation. In a second step one can take advantage of new
333
mouse resource populations such as the CC and DO to finely map the genetic variation
334
driving strain specific DMRs [64, 81]. Depending on the density of recombination, it may be
335
possible to localize the cis variants, propose molecular mechanisms, and identify sequence
336
motifs.
337
Despite the success of our modified MSNP approach, there is room for improvement
338
in two key areas: the number and type of enzyme used in the fragmentation steps prior to
339
library preparation and the number and type of methylation-sensitive endonuclease used to
340
estimate methylation levels. With the availability of the mouse reference assembly and
341
whole genome sequence of commonly used laboratory strains [2, 3] a bioinformatics
342
approach could be used to maximize the methylation information collected, including both
343
presence/absence and allele-specific methylation.
344
Among the unanticipated conclusions reached in this study is the evidence of
345
female-specific global autosomal hypermethylation (Figure S2-2). Our results are in conflict
346
with previous reports of hypermethylation in male autosomes [82, 83]. A possible
347
explanation for these discrepancies is the differences in number, location and identity of the
348
CpG sites surveyed. MSNP uses SNP and exons probes to tag the methylation status at
349
one or a few nearby CpGs. Therefore, each probe set provides an independent estimate of
350
CpG methylation at specific locations of the genome. Overall, MDA-based MSNP targets
351
previous studies examine either only a few loci [82] or global methylation determined by
353
Southern blot analysis after digestion with HpaII [84]. We believe that MSNP analysis better
354
reflects sex-specific differences in autosomal mCpG methylation at many localized regions
355
of the genome. Whether these sex-specific methylation differences can be generalized to
356
other conditions (for example other tissues, backgrounds and species) and whether they
357
contribute to explain sex-specific phenotypic differences are open questions. Nevertheless,
358
these findings highlight the importance of including both sexes in epigenetic studies.
359
We observe a deficit of X-linked strain-specific methylation. We expected such
360
results because only females can have informative SNPs on the X chromosome and
361
therefore, provide allele-specific information in our experimental design. In addition, we
362
identify strain-specific methylation by consistent hypermethylation of one allele and
363
hypomethylation of the other. However, mCpG plays a significant role in maintaining X
364
inactivation and therefore our analysis of X-linked mCpG is dependent on the X inactivation
365
status of a female [85]. Females are expected to have equal number of cells with an
366
inactive maternal or paternal X chromosome. However, genetic (Xce genotype), parent-of-
367
origin and stochastic factors can contribute to X inactivation skewing and this process is
368
highly variable in mouse (see Chapter IV). Although the genetic component (Xce) in these
369
reciprocal crosses between 129S1 (Xcea)and PWK (Xcee, seeChapter IV) should lead to
370
minimal mean XCI skewing, stochastic variation and parent-of-origin effects can contribute
371
to large variability within genetically identical mice and significantly mask strain effects.
372
In this study, we identified 600 partially methylated CpGs. In our analysis, “partially
373
methylated” denotes CpGs that have intermediate levels of methylation that are consistently
374
observed in F1 hybrids. The number of loci subject to strain dependent effects is an order of
375
magnitude larger than the loci subject to parent-of-origin effects. Of the 305 strain-specific
376
DMRs, 164 are PWK-specific and 141 are 129S1-specific. This symmetry is expected
377
consistent selection over long evolutionary periods for hypermethylation in one lineage and
379
hypomethylation on the other lineage at many independent and uniformly distributed loci in
380
the genome: an unlikely scenario. On the other hand, equal contribution to the DMRs of two
381
inbred strains with highly different divergence from the mouse genome reference is in sharp
382
contrast with the biases in strain effects found in microarray gene expression studies in
383
highly divergent mouse strains [86]. The differential expression biases are due to the
384
presence of genetic variants in the probes that preferentially reduce hybridization intensity in
385
the most divergent strain [67]. We avoided such artifacts by limiting our allele-specific
386
analysis to well performing probes that lack off target polymorphisms in the two parental
387
strains [67].
388
An important use of our data is that they can be used to estimate the total number of
389
CpGs that are subject to strain-specific methylation. Using the stringent criteria we identified
390
49 strain-specific autosomal differentially methylated CpGs. Given the limitations of the
391
MSNP method, we surveyed only 4.9% of all HpaII cut sites or 0.37% of all CpGs genome
392
wide. Extrapolating from our results, we estimate that there are ~13,000 strain-specific
393
differentially methylated CpGs. We acknowledge that there are obvious limitations in our
394
approach including the fact that only two inbred strains have been surveyed (and more
395
importantly only two of the three major house mouse subspecies) and that we require a high
396
threshold to declare a CpG site subject to strain specific effects. We also have only
397
analyzed a single tissue and developmental time. Nonetheless this estimate is remarkable
398
because it predicts that strain effects on epigenetic variation is as prevalent as strain effects
399
in gene expression even after accounting for the high correlation in methylation status
400
between consecutive CpGs expected (Figure S2-3).
401
We tested the functional relevance of the strain-specific DMRs by using three
402
different analyses. In mouse, CpG islands typically reside near TSS of genes they control
403
the strain specific DMRs (Figure 2-5A). We found that there are more differentially
405
methylated CpGs located near transcription start sites than expected by chance.
406
To further investigate the possible functional roles of the strain-specific DMRs, we
407
analyzed the correlation between the DMRs and differentially expressed genes. We found
408
that 28.1% (170 of 604 tested) of the DMRs are located near transcripts with differential
409
gene expression between 129S1 and PWK. This percentage is only slightly higher than
410
expected given the total number of differentially expressed genes compared to total genes
411
expressed (23.3%, p-value of 0.006). One possible explanation for the low correlation
412
between DMR and differential gene expression is the tissue type used. The MSNP
413
experiment utilized genomic DNA extracted from whole brain, while the expression data was
414
generated from 129S1xPWK F1 liver. Though the mismatch between tissue types is not
415
ideal, the small number of DMRs that are associated with differentially expressed transcripts
416
may represent DMRs that are consistent between all tissue types. These DMRs would likely
417
represent epigenetic marks established very early during development, before tissue lineage
418
was specified. Nevertheless, future experiments should have matching methylation and
419
expression data in order to draw significant conclusions about DMR effects on nearby gene
420
expression.
421
MATERIALS AND METHODS
422
Mice and tissues
423
Mice from the two parental strains (129S1/SvImJ, and PWK/PhJ) were originally
424
obtained from The Jackson Laboratory. They were bred at UNC-Chapel Hill for multiple
425
generations and interbred to generate reciprocal F1 hybrids. Mice were euthanized at eight-
426
weeks of age and the right-hemispheres of the brain were dissected. All procedures were
427
conducted in accordance with NIH guidelines for the care and use of experimental animals
428
and based on protocols approved by the Institutional Animal Care and Use Committee of
429
Mouse Diversity Array (MDA) processing
431
Genomic DNA was purified from tissues according to a standard protocol of
432
phenol/chloroform extraction followed by ethanol precipitation. Each genomic DNA sample
433
was divided into three separate restriction digestion reactions containing HpaII, MspI, or
434
reaction buffer only. For each reaction, 2.5 µg of DNA was digested in a total volume of 100
435
µl for three hours at 37°C, followed by heat inactivation. Pre-digested samples were then
436
processed, from start to finish, according to the Affymetrix 6.0 genotyping protocol and
437
hybridized to the MDA [62] at the UNC Functional Genomics Core Facility.
438
MSNP analysis
439
The array intensities were normalized using MouseDivGeno [67] and intensities from
440
SNP and exon probe sets were used for further analysis. We ignored probes with restriction
441
fragments longer than 2 kb because they yield a weak signal. For each probe set, we
442
determined the number of MspIrestriction sites (CCGG) internal to the corresponding NspI
443
or StyI restriction fragment and classified probe sets with one as CCGGI. Probe sets with
444
more than one MspI site were classified as CCGGII. Note that CCGGI includes cases
445
where there is one common MspI site in both StyI and NspI, and also cases where the StyI
446
(NspI) fragment has one MpsI site and the length of NspI (StyI) fragment is longer than 2 kb.
447
We used t-statistics to test whether any of the three digestion reactions conditions (no
448
enzyme, HpaII and MspI) lead to differences in mean intensity level at each probe set.
449
Since the number of probe sets is large and the sample size is small, we used the t-test with
450
shrinkage variance, implemented in R/maanova [89]. Using a p-value of 10-10, which
451
corresponds to a false discovery rate (q-value) of 10-7 after multiple test correction we tested
452
three hypotheses for each probe set:
453
i) Intensities from buffer condition > HpaII condition > MspI condition.
454
ii) Intensities from buffer condition = HpaII condition > MspI condition.
455
We denoted SNP or exon probe sets that reject first, second and third hypothesis as
457
partially methylated, fully methylated, and unmethylated probe sets, respectively.
458
To test strain or parent-of-origin specific methylation, we restricted the analysis to 118,154
459
SNP probe sets, for which the genotypes of our F1 mice were heterozygous. These
460
genotypes were obtained from the consensus call based on twelve undigested F1 samples
461
and also predicted the genotype of F1 hybrids based on the genotypes of parental strains
462
[1]. We evaluated the contrast between intensities for the two allelic probes at each
463
informative SNP tagging partially methylated CpGs. In buffer treated F1samples, both
464
alleles are expected to have similar intensities and the contrast to be near zero (Figure 2-3,
465
black circles and squares). To identify allelic effects we tested whether the contrast
466
between the alternative alleles at each informative SNP probe set deviates from zero after
467
HpaII treatment. This test is analogous to the logic employed by Kerkel et al. and Yuan et
468
al. with the advantage of using probe intensity data directly. If the contrast deviated from
469
zero and the direction in both reciprocal crosses was consistent we classified this probe set
470
as strain specific methylation. If the contrast deviated from zero and the direction in both
471
reciprocal crosses was opposite we classified this probe set as parent-of-origin dependent
472
methylation. We used a t-test with p-value 0.01, equivalent to false discovery rate 0.05 and
473
silhouette score 0.5. Figure S2-5 provides the contrast plots for a subset of the 305 SNPs
474
with strain and parent-of-origin effect. All sequence analyses are based on the mouse
475
genome assembly mm9, NCBI Build 37.
476
Expression analysis
477
To determine significant differential PWK and 129S1 expression, we analyzed
478
previously reported expression quantitative trait locus (eQTL) data [29]. Briefly, mRNA was
479
extracted from livers of 15-week-old Pre-Collaborative Cross mice and processed for
480
hybridization to the Affymetrix GeneChip Mouse Gene 1.0 ST Array. Allele effects were
481
SUPPORTING MATERIAL
483
484
Figure S2-1. Global map of methylation patterns in the mouse brain according to
485
stringent criteria. SNP and exon probes tagged to: fully methylated CpGs are shown in
486
green, fully unmethylated CpGs are shown in purple, and partially methylated CpGs are
487
shown in orange. Results for X chromosome probe sets in males and females are plotted
488
separately. All probe sets are plotted in light grey.
489
492
Figure S2-2. Sex-specific methylation map. Each tick mark represents a probe set
493
located at its corresponding chromosome position. SNP and exon probes associated with
494
fully methylated CpGs are shown in dark green (male) or light green (female), probe sets
495
associated with unmethylated CpGs are shown in dark purple (male) or light purple (female),
496
and probe sets associated with partially methylated CpGs are shown in dark orange (male)
497
or light orange (female).
498
Figure S2-3. Strain-specific and parent-of-origin methylation map. The Figure shows partially methylated SNP probe sets with consistent allele-specific results. SNP probe sets associated with strain-specific CpG methylation are shown on top of each chromosome while SNP probe sets with parent-of-origin methylation are shown below each chromosome. SNPs tagging PWK-specific methylation class are shown in red, SNPs tagging 129S1
specific methylation class are shown in blue, maternal specific methylation are shown pink and paternal specific methylation are shown in light blue. Locations of known clusters of imprinted genes are shown in black.
501
Contrast (A-B) Parent-of-origin
11 SNP probes 305 SNP probes Strain-of-origin
methylation state
Overall intensity (A+B) (1st dimension)
(2nd dimension)
Unknown
Mouse Diversity Array
623,054 SNP probes597,245 exon probes
MspI site Absent 282,226 SNP probes 131,324 exon probes
MspI site(s) Present 340,828 SNP probes 465,921 exon probes
partially methylated
497 SNP probes 707 exon probes
methylated
27,613 SNP probes 38,185 exon probes
Classification
unmethylated
3,337 SNP probes 8,260 exon probes
unclassified
309,278 SNP probes 418,769 exon probes
?
PWK
164 SNP probes
Paternal
3 SNP probes 141 SNP probes 129S1
Maternal
8 SNP probes
0
-1 1 -1 0 1 -1 0 1 -1 0 1
0
-1 1
0
501
502
F ema le -p art ia lly me th yl at ed male-partially methylated
Male-partially methylated Male-methylated
F ema le -me th yl at ed Male-unmethylated fe ma le -u nme th yl at ed
502
504
506
508
510
512
514
516
518
Figure S2-5. Contrast plot for SNP probes tagging strain-specific and parent-of origin differentially methylated CpGs. The y-axis represents the total