RESEARCH
Influence of Reading Material Characteristics on Study Time for Pre-Class
Quizzes in a Flipped Classroom
Adam M. Persky, PhD,a,bAbigail Hogga a
Eshelman School of Pharmacy, University of North Carolina at Chapel Hill, Chapel Hill, North Carolina
bAssociate Editor,American Journal of Pharmaceutical Education, Alexandria, Virginia
Submitted March 10, 2016; accepted July 9, 2016; published June 2017.
Objective. To examine how instructor-developed reading material relates to pre-class time spent
preparing for the readiness assurance process (RAP) in a team-based learning (TBL) course.
Methods.Students within pharmacokinetics and physiology were asked to self-report the amount of
time spent studying for the RAP. Correlation analysis and multilevel linear regression techniques were used to identify factors within the pre-class reading material that contribute to self-reported study time.
Results.On average students spent 3.2 hours preparing for a section of material in the TBL format. The
ratio of predicted reading time, based on reading speed and word count, and self-reported study time was greater than 1:3. Self-reported study time was positively correlated with word count, number of tables and figures, and overall page length. For predictors of self-reported study time, topic difficulty and number of figures were negative predictors whereas word count and number of self-assessments were positive predictors.
Conclusion.Factors related to reading material are moderate predictors of self-reported student study
time for an accountability assessment. A more significant finding is student self-reported study time is much greater than the time predicted by simple word count.
Keywords:flipped classroom, pharmacokinetics, physiology, pre-class preparation, reading comprehension
INTRODUCTION
With the push to off-load traditional in-class content to self-study and utilize class time for the application of knowledge and concepts, it is important to understand how students are spending out-of-class time. In some cases, students are learning from reading material, either commer-cially available textbooks or instructor-developed material. It is unclear what factors from pre-class material may in-fluence learner preparation time in anticipation for some measure of accountability (eg, quiz) based on the pre-class preparation. This article hopes to elucidate factors that may predict study time from various dimensions of instructor-developed reading material.
In the flipped classroom model, students are expected to come prepared to class so that class time can be used for the application of foundational concepts. Models like team-based learning (TBL) reflect this idea. In this model, students prepare before class, complete a readiness assurance
process and then engage in class discussions.1One of the
challenges in the flipped classroom model is managing out-of-class time expectations, that is, how much time students are spending outside of class preparing relative to in-class time. Time management is a major concern
among learners in the flipped model.2 We previously
showed that students perceive time spent in a “flipped”
course to be about equal to traditional lecture courses.3-5
For faculty, questions surface what is a reasonable ratio for pre-class time relative to in-class time or post-class homework and how to best estimate these time expecta-tions. One way to judge how much time students might spend preparing pre-class is the length of the material they have to study. However, the length of material may not
directly translate to amount of study time.4In one study,
pre-class time was three times longer than expected based
solely on word counts of reading material.4Word count
may only be one contributing factor but reading speed or comprehension may be another.
Reading speed and comprehension is complex and involves many subcomponent skills and abilities. One component is the ability of the reader to extract meaning. As the level of processing of the content increases, so does reading time, and this is reflected in the amount of Corresponding Author:Adam M. Persky, 2312 Kerr Hall,
self-regulation the learner has to use to learn the material.6 Other components include processing at the word level – recognizing words, terminology and frequency of their
use,7-9text difficulty,10format or complexity of the
mate-rial (eg, font, paragraph vs bullet point)11,12and how well
text is supported.13The remaining components influencing
reading speed and comprehension are at the cognitive level, such as working memory capacity, inferencing,
in-tegration of material and use of metacognitive skills.14As
such, amount of time spent reading in preparation for class is multifactorial.
Reading has been and continues to be one of the primary ways to transmit information, even though the use of recorded videos or animations is gaining in popu-larity. While there are estimates for reading speed (150-400
words per minute),15,16it is unclear how reading speed or
reading time translates into time it takes for students to read, study, annotate, re-read, self-assess or utilize any other strat-egies that might be used to learn from the material. Based on previous work in a classroom setting, students spend, on average, three hours a week preparing for class, and they are willing to spend, on average, from three to four hours
preparing for a 3-credit hour course.17As higher education
or health science education moves toward more pre-class self-study, it may be important to have more predictive measures of how to translate reading material into study time. The findings of this study can help inform course development within higher education and health science education.
METHODS
Two courses within a professional curriculum at a single institution were assessed. PHCY 203 is a 4-credit, 15-week course in physiology, and PHCY 413 is a 3-credit, 15-week course in pharmacokinetics. Both courses utilize instructor-developed reading material and both courses use the readiness assurance process of team-based learning. Quizzes were based on terminology and con-cepts from the pre-class reading material and followed
the readiness assurance process of team-based learning.1
Typically one quiz was used for three to eight hours of class time (ie, from one to two weeks of material),
con-sistent with the TBL model.1 For example, a quiz was
completed before spending eight hours of in-class time on cardiovascular physiology. In PHCY 203, in-class time was used for a variety of active learning application
exercises as previously described;5 in PHCY 413, the
traditional team-based learning format was used for the
first nine weeks of the course.18
During the first day for a section of material, students completed the readiness assessment procedure (RAP). Prior to the RAP, students were asked to record the
amount of time they spent preparing for the day’s quiz (reading, studying, etc.), rounded to the nearest hour on their individual sheets. Students then completed the indi-vidual quiz and once the class completed the indiindi-vidual portion, students completed the quiz in their assigned teams using immediate feedback forms (IF-AT, Epstein Educational Enterprises, Cincinnati, OH). In PHCY 203, there were a total of seven quizzes covering all seven course topics (cardiovascular physiology, renal, hematology, cen-tral nervous system, gastrointestinal, endocrine, and respi-ratory), and in PHCY 413 there were a total of five quizzes covering all five topic areas (pharmacodynamics, single dose kinetics, multiple dose kinetics, violations of the one-compartment model and physiologic influence on drug disposition).
Several factors related to the reading material were examined: topic difficulty (eg, cardiology, multiple dose kinetics), word count of the reading material, difficulty level of the reading material (ie, SMOG readability index), number of pages the RAP covered, and number of tables and figures. Topic difficulty was determined from the av-erage individual quiz components of the RAP from the prior three years. Word count, number of pages, number of tables and figures was obtained directly from Microsoft Word (Redmond, WA) and were summed to represent the material covered for an individual quiz (eg, single dose kinetics covered four chapters). Reading difficulty was estimated by taking three samples of each chapter and calculating a SMOG readability score (http://www.online-utility.org); these samples were averaged across the chapters that were included within the RAP. The SMOG readability formulate estimates the years of education a person needs to understand a piece of writing and takes
into account the number of polysyllabic words.19 We
also examined the number of self-assessments students completed; self-assessments were available through the learning management system (Sakai, Apereo Foundation 2014, Princeton, NJ) and students could complete these as-sessments as often as they wanted and were ungraded.
fit was determined by the -2 Restricted Log Likelihood with lower values suggesting better model fits. This study was exempted by the Institutional Review Board (UNC IRB #15-1166).
RESULTS
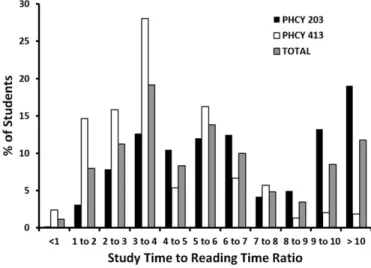
Summary of the reading material can be found in Table 1. On average, students self-reported 3.2 hours pre-paring for the RAP (ie, study time). The distribution of self-reported study times can be found in Figure 1. The average ratio of self-reported study time to class time on each topic was 36 minutes of pre-class study to one hour of class time. The ratio of anticipated reading time (based on 200 words per minute) to self-reported study time was 1:4 or for every hour of reading is equivalent to almost four hours of self-reported study time. The distribution of ratios of anticipated reading time to self-reported study time can be found in Figure 2; the distribution of the ratio appears to be bi-modal with 25% of students spending over eight hours studying for one hour of reading material. The correlation matrix for all the factors can be found in Table 2. There were some noteworthy relationships. Self-reported study time was positively, but weakly, cor-related with word count and difficulty of reading material (ie, SMOG index) but inversely associated with topic
difficulty. Because of the high correlation (.0.95) of
word count to page number, page number was excluded in the multilevel regression analysis.
Regression results can be found in Table 3. Based on the model, the average self-reported study time was 3.3 hours (intercept). The intraclass correlation coefficient for the final model was 37% meaning 37% of the variance of students’ self-reported study time prior to an account-ability quiz is accounted for at the student level (level-2).
Regression results indicate topic difficulty (b5-6.52) and
number of figures (b5-.043) negatively predict
self-re-ported study time, but word count (b50.139) and number
of self-assessments (b52.14) positively predict study
time. There also was an interaction between topic diffi-culty and the readability index (SMOG) suggesting
to-gether they would increase study time (b55.80).
Of potential interest is the relationship between self-reported study time and performance on the individual quiz component of the RAP. We conducted this explor-atory analysis within each course. Both courses had low,
non-significant correlations (PHCY 413: r50.000,
p5.997; PHCY 203:r50.014,p5.659). No further
anal-ysis was performed due to the low correlations.
DISCUSSION
This study is one of the first attempting to relate the amount of time students self-report studying pre-class in a flipped classroom model and relating that time to source materials. Reading material factors predicted self-reported study time but did not explain a large fraction of the variability. Importantly, self-reported study time does not equal anticipated reading time. In fact, students report spending about four times longer preparing for a quiz over that material than time estimates based solely on word count. This is consistent with previous findings relating
self-reported study time to source material.17In addition,
our previous research also suggests that although students have self-reported more time pre-class than in non-flipped courses, students did not feel the overall time spent on the course was less than or greater than other courses despite
this off-loaded content.3,17
Several factors might impact the lack of strong pre-diction between reading material and self-reported study time. We found that topic difficulty was inversely asso-ciated with study time. The most likely reason is the
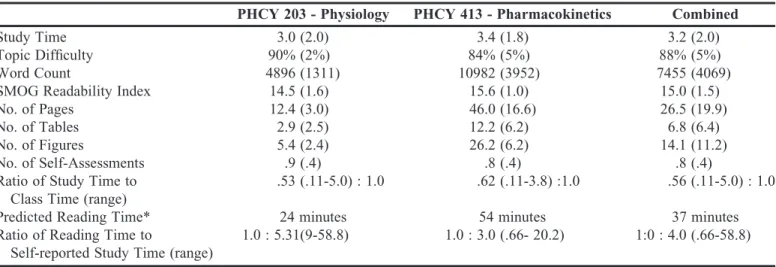
Table 1. Descriptive Statistics of Reading Material for Each Quiz Based on Course Data Presented as Mean (Standard Deviation)
PHCY 203 - Physiology PHCY 413 - Pharmacokinetics Combined
Study Time 3.0 (2.0) 3.4 (1.8) 3.2 (2.0)
Topic Difficulty 90% (2%) 84% (5%) 88% (5%)
Word Count 4896 (1311) 10982 (3952) 7455 (4069)
SMOG Readability Index 14.5 (1.6) 15.6 (1.0) 15.0 (1.5)
No. of Pages 12.4 (3.0) 46.0 (16.6) 26.5 (19.9)
No. of Tables 2.9 (2.5) 12.2 (6.2) 6.8 (6.4)
No. of Figures 5.4 (2.4) 26.2 (6.2) 14.1 (11.2)
No. of Self-Assessments .9 (.4) .8 (.4) .8 (.4)
Ratio of Study Time to Class Time (range)
.53 (.11-5.0) : 1.0 .62 (.11-3.8) :1.0 .56 (.11-5.0) : 1.0
Predicted Reading Time* 24 minutes 54 minutes 37 minutes Ratio of Reading Time to
Self-reported Study Time (range)
1.0 : 5.31(9-58.8) 1.0 : 3.0 (.66- 20.2) 1:0 : 4.0 (.66-58.8)
reverse coding nature of the metric – the easier material had a higher percentage correct (eg, 90%) compared to more difficult material (eg, 70%). This results in more difficult material increasing study time because it be-comes less negative. Based on the regression results, an increase in difficulty of .05 (going from .85 to .80 for example) increases study time by 20 minutes. Other rea-sons for topic difficulty to be negatively associated with self-reported study time could be in these courses, reading material for the more difficult material was shorter in word count and used more tables and figures. During the model development, this was taken into account but it did not contribute significantly to the model. The read-ing material was developed to help efficiently deliver foundational content and as such, the more difficult ma-terial had easier language, more tables and fewer word count since tables were used to concisely summarize a large amount of information. A final explanation is that in pharmacokinetics (PHCY 413), the easier material also was longer because this content should have been mostly review from previous course work. To note, in PHCY 413, quizzes covered multiple chapters compared to phys-iology (PHCY 203) that only covered one chapter. This difference in number of chapters might also explain some of the discrepancies between word count and self-reported study time.
Another possible explanation for a potential discon-nect between self-reported study time and topic difficulty is the theory related to study time allocation – the region of proximal learning. In this model, when time pressure exists, students spend more time on easy to learn
mate-rial.20,21This is in contrast to the discrepancy reduction
model22,23that states learners will study items perceived
to be more difficult longer than easy items to reduce the discrepancy between what has been learned and what is sought to be learned; this suggests a negative correlation
between difficulty and study time.24The region of
prox-imal learning emphasizes that the perceived rate of learn-ing is the crucial determinant of how long study persists, that is learners will study material until the benefits of study are perceived no more or at least when the rate of learned is reduced. Thus learners are attempting to be strategic in their learning, thus spending time on the big-gest outcome. This could influence a third factor, student grades.
Student quiz grades were a combination of a team graded quiz and individual scores from the in-class quiz. Knowing the point breakdown, students could put less effort into the lower point individual quiz knowing the team quiz was worth more and that the team score is more likely to receive a higher grade than the individual score. Again, this might suggest a strategic approach to learning balancing desired grade and understanding the material. To put these courses in context with the semester, during each semester, students were completing approximately 17 credits of classes, thus time pressures tend to be high. It is reasonable to conclude that part of the study time equa-tion may be time-limited because of competing commit-ments associated with a professional pharmacy program. The readability index (SMOG) of the text did not contribute to length of self-reported study time. The read-ability did interact with topic difficulty which may be explained by the scientific jargon within unfamiliar topics. In addition, the lack of predictability could be
Figure 1. Distribution of Self-reported Study Times for Physiology (PHCY 203), Pharmacokinetics (PHCY 413), and Combined Data.
a function that the readability index of material was in the range of the reading level of student as the SMOG index provides a level of education required to understand the material. Some reading material, like textbooks or thera-peutic guidelines, have reading levels that are higher than
the average student’s reading level.25In these cases, study
time may be longer because of the additional time to un-derstand the text.
One component that was positively correlated to study time was completing self-assessments. Although this is not a component of the reading time, it was included as a contributing factor as the results may be used to in-form re-reading of the material. Students who completed the self-assessment quiz correlated to longer study times and contributed a small fraction of the explained variabil-ity; adding a self-assessment increased self-reported study time by 13 minutes (0.21 hours). This longer study time may be a result of quizzes taking extra time. These quizzes were often short, true/false assessments. These quizzes also could result in students re-studying after the assessment to clear up areas of confusion and/or mis-understanding, which would extend study time. This was the intended purpose of the ungraded, self-assessments.
When examining the distribution of reading time to study time, there was a subset of the population that was self-reporting spending almost twice as much time
studying. However, this was weighted more toward the physiology course. One explanation may be these stu-dents may not have previously covered the organ system in prerequisite coursework. Physiology is a prerequisite course and re-taught in context of pharmacy to ensure students have the foundational concepts needed for future pharmacotherapy coursework. As such, some students may have not previously discussed all the organ systems prior to entering pharmacy school and thus spend extra time studying that material. We have found some anec-dotal evidence of this over the years and have some con-firmatory evidence from a pre-semester assessment (manuscript in preparation). Other potential reasons are some fraction of students are unaccustomed to learning on their own and had trouble adjusting to the self-directed portion of the course; and it could have been several years since students completed physiology and thus spent extra time re-learning.
Several limitations are present in this study but pres-ent opportunities for additional research. One of the lim-itations of the study is the self-reported nature of study time. Study time was acutely retrospective (ie, distance between recall and event was close) which should mini-mize recall-bias. Quiz preparation time (study time) was recorded during each quiz, but still required retrospection, which could be potentially bias in the estimates. This
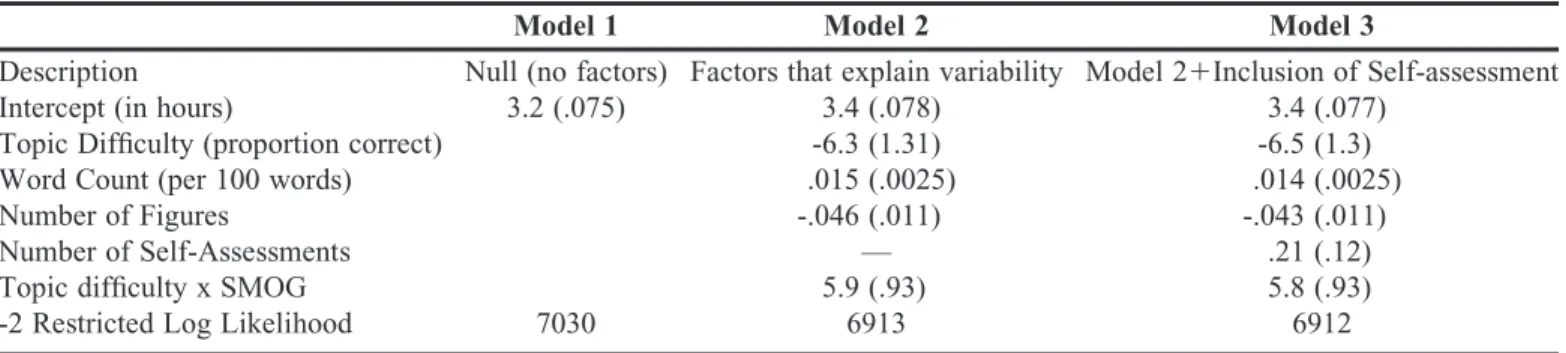
Table 3. Regression Coefficients (Standard Error) From Multilevel Linear Regression (Only factors that contributed to the explained variability are included)
Model 1 Model 2 Model 3
Description Null (no factors) Factors that explain variability Model 21Inclusion of Self-assessment Intercept (in hours) 3.2 (.075) 3.4 (.078) 3.4 (.077)
Topic Difficulty (proportion correct) -6.3 (1.31) -6.5 (1.3) Word Count (per 100 words) .015 (.0025) .014 (.0025)
Number of Figures -.046 (.011) -.043 (.011)
Number of Self-Assessments — .21 (.12)
Topic difficulty x SMOG 5.9 (.93) 5.8 (.93)
-2 Restricted Log Likelihood 7030 6913 6912
Table 2. Correlations for Various Parameters Investigated
Topic Difficulty
Word Count
Reading Level
No. of
Pages No. of Tables
No. of Figures
No. of Self- Assessments
Self-reported Study Time -.18b .19b 0.082b .18b .16a .15b .087b Topic Difficulty -.78b -.37b -.78b -.88b -.72b .11b
Word Count .37b .97b .86b .91b -.071a
Reading Level .29b .36b .32b -.021
No. of Pages .90b .97b -.098b
No. of Tables .85b -.10b
No. of Figures -.12b
a
p,.01 b
could be further complicated by our ability to internally estimate time. In a meta-analysis, retrospective judgments of time during high cognitive load conditions (which may represent studying) participants to underestimate time
spent on task26which suggests study time may be longer
than self-reported. Conversely, a study found students overestimate their time doing homework when compared
to a technology-based monitoring system.27In addition,
there could be some social or norm-bias when reporting preparation time although one study found negligible contributions on large scale student reports of academic
behaviors.28The recall limitation could be overcome with
study logs but this method also would have its limitations. In a recent study, students predicted they spend 4.4 hours studying a week but recorded in daily logs 3.8 hours (a 14% difference) suggesting students may have accurate
assessments of study time.29 Ideally preparation time
would be directly observed but is impractical in an au-thentic classroom situation.
The self-reported nature of study time is the pri-mary limitation but other limitations may warrant be-ing addressed. A second limitation is the measure of topic difficulty. This was based on historical quiz data, quizzes that were studied from the text, so it may be difficult to tease apart difficulty because of content or because of the influence of the quality of pre-class material. However, the topic difficulties are consistent with more challenging concepts in both courses. Another potential limitation could be student interest in topics, motivation (eg, ap-proach versus avoidance), and stress which could impact time on task. Global time pressures (ie, time demands from a professional curriculum) and stress, lack of interest or an avoidance motivation (ie, avoid failure) may reduce
engagement in a task.30-32Students could have also not
used the text to prepare for the RAP; it has been reported that students may not buy or read the textbook but this
may be due to a lack of accountability.33 This may be
minimized in this study because students were held ac-countable for preparation and the text was free with over 100 students paying for a printed copy. The text was the primary source of information for the course for pre-class preparation. The final limitation is the use of instructor-developed material and not commercial text. Instructor material was developed to help make pre-class prepara-tion more efficient compared to using commercial texts that would have larger word counts and generally require a higher reading level to understand.
The main implication of this study is that predicted reading time based on average adult reading speed most likely underpredicts the amount of time students will spend preparing for some measure of accountability like
a quiz. Table 4 provides some guidance on translating Table
length of reading into approximate quiz preparation time. Simulations were performed for various length docu-ments using a ratio of predicted reading time to study time ratios and the regression model; the regression was used to predict study time solely based on word count of mod-erately difficulty content. Time estimates from the regres-sion are higher because figures contribute to reducing study time and the figures were left out of this prediction. Out-of-class time management is important within
the flipped classroom.34Within a professional program,
students’ time is limited for out-of-class studying and preparation given the time activities of daily living, time spent in class, and extra- and co-curricular activities thus pre-class learning material needs to be efficient and
ef-fective to optimize student preparation.29As mentioned
already, students have time logged spending 4.4 hours a day studying which translates to almost 30 hours a week for a 6-course load. This suggests that students have five to six hours of out-of-class time per course (a ratio of
1 in-class credit hour52 out-of-class hours). Taking the
self-reported estimates from this study (;3 h),
approx-imately 50% to 60% of that five to six hours per course may be dedicated to pre-class preparation, leaving ap-proximately two to three hours for homework or other study (assuming equal weighting of logged study time across courses).
CONCLUSION
We found a small predictive relationship between reading material characteristics and pre-class study time in a flipped course model. Study time is complex and takes into account the source material quality and quan-tity, but other factors such as goal orientation. One of the major findings from this study is that study time is much greater than predicted reading time based on word count or page length. Thus, instructors who are utilizing the flipped model need to account for student study time by using more than just how “long” is the pre-class assignment.
ACKNOWLEDGMENTS
The authors would like to thank Jacqueline McLaughlin, PhD, for her assistance and input in the regression analysis.
REFERENCES
1. Michaelsen LK, Knight AB, Fink LD.Team-Based Learning: A Transformative Use of Small Groups. Westport, CT: Praeger; 2002. 2. Khanova J, Roth MT, Rodgers JE, McLaughlin JE. Student experiences across multiple flipped courses in a single curriculum.
Med Educ.2015;49(10):1038-1048.
3. Persky AM. The impact of team-based learning on a foundational pharmacokinetics course.Am J Pharm Educ.2012;76(2):Article 31.
4. Persky AM. Qualitative analysis of animation versus reading for pre-class preparation in a “flipped” classroom.J Excel College Teach.
2015;26(1):5-28.
5. Persky AM, Pollack GM. A modified team-based learning physiology course.Am J Pharm Educ.2011;75(10):Article 204. 6. Miles JR, Stine-Morrow EA. Adult age differences in self-regulated learning from reading sentences.Psychol Aging.2004; 19(4):626-636.
7. Walczyk JJ, Taylor RW. How do the efficiencies of reading subcomponents relate to looking back in text?J Educ Psychol.
1996;88(3):537-545.
8. Zwaan RA. Processing narrative time shifts.J Exp Psychol Learn Mem Cogn1996;22(5):1196-1207.
9. Kliegl R, Grabner E, Rolfs M, Engbert R. Length, frequency, and predictability effects of words on eye movements in reading.Eur J Cogn Psychol2004;16(1-2):262-284.
10. Just MA, Carpenter PA, Keller TA, Eddy WF, Thulborn KR. Brain activation modulated by sentence comprehension.Science
1996;274(5284):114-116.
11. Dyson MC. How physical text layout affects reading from screen.Behav Inform Tech.2004;23(6):377-393.
12. Sanocki T, Dyson MC. Letter processing and font information during reading: beyond distinctiveness, where vision meets design.
Attent Percept Psychophys.2012;74(1):132-145.
13. Dillon A. Reading from paper versus screens: a critical review of the empirical literature.Ergonomics1992;35(10):1297-1326. 14. Abu-Leil AK, Share DL, Ibrahim R. How does speed and accuracy in reading relate to reading comprehension in Arabic?
Psicologica.2014;35(2):251-276.
15. Carver RP. Reading rate: theory, research, and practical implications.J Read.1992;36(2):84-95.
16. Balota DA. Speed reading: you can’t always get what you want, but can you sometimes get what you need?Psychol Sci Public Interest. 2016;17(1):1-3.
17. Persky AM, Pollack GM. Transforming a large-class lecture course to a smaller-group interactive course.Am J Pharm Educ.
2010;74(9):Article 170.
18. Persky AM, Henry T, Campbell A. An exploratory analysis of personality, attitudes, and study skills on the learning curve within a team-based learning environment.Am J Pharm Educ.2015;79(2): Article 20.
19. Laughlin GHM. SMOG grading – a new readability formula. 1969;12(8):639-646.
20. Son LK, Metcalfe J. Metacognitive and control strategies in study-time allocation.J Exp Psychol Learn Mem Cogn.2000; 26(1):204-221.
21. Metcalfe J, Kornell N. A region of proximal learning model of study time allocation.J Mem Lang2005;52(4):463-477.
22. Dunlosky J, Hertzog C. Older and younger adults use
a functionally identical algorithm to select items for restudy during multitrial learning.J Gerontol Series B Psychol Sci Soc Sci.1997; 52(4):178-186.
23. Dunlosky J, Thiede KW. What makes people study more? An evaluation of factors that affect self-paced study.Acta Psychologica
1998;98(1):37-56.
24. Nelson TO, Dunlosky J, Graf A, Narens L. Utilization of metacognitive judgments in the allocation of study during multitrial learning.Psychol Sci.1994;5(4):207-213.
26. Block RA, Hancock PA, Zakay D. How cognitive load affects duration judgments: a meta-analytic review.Acta Psychol.2010; 134(3):330-343.
27. Rawson K, Stahovich TF, Mayer RE. Homework and achievement: using smartpen technology to find the connection.
J Educ Psychol.2016;109(2):208-219.
28. Miller AL. Investigating social desirability bias in student self-report surveys.Educ Res Q.2012;36(1):30-47.
29. Zeeman JM, Angelo TA. Where does the time go? Enhancing first-year pharmacy student self-awareness with time-logging. Annual Meeting of the American Association of Colleges of Pharmacy. Anaheim, CA.Am J Pharm Educ.2016;80(5):Article S2. 30. Byron K, Khazanchi S, Nazarian D. The relationship between stressors and creativity: a meta-analysis examining competing theoretical models.J Appl Psychol.2010;95(1):201-212.
31. Elliot AJ, McGregor HA. A 232 achievement goal framework.
J Pers Soc Psychol2001;80(3):501-519.
32. Huang C. Achievement goals and achievement emotions: a meta-analysis.Educ Psychol Rev.2011;23(3):359-388.
33. Robinson CD, Schlesselman LS. Required textbooks: are students buying and reading them? 115thAnnual Meeting of the American Association of Colleges of Pharmacy, July 26-30, 2014, Grapevine, Texas.Am J Pharm Educ.2014;78(5):Article 111. 34. Persky AM, McLaughlin JE. The flipped classroom – from theory to practice in health professional education.Am J Pharm Educ.
2017;81(6):Article 118.