SEISMIC RECORD OF WEST ANTARCTIC ICE SHEET DYNAMICS DURING THE LATE OLIGOCENE TO EARLY MIOCENE IN THE EASTERN BASIN, ROSS SEA
Seth Jennings Brazell
A dissertation submitted to the faculty of the University of North Carolina at Chapel Hill in partial fulfillment of the requirements for the degree of Doctor of Philosophy in
the Department of Geological Sciences.
Chapel Hill 2017
Approved by: Donna M. Surge
Larry K. Benninger José A. Rial
iii ABSTRACT
Seth Jennings Brazell: Seismic record of West Antarctic Ice Sheet dynamics during the late Oligocene to early Miocene in Eastern Basin, Ross Sea
(Under the direction of Donna M. Surge)
multi-iv
channel seismic profiles. Using the spectral decomposition technique, I develop a higher resolution, third-order sequence stratigraphic model of late Oligocene to early Miocene
sequences within the Eastern Basin to test hypotheses about the evolution of the WAIS. I identify evidence of an expanding late Oligocene WAIS and waning ice volumes during the early
Miocene. Using seismic-stratigraphic stacking patterns, I correlated relative sea level fluctuations recorded in the Eastern Basin to global eustatic and oxygen isotope events and refined
v
ACKNOWLEDGEMENTS
I am grateful for the support and guidance of Donna Surge and Lou Bartek who were instrumental in this project. I offer a special thanks to Chris Sorlien who was generous with his time and resources and was a great mentor during my PhD. This work greatly benefited from our many conversations and your helpful insights and suggestions. This project was supported by the Department of Geological Sciences at the University of North Carolina – Chapel Hill and the Martin Fund, National Science Foundation grant PLR-1341585 to Christopher Sorlien and Bruce Luyendyk at the University of California – Santa Barbara, and dGB Earth Sciences. Technical support was provided by Nigel Wardell (OGS, Trieste, Italy), Suzanne Carbotte (LDEO,
vi
TABLE OF CONTENTS
LIST OF TABLES ... ix
LIST OF FIGURES ... x
LIST OF ABBREVIATIONS ... xii
CHAPTER 1: SPECTRAL DECOMPOSITION AND SEISMIC ATTRIBUTE ANALYSIS AS A TOOL FOR 2D SEISMIC ENHANCEMENT: A CASE STUDY USING LEGACY SEISMIC DATA FROM THE ANTARCTIC MARGIN ... 1
1.1 Introduction ... 1
1.2 Methods... 3
1.3 Results ... 6
1.4. Discussion ... 9
1.5. Conclusions ... 11
REFERENCES ... 12
CHAPTER 2: SEISMIC REFLECTION RECORD OF LATE OLIGOCENE TO EARLY MIOCENE THIRD-ORDER SEQUENCE STRATIGRAPHY IN EASTERN BASIN, ROSS SEA ... 14
2.1 Introduction ... 14
2.2. Methods... 22
2.3. Description of Seismic Features ... 24
2.3.1 Erosional Features ... 24
2.3.2 Depositional Features ... 25
vii
2.4. Description of Seismic Sequences and Horizons ... 25
2.4.1 Sequence 6 (RSS-2.6-EB): Roosevelt subbasin ... 27
2.4.2 Sequence 5 (RSS-2.5-EB) ... 36
2.4.3 Sequence 4 (RSS-2.4-EB) ... 38
2.4.4 Sequence 3 (RSS-2.3-EB) ... 41
2.4.5 Sequence 2 (RSS-2.2-EB) ... 41
2.4.6 Sequence 1 (RSS-2.1-EB) ... 43
2.5. Interpretation of Seismic Features and Sequences ... 43
2.5.1 Erosional and Depositional Seismic Features ... 43
2.5.1.1 Channels ... 43
2.5.1.2 Troughs ... 44
2.5.1.3 Mounds ... 45
2.5.1.4 Rugose Reflectors ... 45
2.5.2 Seismic Sequences and Stratigraphy ... 46
2.5.2.1 Sequence 6 – Roosevelt Subbasin ... 46
2.5.2.2 Sequence 5 ... 48
2.5.2.3 Sequence 4 ... 50
2.5.2.4 Sequence 3 ... 50
2.5.2.5 Sequence 2 ... 51
2.5.2.6 Sequence 1 ... 53
2.5.3 Late Oligocene to early Miocene Glacial History of Eastern Basin ... 53
viii
REFERENCES ... 58
CHAPTER 3: ANTARCTIC CRYOSPHERE EVOLUTION DURING THE LATE OLIGOCENE TO EARLY MIOCENE FROM THE EASTERN BASIN, ROSS SEA ... 63
3.1. Introduction ... 63
3.2. Methods and Data ... 73
3.3 Results and Discussion ... 73
3.3.1 Stratal Architecture, Systems Tracts and Relative Sea Level ... 73
3.3.2 Sequences and Eustatic Events ... 82
3.3.3 Evidence of Glaciations ... 86
3.3.3.1 Seismic Record ... 86
3.3.3.2 Drill Core Record ... 88
3.3.4 Eastern Ross Sea Glacial History ... 90
3.4 Conclusions ... 93
ix
LIST OF TABLES Table
x
LIST OF FIGURES
Figure 1.1 Location of study areas, Ross Sea and Prydz Bay,
Antarctica ... 2
Figure 1.2. Comparison of moderate-resolution, low-resolution and spectral decomposition temporal enhancement images ... 5
Figure 1.3. Frequency spectrum of profile IT89AR-34. ... 8
Figure 2.1. Location map of Eastern Basin, Ross Sea, Antarctica ... 16
Figure 2.2. Sequence stratigraphic model ... 18
Figure 2.3. Single channel seismic profile PD90-30 ... 20
Figure 2.4. Summary of third-order sequence stratigraphic units in the Eastern Basin, Ross Sea ... 22
Figure 2.5. Examples of seismic features identified within RSS-2-EB ... 23
Figure 2.6. Single channel seismic profile NBP0301-27A ... 26
Figure 2.7. Seismic reflection profile of SCS PD90-22 and line drawing of regional horizons and sequences within RSS-2-EB ... 29
Figure 2.8. Time-depth structure map of horizon RSU6-EB ... 30
Figure 2.9. Feature map of horizon RSU5.12-EB ... 31
Figure 2.10. Time-depth structure map of horizon RSU5.11-EB ... 32
Figure 2.11. Fence diagram of seismic profiles PD90-21 and NBP0301-13A3 ... 33
Figure 2.12. Seismic profile BGR007-1 ... 34
Figure 2.13. Feature map of horizon RSU5.13-EB ... 35
Figure 2.14. Seismic profile PD90-22 ... 37
Figure 2.15. Feature map of horizon RSU5.06-EB ... 38
xi
Figure 2.17. Structure map of RSU5.03-EB ... 42
Figure 2.18. Multi-channel seismic profile NBP9601-T06 ... 43
Figure 2.19. Structure map of RSU5-EB ... 52
Figure 3.1. Location map of Eastern Basin, Ross Sea ... 63
Figure 3.2. Cross section of Antarctica showing ice surface and BEDMAP bed elevations ... 64
Figure 3.3. Sequence stratigraphic model ... 66
Figure 3.4. Correlation chart of Eastern Basin, Ross Sea sequence stratigraphy and relative sea level curve to eustatic sea level curve and oxygen isotope events ... 68
Figure 3.5. Seismic reflection profile NBP0301-27 ... 72
Figure 3.6. Seismic reflection profile PD90-30 ... 75
Figure 3.7. Seismic reflection profile BGR007-1 ... 77
xii
LIST OF ABBREVIATIONS
ANTOSTRAT The Antarctic Offshore Stratigraphy project CIROS Cenozoic Investigation in the Western Ross Sea
CRP Cape Roberts Project
CWT Continuous wavelet transform DSDP Deep Sea Drilling Project EAIS East Antarctic Ice Sheet
EB Eastern Basin
GZW Grounding zone wedge
HST Highstand systems tract
IODP Integrated Ocean Drilling Program
IRD Ice rafted debris
LST Lowstand systems tract
MCS Multi-channel seismic
MFS Maximum flooding surface
Mi Miocene
MSSTS McMurdo Sound Sediment and Tectonic Studies
Oi Oligocene
Plio Pliocene
RSL Relative sea level
RSS Ross Sea sequence
RSU Ross Sea unconformity
xiii
SCS Single channel seismic
SMW Shelf margin wedge
SWFFT Short window fast Fourier transform TST Transgressive systems tract
TWTT Two-way travel time
VE Vertical exaggeration
1
CHAPTER 1: SPECTRAL DECOMPOSITION AND SEISMIC ATTRIBUTE ANALYSIS AS A TOOL FOR 2D SEISMIC ENHANCEMENT: A CASE STUDY USING LEGACY
SEISMIC DATA FROM THE ANTARCTIC MARGIN
1.1 Introduction
Seismic attribute analyses can enhance interpretation of 2D seismic data sets without the need for time-consuming reprocessing. The analysis of seismic attributes of 3D seismic datasets has been well documented (White 1991; Taner et al., 1994; Brown, 1996; Marfurt et al., 1998; Peyton et al., 1998; Barnes 2000, 2001; Chopra and Marfurt 2005). As the use and understanding of seismic attributes have improved over the last three decades, relatively little work has been recently conducted documenting the application of seismic attributes to legacy 2D seismic datasets. The work that follows is a case study discussing the application of short-window fast Fourier transform (SWFFT) and continuous wavelet transform (CWT) spectral decomposition as a tool to enhance the temporal resolution of seismic reflection profiles (Figure 1.1).
The Antarctic margin is a key area in which to investigate the application of post-stack seismic attributes on 2D seismic data. Legacy seismic data sets comprise a significant portion of seismic reflection data along the Antarctic margin and, in some places, seismic reflection data collected in the early 1990s and prior is the only available geophysical data. Reprocessing legacy data is a labor intensive and time-consuming method that often yields limited results.
2
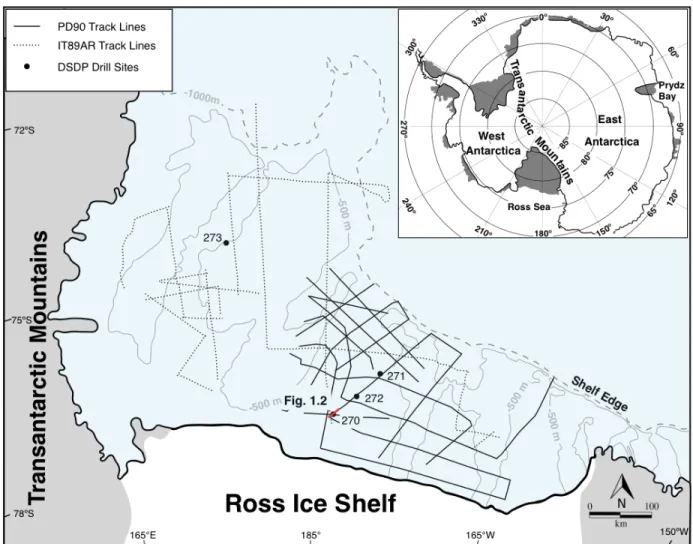
Figure 1.1 Location of study area: Ross Sea, Antarctica. Thin black and dashed lines are seismic track lines. Closed circles are DSDP Leg 28 drill sites along the Ross Sea margin.
that aids the interpreter by highlighting subtle features that are not obvious in standard amplitude section.
3
intermediate-resolution single channel seismic (SCS) surveys conducted by Anderson and Bartek (1992) and Bart (2004) showed that while SCS data do not clearly image below the sea floor multiple, their higher frequency sources are required to image detailed seismic facies that are not recognized in MCS data with lower source frequencies. MCS data from the Ross Sea can
penetrate below the sea floor multiple and image older strata that may have been deposited or modified by mid-Cenozoic Antarctic glaciation. This study investigates the applicability of post-stack seismic attributes of 2D MCS data to enhance the resolution and extract additional
information from the seismic data that may be useful for understanding seismic features and facies that are currently not imaged in traditional standard amplitude profiles.
1.2 Methods
The data sets used for this study include intermediate- and low-resolution seismic reflection data [BMR (Australia) 1982 multi-channel survey using a 460 cu. in air gun with a penetration depth of 6 seconds and vertical resolution of 30 meters; OGS Trieste (Italy) 1989 multi-channel survey using 2 arrays of air guns (45.16 liter volume) with a penetration depth of 6 seconds and a vertical resolution of 40 meters; Rice University (USA) 1990 single channel survey using a 150 cu. in air gun with a penetration depth of 1.5-2.0 seconds and a vertical resolution of 12 meters] and published lithologic descriptions from DSDP Leg 28, 119 and 188 drill sites (Hayes and Frakes, 1975; Stagg et al., 1983; Barron et al., 1991; De Santis et al., 1995; O’Brien et al., 2001).
4
images of the frequency filtered seismic data were created at 1 Hz increments. Frequencies that displayed non-periodic absorption surfaces with the highest temporal resolution and within the data’s bandwidth were used for subsequent interpretation.
5
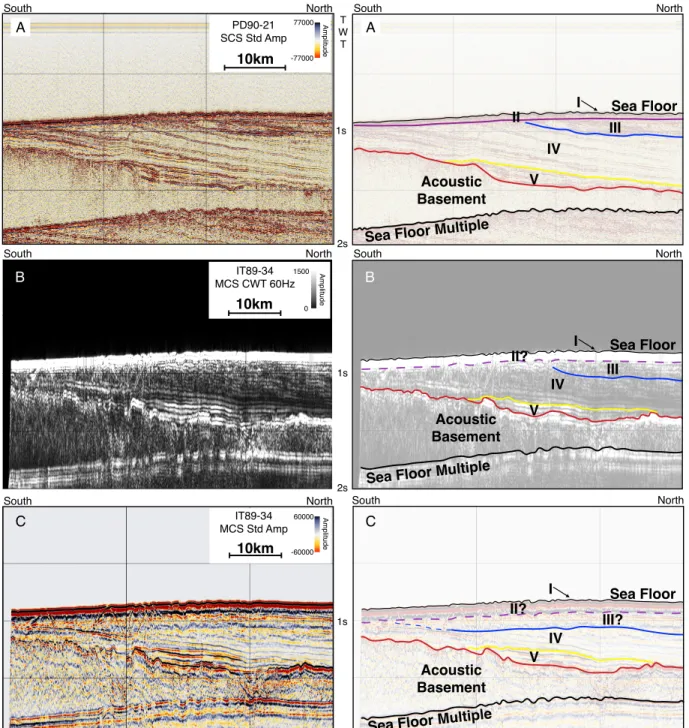
Figure 1.2. Comparison of moderate-resolution, low-resolution and spectral decomposition temporal enhancement images and their corresponding interpreted line drawings. A) Profile 1, PD90-21, moderate-resolution SCS profile showing scoured sea floor and seismic Units II-V separated by unconformities; B) Profile 2, IT89-AR34, CWT spectral decomposition image showing enhanced temporal resolution by resolving Units II-V with similar characteristics as identified in moderate-resolution seismic profile PD90-21; C) Profile 2, IT89-AR34, low-resolution MCS profile showing scoured sea floor and seismic Units II-V with different characteristics than PD90-21 or the spectral decomposition of IT89-AR3.
T W T 1s 1s 1s 2s 2s 2s C B A 10km 10km 10km 0 1500 -77000 77000 -60000 60000 IT89-34 MCS Std Amp
IT89-34 MCS CWT 60Hz
PD90-21 SCS Std Amp
South South South North North North Amp litu d e Amp litu d e Amp litu d e A South North
Sea Floor Multiple Acoustic Basement Sea Floor II III IV V I B South North C South North Sea Floor I Sea Floor I III IV V
Sea Floor Multiple Acoustic Basement
6 1.3 Results
Two obliquely overlapping seismic profiles, MCS IT89-AR34 and SCS PD90-21 (see Figure 1.1 for location), highlight differences in resolution between MCS and SCS profiles (Figure 1.2). Figure 1.2A shows PD90-21, an intermediate-resolution SCS profile with 5 distinct features and units. Sea floor morphology (Feature I) changes from smooth reflections to the south becoming wavy as the sea floor rises to the north. Diffraction hyperbolas are present at the sea floor and at the base of Unit I and extend below 1 second two-way travel time (twtt) and obscure portions of the profile. Beneath the sea floor Unit II is a thin package of discordant to sub-parallel reflections. Unit III is comprised of downlapping reflections dipping to the north and separated from Unit IV below by an unconformity that truncates closely spaced, sub-parallel, down dip converging reflections. Unit IV contains down-dip converging, acoustically laminated units. Reflections within Unit IV alternate between moderate to high-amplitude, laminated, continuous reflections and low-amplitude reflections that become discontinuous to acoustically transparent in the down-dip direction. Just above the base of Unit IV reflections become lower frequency and become discontinuous. The basal reflection of Unit IV truncates the top of Unit V and reflection character changes to high-amplitude and moderately continuous within a
depression above acoustic basement.
7
has a thickness of approximately 100 milliseconds (ms) of travel time and the possible
occurrence of a ghost multiple obscures any stratigraphic reflections close to it. Unit III contains sub-horizontal reflections that grade from discontinuous to the south and becoming more
continuous, high-amplitude and high-frequency to the north. Unit III of IT89-34 contains reflections that dip slightly to the north but cannot be interpreted as foresets within a grounding zone wedge as interpreted in profile PD90-21. Unit IV is bounded on the top by truncation and at the base by onlap, downlap and a change in reflection character. Internal reflections gradually change from low-frequency, high-amplitude continuous and discontinuous to the south to higher-frequency, low-amplitude and continuous to the north. The alternating character of Unit IV in PD90-21 between high-frequency continuous to acoustically transparent is not present in Unit IV of IT89-34. Unit V in both MCS and SCS profiles is characterized by continuous,
high-amplitude reflections occupying a depression above acoustic basement. Additionally, Unit V in IT89-34 contains low-frequency reflections, dissimilar to the high-frequency reflections contains in Unit V of PD90-21.
8
converge down dip, to the north, with bed thicknesses decreasing with depth. The alternating patterns of high-frequency, continuous reflections and acoustically transparent facies is not apparent in Figure 1.2B, as it is in Figure 1.2A. Unit V is distinguished from Unit IV by its high amplitude values and continuous reflections that occupy a depression just above acoustic
basement.
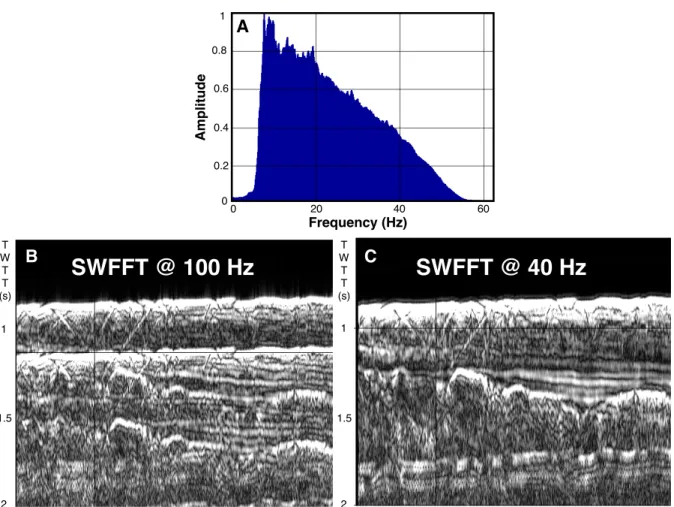
Figure 1.3. A) Frequency spectrum of profile IT89AR-34. B) Spectral decomposition at a frequency outside of the bandwidth of profile IT89AR-34 and C) spectral decomposition at a frequency within of the bandwidth of profile IT89AR-34. Spectral decomposition outside
seismic bandwidth produces periodic, high frequency reflections that obscure the seismic image.
T W T T (s) 1 2 1.5 B 1 2 1.5 T W T T (s) C A m p li tu d e Frequency (Hz) 0
20 40 60
0 0.2 0.4 0.6 0.8 1 A
SWFFT @ 100 Hz
SWFFT @ 40 Hz
9 1.4. Discussion
SWFFT uses time gates to isolate temporal segments of the seismic trace upon which the fast Fourier transform is performed. The seismic trace frequency and resolution must be
considered when selecting an appropriate time gate for a SWFFT operation. Selecting a time gate that is too small will result in a high temporal resolution, at the cost of frequency resolution. A large time gate will result in a high frequency resolution but with poor temporal resolution. Another spectral decomposition method that does not require the user to select a time gate is a continuous wavelet transform. A CWT function uses compressed and shifted variants of a mother wavelet, known as daughter wavelets, and the resulting spectral analysis contains higher frequency resolution for lower frequencies and higher temporal resolution for higher frequencies. Common mother wavelets include Gaussian, Morlet and Ricker wavelets. CWT analysis was the preferred method of spectral decomposition because it requires fewer input parameters and, unlike the SWFFT, it offers better time and frequency localization.
10
resolution enhancement below 500 ms below the sea floor. As depth increases and
high-frequency data is attenuated, spectral decomposition resolution will diminish and should not be used. Imaging a seismic profile at time depths below ~500 ms will require lower frequencies than were used to image reflections at shallower depths. It is recognized that increasing streamer tow depths (tow depth is typically increased in poor sea surface conditions) in addition to low pass filters applied to seismic data will reduce the ability of spectral decomposition to resolve higher frequency information, however, the effects of various pre- and post-stack processing should be investigated further to understand their impacts.
The wavy sea floor reflections to the north in Figure 1.2A are interpreted as ice scouring features that occurred during Last Glacial Maximum ice expansion when the West Antarctic Ice Sheet advanced across the Ross Sea towards the shelf edge (Anderson et al., 2013). Spectral decomposition did not appear to enhance the resolution of the sea floor. This result may be related to the large impedance contrast between ocean water and the sea floor and that no reflections occur above this interface, precluding seismic aliasing that may obscure additional detail. Unit II reflections are interpreted as a Plio-Pleistocene and younger deposits above an angular unconformity that separates it from Miocene and older seismic sequences Units III and IV (ANTOSTRAT, 1995). Unit II reflections are obscured in MCS profile IT89-AR34 standard amplitude section and the spectral decomposition image (Figures 1.2B and 1.2C). Unit III in profile PD90-21is interpreted as northward dipping forests within a prograding grounding zone wedge (GZW) of early to middle Miocene age (Anderson and Bartek, 1992; DeSantis et al., 1995). Standard amplitude profile IT89-AR34 (Figure 1.2C) displays Unit III as lower
11
correspond to the seismic characteristics imaged in nearby intermediate-resolution SCS profile PD90-21 (Figure 1.2A). Interpretation of profile IT89-AR34 standard amplitude image alone may lead to the incorrect interpretation that a thick package of sub-horizontal material exists below the sea floor and a failure to identify the seismic characteristics of Unit III properly. Spectral decomposition was helpful for enhancing shallow reflections (seismic units II & III) but shows little enhancement of deeper units IV and V. This may suggest that higher resolution imaging below the sea floor multiple may not be possible with this technique.
1.5. Conclusions
This work investigated the use of seismic attributes to enhance the resolution of legacy multi-channel seismic reflection data from the Antarctic margin and the implications of how these reinterpreted data sets may yield a more robust understanding of the evolution of the Antarctic Ice Sheets. Additionally, these techniques may be applied to a variety of modern or legacy 2D seismic data sets around the globe.
12
REFERENCES
Anderson, J.B., and Bartek, L.R., 1992. Cenozoic glacial history of the Ross Sea revealed by intermediate resolution seismic reflection data combined with drill site information, in The Antarctic Paleoenvironment: A perspective on global change. Antarctic Research Series, v. 56. edited by Kennett, J.P., and Warnke, D.A., AGU, Washington, D.C. Anderson, J.B., Conway, H., Bart, P.J., Witus, A.E., Greenwood, S.L., McKay, R.M.,
Hall., B.L., Ackert, R.P., Licht, K., Jakobsson, M., and Stone, J.O., 2013. Ross Sea paleo-ice drainage and deglacial history during and since the LGM. Quaternary Science
Review, v. 100, pp. 31-54.
ANTOSTRAT Project, 1995. Seismic Stratigraphic Atlas of the Ross Sea, Antarctica. in: Geology and Seismic Stratigraphy of the Antarctic Margin, v. 2. Editors, Cooper, A.K., Barker, P.F., and Brancolini, G., 1995. Antarctic Research Series. AGU, Washington D.C., v. 68. plates 1-22.
Barnes, A.E., 2000. Attributes for automated seismic facies analysis. 70th Annual International Meeting, SEG, Expanded Abstracts. pp. 553-556.
Barnes, A.E., 2001. Seismic attributes in your facies. Canadian Society of Exploration Geophysicists Recorder. v. 26. pp. 41-47.
Bart, P.J., 2004. West-directed flow of the West Antarctic Ice Sheet across Eastern Basin, Ross Sea during the Quaternary. Earth and Planetary Science Letters. v. 228, pp. 425-438.
Brancolini, et al., 1995. Descriptive text for the Seismic Stratigraphic Atlas of the Ross
Sea. in: Geology and Seismic Stratigraphy of the Antarctic Margin, v. 2. Editors, Cooper, A.K., Barker, P.F., and Brancolini, G., 1995. Antarctic Research Series. AGU,
Washington D.C., v. 68. p. 303.
Brown, A.R., 1996. Interpretation of three-dimensional seismic data, 4th ed. American Association of Petroleum Geologists Memoir 42.
Busetti, M., and Zayatz, I., and Ross Sea Regional Working Group, 1994. Distribution of seismic units in the Ross Sea. Terra Antarctica, v. 1, no. 2, pp. 345-348.
Chopra, S., and Marfurt, K.J., 2005. Seismic attributes – A historical perspective. Geophysics. v. 70, no. 5, pp. 3SO-28SO.
Cooper, A.K., Barrett, P.J., Hinz, K., Traube, V., Leitchenkov. G., and Stagg, H.M.J.,
13
De Santis, L., Anderson, J.B., Brancolini, G., and Zayatz, I., 1995. Seismic record of
Late Oligocene through Miocene glaciation on the central and eastern continental shelf of the Ross Sea. in: Geology and Seismic Stratigraphy of the Antarctic Margin, v. 2.
Editors, Cooper, A.K., Barker, P.F., and Brancolini, G., 1995. Antarctic Research Series. AGU, Washington D.C., v. 68. pp. 235-260.
Hayes, D.E., and Frakes, L.A., 1975. Initial reports of the Deep Sea Drilling Project. v. 28, p. 1017. U.S. Government Printing Office, Washington D.C. pp. 211-278. Hinz, K., and Block, M., 1984. Results of geophysical investigations in the Weddell Sea
and in the Ross Sea, Antarctica. in: Proceedings of the 11th World Petroleum Congress, London. Wiley, New York. pp. 279-291
Houtz, R.E., and Meijer, R., 1970. Structure of the Ross Sea shelf from profiler data. Journal of Geophysical Research. v. 75, pp.6592-6597.
Houtz, R.E., and Davey, F.J., 1973. Seismic profiler and sonobouy measurements in the Ross Sea. Journal of Geophysical Research. v. 78, pp. 3448-3468.
Marfurt, K.J., Kirlin, R.L., and Farmer, S.L., Bahorich, M.S., 1998. 3-D seismic
attributes using a semblance-based coherency algorithm. Geophysics. v. 63, no. 4, pp. 1150-1165.
Peyton, L., Bottjer, R., and Partyka, G., 1998. Interpretation of incised valleys using
new 3-D seismic techniques: A case history using spectral decomposition and coherency. The Leading Edge. v. 17, pp. 1294-1298.
Taner, M.T., Schuelke, J.S., O’Doherty, R., an Baysal, E., 1994. Seismic attributes
revisited. 64th Annual International Meeting, SEG, Expanded Abstracts, pp. 1104-1106. White, R.E., 1991. Properties of instantaneous seismic attributes. The Leading Edge. v.
14
CHAPTER 2: SEISMIC REFLECTION RECORD OF LATE OLIGOCENE TO EARLY MIOCENE THIRD-ORDER SEQUENCE STRATIGRAPHY IN EASTERN BASIN,
ROSS SEA
2.1 Introduction
The late Oligocene to early Miocene glacial history of Antarctica, while poorly understood, is an important episode in the evolution of the West Antarctic Ice Sheet (WAIS). Far-field, stable isotope records (Abreu and Anderson, 1998; Lear et al., 2000; Zachos et al., 2001; Miller et al., 2005) indicate increased Antarctic ice volumes during the Oligocene; however, the contribution of the WAIS to the ice volume signal is poorly understood. More direct records from the margin and continent suggest variable timing of the presence of
significant ice on West Antarctica from the Oligocene to Miocene (De Santis et al., 1999; Wilch and Mcintosh, 2000; Sorlien et al., 2007a; Gohl et al., 2013; Spiegel et al., 2016). More research is needed to resolve the conflicting interpretations of WAIS history. This study investigates the stratigraphic architecture and seismic reflection features and facies of late Oligocene to early Miocene strata in the Eastern Basin, Ross Sea that reveals information about multiple Oligocene glaciations along the margin of West Antarctica and the evolution of the WAIS.
15
16
17
Oligocene (Sorlien et al., 2007a). Over a third of the modern WAIS drains into the Ross Sea and
likely has since the Neogene (Anderson and Shipp, 2001) which makes the Eastern Basin an
important location to investigate the evolution of the WAIS.
Prior to recognition that the West Antarctic Rift system has been subsiding since 104 Ma
(Luyendyk et al., 2001; Luyendyk et al., 2003), it was supposed that during the late Oligocene
through early Miocene, ice in this region was comprised of several small ice caps atop islands of
the West Antarctic archipelago (De Santis et al, 1995; Anderson and Shipp, 2001; DeConto and
Pollard, 2003). However, recent modeling by Wilson and others (2012, 2013) suggest that the
paleo-topography of West Antarctica was high enough to support a terrestrially based WAIS at
the Eocene-Oligocene boundary that expanded in concert with the East Antarctic Ice Sheet. The
timing of when the WAIS coalesced into an ice sheet large enough to impinge upon the
continental shelf is uncertain. Controversial evidence from seismic reflection studies of Ross Sea
suggest a grounded ice sheet in the western Ross Sea (Anderson and Bartek, 1992) and piedmont
glaciers (De Santis, et al., 1995) were present on or near Central High as early as the late
Oligocene and ice sheets advanced to the paleo-shelf edge by at least the middle Miocene
(Barrett, 1996; Abreu and Anderson 1998; Bart 2004). The record of Oligocene ice advance and
retreats in the Eastern Basin is poorly understood. The only direct sedimentological data from the
Eastern Basin comes from DSDP Leg 28, drillcores from Sites 270, 271 and 272, which had poor
recoveries (Hayes and Frakes, 1975). Due to limited sedimentologic data in the Eastern Basin,
the seismic stratigraphic record may yield the most direct and complete records of late Oligocene
through early Miocene glaciations.
Previous stratigraphic models of the Eastern basin have identified second-order
18
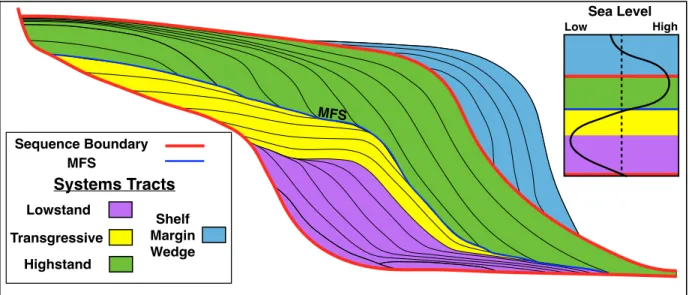
Figure 2.2. Sequence stratigraphic model adapted from Vail et al., (1977). Sequences are bounded by Sequence boundaries (bold red lines) that form during relative sea level falls. Within the lowstand systems tract (purple), strata onlaps the sequence boundary and thins basinward during relative sea level fall and just after the onset of relative sea level rise. Transgressive systems tract (yellow) is comprised of back-stepping strata that onlaps the sequence boundary with the rate of sea level rise exceeds the rate of sedimentation and is capped by a maximum flooding surface (MFS – blue line). The highstand systems tract (green) is comprised of prograding strata that is deposited as the rate of sea level rise falls below the rate of sedimentation. If sea level fall does not fall below the shelf break, a shelf margin wedge (light blue) is deposited.
ANTOSTRAT, 1995). To investigate higher frequency, third-order sequences (deposited over
0.5 Myrs to several Myrs) detailed correlation of higher resolution seismic data is required.
Brazell (2017) describes a technique for enhancing low-resolution, multi-channel seismic data by
spectral decomposition analysis. This technique, along with the recognition of seismic reflector
staking patterns, was used to correlate sets of genetically related sequences that are arranged in
distinctive patterns, or “composite sequences”.
Composite sequences stack into systems tracts, (lowstand, transgressive and highstand)
that reflect changes in basin accommodation and relative sea level (Kerans and Kempter, 2002).
A complete stratigraphic sequence contains a basal lowstand and transgressive systems tract,
Sea Level
Low High
Systems Tracts
Highstand Lowstand
Shelf Margin Wedge
MFS
Sequence Boundary MFS
Transgressive
19
Table 2.1. Seismic data used for this study. 1 Rice University (USA) 1990; 2 Bundesanstalt für Geowissenchaften und Rohstoffe (Germany) 1980; 3 Osservatorio Geofisico Sperimentale di Trieste (Italy) 1988, 1989, 1994; 4 Joint Stock Company Marine Arctic Geological Expedition (Russia) 1987, 1989; 5 Institute Fançaise du Pétrole (France) 1982; 6 Japanese National Oil Company 1982, 1992; 7 University of Alabama (USA) 1990; 8 University of North Carolina at Chapel Hill (USA) 1996; 9 University of California at Santa Barbara (USA) 2003; 10 University of Southern California (USA) 2008.
Seismic source (L)
Vertical resolution (m)
Penetration depth (s)
Cruise abbreviation
Air Gun 2.46 12 2.0 PD901
Air Gun 23.45 30 6.0 BGR2
Air Gun 22.5 20-30 3.0-4.0 IT883, IT893, IT943
Air Gun 10 60-70 6.0 SEV874, SEV894
Air Gun 35.54 30 6.0 IFP5
Air Gun 9.2 30 6.0 TH826, TH926
Air Gun 3.44 30 6.0 NBP96017
Air Guns: 1.72; 6.88; 10.3;
& 49.2
10-60 2.0-6.0 NBP03018,
NBP03069
Air Gun 0.8 10 2.0 NBP080210
TABLE 2.1: Seismic data
20
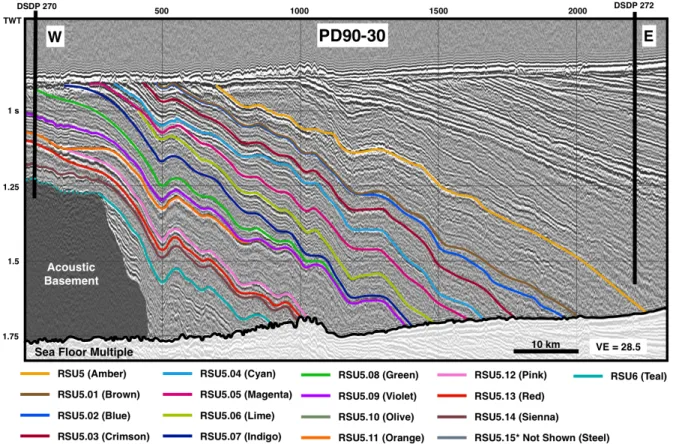
Figure 2.3. Dip-oriented, single channel seismic profile PD90-30 , RSS-2-EB horizons and locations of DSDP drillcore, Sites 270 and 272 (see Figure 2.1 for locations). Horizon colors are consistent across figures.
capped by a highstand systems tract and enveloped by sequence boundaries (Figure 2.2). The
lowstand systems tract is deposited during a relative sea level fall and directly after the onset of
relative sea level rise. The transgressive systems tract is deposited during the onset of coastal
transgression and is capped by a maximum flooding surface that marks the most landward
position of marine sediments and is associated with a period of reduced sedimentation. The
highstand systems tract is deposited when the rate of sediment accumulation exceeds the rate of
accommodation increase, resulting in a transition from back-stepping to aggradational and
21 section condensed or removed section condensed or removed Age Western Eastern Basin Sequences (this study) Roosevelt subbasin Sequence (this study) Eastern Eastern Basin Sequences (this study)
3rd Order Systems Tracts and Surfaces
(this study) Composite Sequences & Horizons (this study) Luyendyk et al., (2001) Brancolini et al., (1995) De Santis et al., (1995) Anderson and Bartek (1992)
~20 Ma RSU5-EB RSU5-EB ? RSU5-EB Sequence Boundary RSU5-EB RSU5 RSU5 RSU5 U5
Sequence 1 RSS-2.1-EB Sequence 1 RSS-2.1-EB Highstand Systems Tract RSS-2.1.1-EB RSS-2-upper RSS-2
Facies C - Massive Seismic Facies 12 RSU5.01-EB RSS-2.1.2-EB Maximum Flooding Surface RSU5.02-EB Lowstand Systems Tract RSS-2.1.3-EB
RSU5.03-EB RSU5.03-EB Sequence Boundary RSU5.03-EB
Facies B - Stratified Seismic Facies Sequence 2 RSS-2.2-EB Sequence 2 RSS-2.2-EB Highstand Systems Tract RSS-2.2.1-EB Maximum Flooding Surface RSU5.04-EB Transgressive & Lowstand Systems Tract RSS-2.2.2-EB
RSU5.05-EB RSU5.05-EB Sequence Boundary RSU5.05-EB
Sequence 3 RSS-2.3-EB Sequence 3 RSS-2.3-EB Highstand Systems Tract RSS-2.3.1-EB Facies C RSU5.06-EB RSS-2.3.2-EB RSU5.07-EB RSS-2.3.3-EB RSU5.08-EB RSS-2.3.4-EB Maximum Flooding Surface RSU5.09-EB Facies B Transgressive
Systems Tract RSS-2.3.5-EB
Transgressive
Surface RSU5.10-EB
Facies C Lowstand Systems
Tract RSS-2.3.6-EB
RSU5.11-EB RSU5.11-EB Sequence Boundary RSU5.11-EB
Sequence 4 RSS-2.4-EB
Lowstand Systems Tract (absent near MBL)
RSS-2.4-EB
RSU5.12-EB Sequence Boundary RSU5.12-EB
Sequence 5 RSS-2.5-EB Highstand Systems Tract RSS-2.5.1-EB Sequence 5 RSS-2.5-EB RSU5.13-EB RSS-2.5.2-EB Maximum Flooding Surface RSU5.14-EB Transgressive & Lowstand Systems Tract (expanded in Roosevelt Subbasin) RSS-2.5.3-EB RSS-2-lower RSU5.15-EB RSU5.15-EB Sequence 6 RSS-2.6-EB RSS-2.5.4-EB
~30 Ma RSU6-EB RSU6-EB RSU6-EB Sequence Boundary RSU6-EB RSU6 RSU6 RSU6 U6
22
Figure 2.4. Summary of third-order sequence stratigraphic units in the Eastern Basin, Ross Sea (including the western sector [column 2], Roosevelt Subbasin [column 3] and eastern sector [column 4]) and interpretations of correlations from published units. Column 1,
chronostratigraphic correlations from DSDP Site 270 (Leckie and Webb, 1983). Column 2, Third-order sequences and boundaries from this study. Column 5, systems tracts and major surfaces. Column 6, composite sequences and surface from this study. Horizon colors are used to identify horizons on seismic lines. Column 7, late Oligocene to early Miocene units interpreted from Luyendyk et al., 2001. Column 8, interpretation of late Oligocene to early Miocene sequence from Brancolini et al., 1995. Column 9, seismic facies interpreted within RSS-2 from De Santis et al., 1995. Column 10, late Oligocene to early Miocene sequences interpreted by Bartek et al., 1992.
2.2. Methods
The data sets used for this study consist of intermediate- and low-resolution multichannel
seismic reflection data (MCS), and higher resolution single channel seismic reflection data (SCS)
from Eastern Basin, Ross Sea, Antarctica (Table 2.1) and facies, lithologic and biostratigraphic
descriptions and synthetic seismograms from DSDP Leg 28 drill Site 270 (Hayes and Frakes,
1975; Balshaw-Biddle, 1981; and Leckie and Webb, 1986; ANTOSTRAT, 1995).
This study focuses on late Oligocene through early Miocene strata, Ross Sea Sequence –
2 (RSS-2), as defined by ANTOSTRAT (1995), (referred to here as RSS-2-EB) based on
correlation to DSDP Leg 28, Site 270 (Figure 2.3). I compare multi-resolution seismic reflection
data sets collected in Eastern Basin over nearly four decades and use spectral analysis techniques
to enhance the resolution of portions of the seismic data. This study builds upon previous seismic
stratigraphic interpretations (Hinz and Block, 1984; Cooper et al., 1991; Anderson and Bartek,
1992; Busetti and Zayatz, 1994; Brancolini et al., 1995; De Santis et al., 1995; Luyendyk et al.,
2001; Sorlien et al., 2007b). I develop a detailed stratigraphic model for RSS-2-EB by
interpreting higher frequency horizons and correlating them to Site 270, which penetrates the
23
Figure 2.5.Examples of seismic features identified within RSS-2-EB (see Figure 2.1 for locations). a) U-shaped channel, b) V-shaped channels, c) trough shaped unconformities, d) planar unconformities, e) long wavelength rugose texture, f) short wavelength rugose texture, g) tall, narrow mounds, h) broad mounds.
5 km
VE = 23
5 km VE = 28 U-Shaped Channels
5 km VE = 22
V-Shaped Channel
a
5 km
VE = 25 15 km
VE = 28
5 km VE = 25
10 km VE = 25
1 km VE = 7
b
d
f
e
g
h
Mounds Mound Planar Unconformity Trough Unconformity Rugose Texture Rugose Texture PD90-22 RSU5.05-EB PD90-22 RSU 6-EBc
NBP0301-27 BGR006NBP0301-120 PD90-23
NBP0301-27 IFP-202
24
features within RSS-2 which I interpret as glaciogenic features associated with each horizon
including: glacial erosion surfaces, glacial mounds (e.g. moraines and grounding zone wedges)
and channels and placed them within a context of subglacial, ice-proximal or ice-distal
paleoenvironments.
I interpret stratal stacking patterns from seismic profiles using the Posamentier and Allen
(1999) nomenclature and identified multiple third-order sequences separated by
time-transgressive sequence boundaries created during the fall of relative sea level. Facies models
developed from drill cores from the Ross Sea were used to calibrate the interpreted systems
tracts to allow predictions regarding lateral and vertical succession of facies within Eastern Basin
where direct sedimentological evidence is absent.
Seismic velocities of 2100 m/s at the sea floor was used for RSS-2-EB strata (Davey et
al., 1982) and a 1D linear velocity gradient:
! = #$.&' − 1 ×2100 0.8
2.3. Description of Seismic Features
2.3.1 Erosional Features
Erosional features are identified as seismic surfaces that truncate reflectors below them.
U- and V-shaped channels are present throughout the basin, generally along the flanks of
basement highs and near the modern ice shelf edge. Widths of channels range from 1 – 6 km
with depths ranging from 10 – 50 m (Figure 2.5a, 2.5b). Three types of unconformities are
recognized: broad trough, planar angular and rugose textured unconformities (Figure 2.5c, 2.5d,
2.5e, 2.5f). The dimensions of broad trough and planar unconformities range from several
25
distances (up to 50 km) between in seismic reflection profiles limited our ability to quantify
these feature’s 3D morphologies precisely.
2.3.2 Depositional Features
Mound-shaped depositional features on 2D seismic profiles (possible ridges in 3D) were
recognized by their positive relief and internal seismic character (Figure 2.5g, 2.5h). Dimensions
of identified mounds range from 3 to several 10s of km in width and 30 to 250 m in height. The
internal seismic character of the mounds ranges from internally stratified to chaotic/transparent.
2.3.3 Rugose Textured Features
Rugose textures appear as corrugated seismic reflectors that do not clearly truncate
reflectors below and do not have a distinct internal seismic character. Rugose textured horizons
have wavelengths between 0.25 – 2 km and amplitudes of 10 – 50 m (Figure 2.5e, 2.5f). Rugose
reflectors often appear on multiple closely-spaced seismic profiles, downdip of broad trough and
updip of U- and V-shaped erosional features and mounded depositional features. Rugose
textured unconformities are shallow and extend for 100s of meters laterally (Figure 2.5e, 2.5f).
Rugose reflectors of similar dimensions identified along the modern sea floor of the Ross Sea are
interpreted as ice-contact and/or ice-proximal features (Spagnolo et al., 2014).
2.4. Description of Seismic Sequences and Horizons
This study details the seismic sequence stratigraphy of RSS-2 (after ANTOSTRAT,
1995) in the Eastern Basin (referred to here as RSS-2-EB, Figure 2.4). RSS-2-EB is enveloped
by regional unconformities, RSU6-EB, (~30 Ma) at its base and RSU5-EB (ca. ~20 Ma) above.
26
Figure 2.6.Strike-oriented single channel seismic profile NBP0301-27A (see Figure 2.1 for location). Standard amplitude above and
interpreted profile below. Sequence 6, bounded by horizons RSU6-EB and RSU5.15-EB, is show with interpreted systems tracts:
lowstand systems tract (LST) in purple, overlain by green highstand systems tract (HST) that shows basinward progradation Flat
topped mounds within erosional troughs on RSU5.15-EB are interpreted as moraines (Sorlien et al., 2007. Scour and fill sections are highlighted in grey.
Seafloor Multiple Seafloor RSU5.15-EB Mounds 1.0 1.5 2.0 1.0 1.5 2.0 RSU6-EB 5 km
VE = 13 (at seafloor) NBP0301 - 27
HST LST SB ENE WSW T W T (s) RSU6-EB
Scour & Fill
RSU5.15-EB
27
identified within RSS-2-EB that record fluctuations of RSL within Eastern Basin during the late
Oligocene through early Miocene.
2.4.1 Sequence 6 (RSS-2.6-EB): Roosevelt subbasin
Sequence 6 (RSS-2.6-EB) exists as a local, expanded sequence within the Roosevelt
subbasin and is enveloped by a regionally extensive lower horizon correlated to RSU6-EB, and
an upper horizon correlated to RSU5.15-EB (Figure 2.4). Previous work by Sorlien and others
(2007b) also correlates the section identified in Roosevelt subbasin to lower RSS-2-EB.
RSU6-EB is a regionally extensive, high amplitude, continuous reflector that onlaps basement highs, is
a downlap surface for overlying reflectors and occurs above syn-rift reflectors that fill
extensional basins within Ross Sea. Age constraints for RSU6-EB are poor because it is
uncertain whether it was sampled at DSDP Site 270 (Figure 2.3). RSU6-EB has a putative age of
~30 Ma (ANTOSTRAT, 1995; Levy et al., 2012) based on correlations to a large eustatic sea
level fall at 30 Ma formerly proposed by Haq and others (1987). Upper horizon, RSU5.15-EB,
cannot be definitively correlated to the base of Site 270, therefore, no age for the horizon has
been interpreted. RSU5.15-EB, is an erosional unconformity at the top of sequence 6 onto which
flat-topped mounds (possible ridges in 3D) that have a stratified to chaotic internal seismic
character are deposited (Figure 2.6). Outside of the Roosevelt subbasin, on the flanks of Central
High and the Marie Byrd Land margin, RSU5.15-EB appears as a conformable horizon and
28 PD90-22 Se q u e n c e 1 Unconformity RSU4A
Seafloor Mu ltiple Acoustic Basement Se q u e n c e 2 Sequence 3 Se quence 4 Sequence 5 RSU 6-EB 5.15
5.14 5.13 5.12 5.11
5.10 5.09
5.085.07 5.06 5.05
5.04 5.03 5.02 RSU5-EB Seafloor 1.00 1.25 1.50 1.75 1.00 1.25 1.50 1.75 T W T T (s) 20 km VE = 55X at seafloor
29
30
31
32
Figure 2.10. Time-depth structure map of horizon RSU5.11-EB, a regional unconformity and sequence boundary. Mounds, channels, rugose textures and erosional truncation interpreted from seismic date. Inset a) single channel seismic profile NBP9601L082A
33
Figure 2.11. Fence diagram of seismic profiles PD90-21 and NBP0301-13A3 on the eastern flank of Central High (see Figure 2.1 for location) looking to the southeast. U-shaped channel carved into acoustic basement, below RSU6-EB is highlighted on seismic profile PD90-21. 2-EB horizons RSU6-EB (teal), RSU5.13-EB (red) and RSU5.12-EB (pink) are highlighted with much up upper RSS-2-EB section removed by erosion. Internally stratified, asymmetric mounds are located on horizon RSU6-EB. The intersection of profiles PD90-21 and NBP0301-13A3 reveal that these mounds are not elongated in 3D. These mound features exceed 100 in height and are interpreted as drumlins deposited by piedmont glaciers flowing from a subaerial Central High.
2 km
200 ms PD90-21 NBP0
301-1 3A3
Channel
Seafloor RSU5.12-EB
RSU5.13-EB RSU6
-EB
Mounds
N
34
35
36 2.4.2 Sequence 5 (RSS-2.5-EB)
Sequence 5 is enveloped by lower horizon RSU6-EB and upper horizon RSU5.12-EB
(Figures 2.4, 2.7). RSU6-EB is a regionally extensive, high-amplitude, continuous reflector that
onlaps basement highs and is a downlap surface for overlying reflectors. RSU6-EB is a planar
unconformity that truncates older strata along the eastern flank of Central High (Figures 2.7,
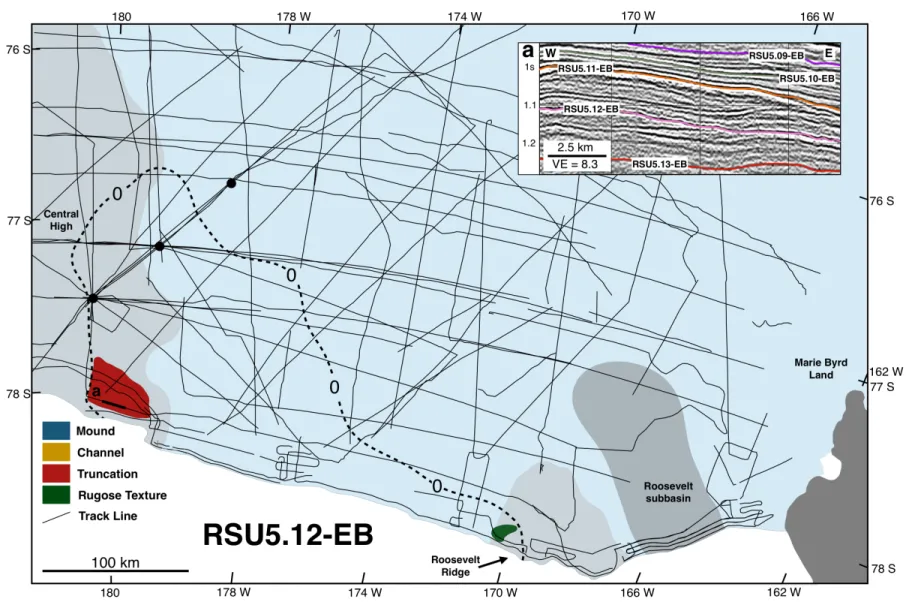
2.8). RSU5.12-EB is a broad, sub-planar erosional unconformity where it is present in the
southwestern sector of Eastern Basin (Figure 2.9). Horizon RSU5.12-EB displays rugose
textured seismic characteristics along the western flank of Roosevelt Ridge and is truncated by
horizon RSU5.11-EB in the eastern sector of Eastern Basin (Figure 2.10). Along RSU6-EB, near
the eastern flank of Central High, internally stratified mounds in 3D, 100 – 130 m high are
identified (Figure 2.11). Whether RSU6-EB drapes preexisting mounds or they are coeval is
37
Figure 2.14. Seismic profile PD90-22 (see Figure 2.1 for location) showing multiple stacked unconformities (black lines) of Sequence 4 (refer to Figure 2.4). The section of stacked unconformities is interpreted to represent a series of high-frequency ice advances and retreats into the Eastern Basin correlated to ~25 Ma and associated with stacked unconformities from the western Ross Sea at drill core CRP (Figure 2.1, inset 2).
1.0 1.2 1.4 T W T T 1.0 1.2 1.4 T W T T RSU6-EBRSU5.15-EB RSU5.14-EB RSU5.13-EB RSU5.12-EB RSU 5.11-EB RSU 5.10-EB RSU
5.09-EB RSU5.08-EB
PD90-22
10 km VE = 13.5 at seafloor
W E
38
Figure 2.15. Feature map of horizon RSU5.06-EB showing the location of Rugose reflectors, channels and truncation. Horizon RSU5.06-EB is a horizon within Sequence 3 highstand systems tract. The features identified along RSU5.06-EB corresponds to interglacial conditions and therefore are not interpreted as glaciogenic in origin.
2.4.3 Sequence 4 (RSS-2.4-EB)
Sequence 4 is bounded by horizons RSU5.12-EB below and RSU5.11-EB above (Figure
2.4). Sequence 4 has limited preservation in the southwestern sector of Eastern Basin, near
Central High with a maximum thickness of <150 m (Figure 2.14). Sequence 4 is comprised of
multiple, stacked high-amplitude cross-cutting and truncating reflectors. These unconformities
are broad, trough shaped and occur along approximately 100km section of southwestern Eastern
Basin, on the flanks of Central High (2.14). General seismic reflection character between stacked
unconformities is low- to moderate-amplitude weakly stratified and reflectors downlap onto
horizon RSU5.12-EB or are truncated by horizon EB (Figure 2.14). Horizon
RSU5.11-EB is a regionally extensive, high-amplitude horizon that is correlated to DSDP Site 270 and has
40
41 2.4.4 Sequence 3 (RSS-2.3-EB)
Sequence 3 contains a thick section of parasequences enveloped by horizon RSU5.11-EB
at its base and horizon RSU5.05-EB above (Figure 2.4). Horizon RSU5.11-EB truncates
reflectors and displays rugose textures, channels and mounds along the Roosevelt Ridge
basement high and the Marie Byrd Land margin (Figure 2.10). Back-stepping clinoforms above
RSU5.10-EB are capped by a regionally extensive, high-amplitude horizon RSU5.09-EB (Figure
2.3). Above horizon RSU5.09-EB clinoforms prograde basinward (Figure 2.3). A large
asymmetric mound capped by RSU5.05-EB that thickens down-dip is present along the eastern
flank of Central High (Figure 2.16, inset a).
2.4.5 Sequence 2 (RSS-2.2-EB)
Sequence 2 is enveloped by horizons RSU5.05-EB and RSU5.03-EB (Figure 2.4).
Numerous channels are observed on RSU5.05-EB within an area of erosional truncation near the
42
Figure 2.17. Structure map of RSU5.03-EB a regional unconformity and sequence boundary. Channel, rugose textures and erosional
truncation interpreted from seismic date. a) Multi-channel seismic profile BGR-002-1 showing horizons: RSU6-EB (teal),
43
Figure 2.18. Strike-oriented Multi-channel seismic profile NBP9601-T06 (see Figure 2.1 for location) showing prograding clinoforms within Sequence 1 highstand systems tract (refer to Figure 2.4). RSU5-EB (amber), RSU5.01-EB (brown), RSU 5.02-EB (blue), RSU, 5.03-EB (crimson), and RSU5.11-EB (orange).
2.4.6 Sequence 1 (RSS-2.1-EB)
Sequence 1 is bounded at its base by horizon RSU5.03-EB and above by RSU5-EB
(Figure 2.4). Sequence 1 thins to the east where reflectors amalgamate and the sequence
subcrops near the margin of Marie Byrd Land. RSU5-EB was recognized as a regionally
extensive reflector by Hinz and Block (1984). Horizon RSU5-EB truncates reflectors along the
western sector of Eastern Basin where it is truncated by an overlying unconformity (Figure 2.18,
inset a). A thick section of northeastward prograding clinoforms is present east of DSDP Site 272
and is capped by RSU5-EB. A younger, planar unconformity, RSU4A, truncates a significant
portion of sequence 1 throughout the Eastern Basin (Figure 2.7).
2.5. Interpretation of Seismic Features and Sequences
2.5.1 Erosional and Depositional Seismic Features
2.5.1.1 Channels
Shallow, U- and V-shaped erosional features with dimensions of 100s of meters wide and
10s of meters deep are recognized as channels. Facies and features associations are used to
10 km VE = 10
1 s
1.25
1.5
1.75
NW NBP9601-T06 SE
44
interpret whether channels are the product of glaciogenic, fluvial, or deep water transport
processes. Glaciogenic channels, channels carved directly by ice or ice-proximal processes (e.g.
sub-ice meltwater erosion), are identified as U-shaped channels (Figure 2.5a) that are associated
with terrestrial or near-shore deposits coeval with glacial maxima, relative sea level falls,
sequence boundaries, laterally extensive up-dip truncation and down-dip terminal moraines.
Meltwater channels have similar morphologies and internal facies as fluvial channels but are
associated with submarine rugose textured reflectors. Worldwide, fluvial channels typically
display V-shaped (e.g. Figure 2.5b), leveed and avulsing channel morphologies and are
associated with terrestrial deposits, up-dip tributary networks and down-dip deltaic deposits that
display broad, lobate morphologies. Deep-water erosional channels associated with turbidites are
U-or V-shaped, typically leveed and avulsing channels that occur on shelf slopes. Turbidites are
often associated with down-dip distributary networks and submarine fan complexes.
2.5.1.2 Troughs
Large, broad erosional troughs (Figure 2.5c), with dimensions from several kilometers to
10s of km wide are interpreted as glaciogenic features that are carved by grounded ice streams or
sheets (Sorlien et al., 2007a). The axes of large troughs observed in sequence RSS-2-EB are
perpendicular to paleo-depositional strike (Figure 2.6). The troughs interpreted within RSS-2-EB
strata have similar dimensions to ice stream troughs have been recognized along the modern sea
floor (Anderson et al., 2014), from Plio-Pleistocene age strata (Bart, 2004), and from Miocene
age strata (Anderson and Bartek, 1992). Wider troughs that extend further north are interpreted
as the product of erosion from thicker ice sheets that could remain grounded well below sea
level. A stack of trough shaped unconformities along the eastern flank of Central High (Figures
45
2.5.1.3 Mounds
Several mounds, in 2D are identified within RSS-2-EB strata. Mounds have dimension of
1-5 km wide and heights exceeding 100 m (Figures 2.5g, 2.5h, 2.10, 2.15). Several mounds in
2D are likely ridges in 3D, and are interpreted as moraines produced by piedmont glaciers or
streaming ice. Several mounds were only imaged on a single seismic profile so their 3D shapes
and dimensions are unknown. Mounds that were imaged on two or more closely spaced profiles
suggest ridges that are consistent with moraines.
The largest mound identified within RSS-2-EB strata occurs along the eastern flank of
Central High, with a maximum width of ~15 km (Figure 2.5g, 2.5h, 2.15). This mound has a
distinct internal seismic character of stratified internal reflectors that are truncated updip and
downlap downdip. This feature is interpreted as a grounding zone wedge and the product of a
significant ice sheet that was grounded below sea level. This feature has dimensions similar to
modern and ancient grounding zone wedges documented from the Antarctic shelf and the Arctic
(Bart and DeSantis, 2012; Dowdeswell and Fugelli, 2012; Batchelor and Dowdeswell, 2015).
2.5.1.4 Rugose Reflectors
Rugose reflectors (Figure 2.5e, 2.5f) are distinct corrugated reflector that are recognized
throughout RSS-2-EB strata. Rugose reflectors are present at the modern seafloor and are
associated with mega-scale lineations, ice-berg furrows and ice-proximal processes (Loth et al.
2007). Rugose reflectors resemble modern, deep-water sediment waves imaged on single
channel seismic profiles on the slope offshore Amundsen Sea (Nitsche et al., 2000); however,
rugose reflectors identified within the Eastern Basin are associated with horizons correlated to
paleo water-depths of 500 m or less (Leckie and Webb, 1985; De Santis et al., 1999). Another
46
product of fluvial small tributary or deep water distributary channels; however, lack of
association of rugose reflectors with large updip channels or downdip fans does not support this
interpretation.
2.5.2 Seismic Sequences and Stratigraphy
RSS-2, as defined by Brancolini and others (1995) (Figure 2.4), has been examined in
detail using all publically available multichannel seismic reflection data and additional single
channel data. I interpreted the seismic datasets using a sequence stratigraphic approach (Vail et
al., 1977) to understand changes of accommodation. Detailed seismic stratigraphic analysis
allowed me to interpret and correlate regional composite sequences which were then grouped
into systems tracts defined by their stacking patterns. A minimum of 6 relative sea level cycles
are recorded in the strata of the Eastern Basin, Ross Sea. A discussion of the newly defined
third-order sequence stratigraphy follows.
2.5.2.1 Sequence 6 – Roosevelt Subbasin
Sequence 6 is locally identified within the Roosevelt subbasin and contains some of the
earliest evidence of Oligocene glaciation along the West Antarctica margin. Along the upper
sequence boundary, RSS5.15-EB, several 2D mound deposits are imaged to the east and are
interpreted as lateral moraines (Figure 2.6). The moraines correspond to a period of decreasing
accommodation that is likely associated with a relative sea level fall and glacial maximum.
Above sequence 6 is a series of cross-cutting broad troughs up to 20 km wide (Figure
2.6) that suggests multiple scour-and-fill cycles and are interpreted as multiple ice advance and
retreats into the Roosevelt subbasin during the late Oligocene to early Miocene (Sorlien et al.,
47
Outside of Roosevelt subbasin, RSU6-EB to RSU5.15-EB exist as a thin (<150 m thick,
Figure 2.7) sequence and is interpreted as the lowstand systems tract of sequence 5 that does not
display evidence of glaciogenic processes. The anomalous expanded section of lower RSS-2-EB
strata within the Roosevelt subbasin has been documented by previous investigators (Luyendyk
et al., 2001; Decesari et al., 2007a; Sorlien et al., 2007a). This anomalously thick section of
lower RSS-2-EB strata may be explained by: 1) the early development of a more gently sloping
shelf within the Roosevelt subbasin while shelf morphology beyond the subbasin was more
steeply dipping, 2) sedimentation rates that kept pace with subsidence within the Roosevelt
subbasin while sedimentation rates were outpaced by subsidence beyond the Roosevelt subbasin,
or 3) a combination of the two.
The morphology of the shelf is an important factor when considering differences in
stratal stacking patterns (O’Grady et al., 2000). When a shelf has a steep slope, sediments are
preferentially transported downslope by sediment gravity flow processes. These deeper deposits
are less well imaged on seismic reflection profiles and interpretations of stratal architecture are
limited. Deep currents impinging upon the margin may redistribute sediments deposited at depth,
thus destroying primary stacking patterns. A subsiding, gently sloping shelf is more likely to
develop and preserve stacking patterns at a sufficiently shallow depth that they may be well
imaged on a seismic reflection profile. Decesari and others (2007b) model a late phase
subsidence history for the Ross Sea at RUS6-EB time that depicts greater subsidence rates in the
western Eastern Basin, near Central High, than in the east. This model suggests that areas around
Marie Byrd Land would have developed a more gently sloping shelf and were more likely to
48
sedimentation rates may have resulted in thicker accumulations of RSS-2.4-EB along Marie
Byrd Land and Roosevelt subbasin than adjacent to Central High and the modern ice shelf edge.
The shelf morphology of the Roosevelt subbasin during the late Oligocene is poorly
understood. Limited seismic data from the Roosevelt subbasin and no seismic profiles oriented
along dip prevents investigators from identifying the position of the shelf break during sequence
6 time. The processes responsible for a thick lower RSS-2 sequence within the Roosevelt
remains equivocal and these hypotheses require additional data to be properly tested.
2.5.2.2 Sequence 5
Sequence 5 (Figure 2.4) is the first regionally extensive sequence deposited above
horizon RSU6-EB. The lower sequence boundary, RSU6-EB is interpreted to have formed
during a relative sea level fall and is generally conformable throughout the Eastern Basin. Small
portions of Central High, near Site 270, may have been subaerialy exposed or shallow submarine
during RSU6-EB time (Decesari et al., 2007a; Wilson and Luyendyk, 2009; Wilson et al., 2012).
It is unclear if Site 270 sampled RSU6-EB, however 23 m of sedimentary breccia and a 3.5 m
layer of well-developed regolith above metamorphic basement was recovered that suggest the
area was subaerial before marine sedimentation commenced (Hayes and Frakes, 1975).
U-shaped channels are cut into acoustic basement (Figure 2.11) are interpreted as
glaciogenic in origin (De Santis et al., 1995, Brazell 2017). A series of mounds, in 3D, occur
along RSU6-EB on the southeastern flank of Central High (Figures 2.8, 2.11) and are interpreted
as glaciogenic, though they have similar morphologies to volcanic vent complexes or bioherms.
The mounds display weak internal stratification, have slightly asymmetric morphologies similar
to drumlins and multiple mounds are clustered (Figure 2.8). Erosional truncation occurs along
49
moraine-like features suggest an ice sheet, rather than small piedmont glaciers that would likely
have carved U-shaped channels during RSU6-EB time. De Santis and others (1995) proposed
small ice caps along subaerialy exposed portions of Central High during Oligocene time;
however, this study supports the interpretations made by Anderson and Bartek (1992) that
suggests a thin ice sheet and localized areas of streaming ice.
Several lines of evidence suggests a glaciated Eastern Basin margin during the
Oligocene. Below horizon RSU-6-EB, U-shaped troughs have been recognized and interpreted
as glacial features (De Santis et al., 1995). The presence of glacial features prior to RSU6-EB
time suggests that ice was present along the margin of Eastern Basin and likely persisted after
RSU6-EB. Geomorphic characteristics of piedmont glaciers that may be imaged on seismic
include: U-shaped troughs ≤5 km, well-formed lateral moraines, end moraine with associated
stratified lacustrine deposits and lobed outwash terraces (Benn et al., 2003). These features are
not imaged on horizon RSU6-EB, instead the association of broad updip truncation and downdip
mounds and channels supports a glaciated environment with a thin ice sheet and narrow regions
of streaming ice, rather than localized piedmont glaciers.
U-shaped leveed channels are recognized within sequence 5 highstand systems tract
(Figure 2.13) and are interpreted to be related to sediment bypass along the shelf during
decreasing accommodation. Rugose reflectors along the margin of Marie Byrd Land are not
associated with up-dip truncation or down-dip mounds and are, therefore, not interpreted to be
the product of ice-proximal processes. Sequence 5 highstand systems tract reflectors are
50
2.5.2.3 Sequence 4
Sequence 4 is poorly preserved and is removed in the eastern sector of Eastern Basin.
Internally, sequence 4 is comprised of a series of stacked, broad trough unconformities that
cross-cut one another (Figure 2.14). The broad, trough unconformities within sequence 4 are
interpreted as the product of ice advances and scouring, ice retreat and backfilling following by
re-advancing ice that cannibalized previously deposited strata. Multiple cross-cutting
unconformities are identified within sequence 4 (Figure 2.14). This suggests that multiple ice
expansion and contractions, with possible frequencies of 100 kyr or more were occurring during
this time. Levy and others (2012) estimate the age of horizon RSU5.11-EB to be ca. 25 Ma. Drill
core from CRP2/2A in the Victoria Land Basin, western Ross Sea, contain late Oligocene
deposits that record high frequency unconformities correlated to ~25 Ma and associated with an
expanded East Antarctic Ice Sheet (Naish et al., 2001). Additionally, oxygen isotope data and
eustacy calculations display high frequency variability during this time (Kominz and Pekar,
2001; Pekar et al., 2002; Miller et al., 2005) This correlation suggests a major expansion of both
the East and West Antarctic Ice Sheets during the late Oligocene.
2.5.2.4 Sequence 3
Sequence 3’s basal sequence boundary, RSU5.11-EB, is an extensive erosional surface
along the eastern flank of Central High and the margin of Marie Byrd Land (Figure 2.10).
Rugose reflectors and channels are present up-dip of mounds or ridges along Roosevelt Ridge
and the Marie Byrd Land margin. These features and facies associations suggest a glaciogenic
origin and that the WAIS advanced onto the margin.
Above sequence 3 lowstand, reflectors of the transgressive systems tract are correlated
51
increase from <50 m to possibly 500 m (Leckie and Webb, 1986) suggesting a high magnitude
relative sea level rise with most of this related to subsidence. Highstand systems tract reflectors
have an aggradational to sigmoid-oblique stacking pattern. Upper sequence boundary,
RSU5.05-EB, truncates sequence 3 highstand systems tract reflectors along the modern ice shelf edge
where it is recognized as a laterally extensive unconformity (Figures 2.3, 2.16).
2.5.2.5 Sequence 2
Sequence 2’s lower sequence boundary is a regionally significant unconformity (Figure
2.16 that truncates upper sequence 3 and contains numerous channels near the modern ice shelf
edge (Figure 2.16). Truncation, rugose reflectors are recognized along Roosevelt Ridge with
mounded (moraine?) features located down-dip (Figure 2.16) are interpreted as glaciogenic or
ice-proximal features and facies.
The unique spatial positions of features and facies on horizon RSU5.05-EB are
interpreted as the product of a a greatly expanded WAIS. Paleo-water depth indicators at DSDP
Site 270 for the strata below sequence 2 suggest depths greater than 300 m. A large mound is
present on the southeastern flank of Central High (Figure 2.16) that has a similar morphology
and internal seismic character as grounding zone wedges identified in the Ross Sea and
high-latitude glaciated margins (Bart and DeSantis et al., 2012; Batchelor and Dowdeswell, 2015).
This mound further supports the interpretation that the Eastern Basin margin may have been
impinged upon by a well-developed WAIS.
The presence of shelf margin wedge suggests a relative sea level lowstand that did not
52
53
tract exists below a largely prograding highstand systems tract. Few seismic features are
recognized within sequence 2 and the reflectors appear conformable. Upper sequence 2 is
truncated by sequence boundary RSU5.03-EB, a regionally extensive unconformity (Figure
2.17).
2.5.2.6 Sequence 1
Unlike previous sequence boundaries, no evidence of rugose reflectors, channels or
mounds are identified along RSU5.03-EB (Figure 2.17). A lack of glaciogenic features and
facies associates suggests the Eastern Basin was an open marine environment during sequence 1
deposition and may be associated with early Miocene warming and glacial minimum.
2.5.3 Late Oligocene to early Miocene Glacial History of Eastern Basin
The glacial history of Eastern Basin in the Ross Sea during the late Oligocene to early
Miocene has been developed from the stratal stacking patterns identified in the seismic record
and from associated features, facies, and direct sedimentologic evidence, where available. Stratal
stacking patterns are controlled by the morphology of the shelf, fluctuations in relative sea level,
tectonic subsidence and sedimentation rates.
RSU6-EB is an unconformity created during a relative sea level fall correlated to a
eustatic sea level fall ~30 Ma (Levy et al., 2012). Sediments from the bottom of Site 270 contain
regolith and paleosols (Hayes and Frakes, 1975) suggesting subaerial exposure. Additionally,
erosional truncation is noted along Central High downdip of Site 270 and off the modern coast of
Marie Byrd Land. Mound-like features along RSU6-EB in the southwest sector of Eastern Basin
(Figures 2.8, 2.11) are interpreted as moraines over 100m high at the base of outlet glaciers