The handle http://hdl.handle.net/1887/20590 holds various files of this Leiden University dissertation.
Author: Versluis, Maarten Jan
Technic
al de
velopmen
ts f
or clinic
al MR applic
ations
at 7
T
M.
J. V
er
sluis
Uitnodiging
voor het bijwonen van de openbareverdediging van het proefschrift:
technical developments for
clinical MR applications at 7 T
van
Maarten Versluis
Woensdag 6 maart 2013 om 15 uur in het Academiegebouw Rapenburg 73 te Leiden
Vanaf 16 uur bent u uitgenodigd
voor de receptie in Grand
Café De Koets, Doelensteeg 8 op loopafstand van het
academiegebouw.
Wilt u via onderstaand e-mail adres de paranimfen laten weten of u bij de
verdediging aanwezig kunt zijn?
Paranimfen: Lieven Andringa
Rob Nabuurs
Er is zeer beperkte gelegenheid tot parkeren in de omgeving van het
Academiegebouw.
Technical developments
for clinical MR applications
at 7 T
behorende bij het proefschrift
technical developmentS for clinical mr applicationS at 7 t
1. Resonance frequency fluctuations are a major cause of image artifacts in Alzheimer’s Disease patients at high field (this thesis)
2. Modern RF coils with a high channel count can be used for accurate, real-time measurement of resonance frequency fluctuations using a navigator echo approach. (this thesis)
3. The increased phase shift between gray and white matter is a promising marker to reveal underlying AD pathology. (this thesis)
4. The frequent use of local Tx/Rx coils at 7 Tesla requires a specific RF power calibration method. (this thesis)
5. The effect of field strength on clinical diagnosis is difficult to quantify (J. Duyn, Neuroimage. 2012 Aug 15;62(2):1241-8)
6. Successful new techniques need to have the ability to provide unique contrast without sacrificing routine imaging contrast. (D. Sodickson)
7. A clinical role for tailored 7T cardiac MR applications is at the moment merely a vision. (T. Niendorf, Eur Radiol. 2010 Dec;20(12):2806-16)
8. High-field susceptibility-based MRI contrast can be used to reveal the local cortical architecture based on iron distribution. (M. Fukunaga, Proc Natl Acad Sci U S A. 2010 Feb 23;107(8):3834-9)
9. De ontwikkeling van 7 Tesla MRI is eerder technologie gedreven dan toepassings gedreven.
10. Alles is mogelijk. Wat mogelijk is, gebeurt. Alles gebeurt. (H. Mulisch)
Technical developments for clinical
MR applications at 7 T
Medical Center, The Netherlands.
Part of this research was performed within the framework of CTMM, the Center for Translational Molecular Medicine (www.ctmm.nl), project LeARN (grant 02N-101).
Technical developments for clinical
MR applications at 7 T
Proefschrift
ter verkrijging van
de graad van Doctor aan de Universiteit Leiden op gezag van de Rector Magnificus prof. mr. C.J.J.M. Stolker,
volgens besluit van het College voor Promoties te verdedigen op woensdag 6 maart 2013
klokke 15 uur
door
Maarten Jan Versluis
geboren te Bussum
Promotores:
Prof. Dr. A.G. Webb
Prof. Dr. M.A. van Buchem
Co-Promotor:
Dr. ir. M.J.P. van Osch
overige leden:
Prof. Dr. H.J. Lamb
Table of Contents
1. Introduction and Outline 9
Part one: Technical developments - Body applications
2. Simple RF design for human functional and morphological cardiac
imaging at 7 Tesla 19
3. Right Coronary MR Angiography at 7 Tesla: A Direct Quantitative and Qualitative Comparison with 3 Tesla in Young Healthy Volunteers 33
4. Improved Signal-to-Noise in Proton Spectroscopy of the Human calf Muscle at 7 Tesla Using Localized B1 Calibration 47
Part two: Technical developments - High resolution brain imaging
5. Origin and reduction of motion and f0 artifacts in high resolution T2*
-weighted magnetic resonance imaging: application in Alzheimer’s disease patients 61
6. Retrospective image correction in the presence of non linear temporal magnetic field changes using multichannel navigator echoes 79
7. Fast high resolution whole brain T2*-weighted imaging using echo
planar imaging at 7 Tesla 101
Part three: Clinical application of 7 Tesla MRI
8. Cortical phase changes in Alzheimer’s disease at 7 Tesla MRI: a novel
imaging marker 117
9. High-field imaging of neurodegenerative diseases 135
10. Subject tolerance of 7 Tesla MRI examinations 157 General discussion 167
Summary and Conclusions 177
Nederlandse Samenvatting en Conclusies 185
| 11
introduCtion
introduction
Since the introduction of magnetic resonance imaging (MRI) in hospitals great efforts have been made in enhancing this technique and enabling its use in clinical practice. Constant improvements in field strength, gradients, coils and pulse-sequences have led to a steady increase in the number of MRI exams. To date more than 150 million examinations have been performed worldwide. Only recently, the conventional field strength for most exams was 1.5 Tesla, and 3 Tesla MRI scanners were used almost exclusively in large academic hospitals. Currently, the standard for many applications is shifting towards 3 Tesla due to improved image quality and information content. The recent introduction of whole body 7 Tesla MRI scanners has created a new research field, which requires new technical developments to benefit from its potential. At the end of 2012 approximately 35 of these systems were in operation, exclusively in research locations and academic hospitals. The work presented in this thesis describes a number of technical developments to enable the application of 7 Tesla MRI in a clinical (research) setting. A higher magnetic field strength leads to an increased magnetization of spins, which in turn results in higher signal-to-noise ratio (SNR) that can be used for more detailed imaging, i.e. higher spatial resolution, shorter scanning times or increased (quantitative) information content. In addition, most contrast mechanisms are also dependent on field strength, leading to visualization of structures not visible at lower field strengths (1–5).
However on the downside, the technical complexity scales with field streng-th and not all previously developed techniques at lower field strengstreng-ths can be translated easily to 7 Tesla. The increased magnetic field inhomogeneity, increased radiofrequency (RF) field (B1) inhomogeneity due to shorter RF wavelengths and more easily reached temperature specific absorption rate (SAR) limits lead to important hardware and sequence challenges. It is cru-cial for the clinical acceptance and added value of 7 Tesla MRI to find soluti-ons for these problems and to define the areas in which 7 Tesla MRI can help to improve diagnosis.
of the human body lead to pronounced B1 inhomogeneities and the large air cavities create strong B0 inhomogeneities. However, with appropriate modi-fication there are areas that could benefit. In imaging of the coronary arter-ies the increased SNR and improved background suppression due to longer longitudinal relaxation values (T1) could allow for a higher spatial resolution to be able to assess branching vessels. Initial results have shown the feasi-bility of cardiac imaging (11, 12). Another technique, which is expected to benefit is magnetic resonance spectroscopy (MRS), both in the brain as well as in other anatomies. The higher precession frequency results in a greater frequency difference (chemical shift) between different metabolites and al-lows for the quantification of more metabolites with higher accuracy (13, 14). The quality of an MR spectrum relies strongly on a homogeneous B0 and
B1 field, which are more difficult to achieve at a 7 Tesla than at lower field strengths. Therefore the full potential of MRS can only be obtained with suit-able modifications.
In this thesis techniques for different anatomies of the human body were de-veloped: brain, cardiac and leg muscle. This thesis is divided into three parts: part one deals with technical solutions for body applications, in particular to minimize the influence of increased B1-inhomogeneity. Part two describes developments to improve high resolution brain imaging and the last part provides clinical applications of 7 Tesla MRI and describes how examinations are perceived by healthy subjects.
The first part, consisting of chapter 2, 3 and 4 is concerned with designing
| 13
introduCtion
to ensure sufficient coverage to image the entire heart, while avoiding tissue induced signal voids due to destructive RF field interference. The third chap-ter uses this coil to visualize the lumen of the right coronary archap-tery in human volunteers. The small size of the coronary arteries requires high resolution imaging and therefore results in long scanning times. A higher magnetic field strength could prove beneficial for faster or more detailed visualization of the coronary arteries and the branching vessels in particular. In this chapter a comparison is made with 3 Tesla, and improved contrast and vessel sharp-ness were found at 7 Tesla compared to a similar protocol at 3 Tesla. In the fourth chapter a calibration sequence is introduced that measures locally the B1-field. Before each MR experiment the system needs to be calibrated to establish a relation between the amount of power needed from the RF amplifier and the resulting B1-field. This relation varies depending on sub-ject, imaging location and RF coil. Conventionally a rapid MRI sequence is used that measures the average B1-field over a large region. This method is valid when the B1 can be considered constant within this region, which is the case at lower field strengths and when using a RF body coil for exci-tation. At 7 Tesla and especially when using local RF coils this no longer the case. Therefore, an extension of the conventional calibration was designed to specifically measure the B1-field in a small region-of-interest, which better represents the true underlying inhomogeneous B1-field. When this area of interest is small enough, such as in preparation of a single voxel MRS expe-riment the B1-field can be approximated as homogeneous. Using a volume selective RF calibration it was possible to correctly estimate the local flip angle. Subsequently, MR spectra obtained with these RF settings resulted in higher signal-to-noise ratios.
The second part, consisting of chapter 5, 6 and 7 deals with technical deve-lopments aimed at high resolution brain imaging. One of the most striking examples of changed and increased contrast at 7 Tesla is provided by T2*
-weighted images of the brain. This contrast is generated by a gradient echo sequence with a sufficiently long echo time and is sensitive to magnetic field inhomogeneities. Because the MR signal is a complex signal, both phase and magnitude images are obtained, which contain different information. The magnitude images reflect the T2*-value of the tissue, while the phase images
are directly related to the underlying magnetic field. The fifth chapter des-cribes the application of a T2*-weighted sequence in AD patients, because it
inhomogen-eities caused by e.g. air cavities, respiration and body movements. This pro-blem is greater at high magnetic field strengths, because the amplitude of the inhomogeneities scales linearly with the magnetic field strength. Where-as static field inhomogeneities result in artifacts close to the field disturban-ce, dynamic magnetic field fluctuations result in an overall degradation of the image quality. To obtain reliable image quality in AD patients a sequence modification had to be made to dynamically measure the magnetic field du-ring image acquisition, termed a navigator echo. Retrospectively this infor-mation can be used to remove the effect of the unwanted magnetic field inhomogeneities from the data to obtain high quality data. The sixth chapter introduces an extension of this technique by including a measurement of the spatial variation within a slice by using multiple coil elements and the corresponding sensitivity profiles, termed sensitivity encoded (SENSE) navi-gators. The corresponding image quality of corrupted scans was proven to be substantially improved using the extended technique. Chapter 7 describes the implementation of a very efficient sequence to obtain whole brain high resolution T2*-weighted images using echo planar imaging (EPI). EPI is not
frequently used for high resolution imaging, mainly due to image distortions and signal voids. The sequence described in this chapter limits the amount of distortions, while obtaining a significant gain in speed to allow for whole brain acquisitions within reasonable scanning times. This is important for clinical use and it also reduces the chance that images are corrupted by mo-tion.
Finally the third part, consisting of chapter 8, 9 and 10 demonstrates the ap -plication of 7 Tesla in clinical studies. Chapter 8 describes a study performed in patients with AD using a high resolution T2*-weighted sequence, which
was corrected for dynamic magnetic field fluctuations (see chapter 5). One of the hallmarks of the disease is the deposition of the protein Amyloid-b lo -cally in the cortex, co-localized with iron. By using the phase of the complex MR signal a measure for the susceptibility difference between neighboring tissues can be obtained. This measure is expected to change depending on
the amount of iron present. The chapter shows that phase measurements
| 15
introduCtion
In chapter 10 the results of a short survey that was conducted with the first 101 healthy volunteers participating in 7 Tesla MRI studies are presented. How well a 7 Tesla MRI examination is perceived is of great importance for the patient acceptance of 7 Tesla MRI. Although some side effects were men-tioned, mostly nausea and scanner noise, the large majority of the subjects felt comfortable during the examination.
references
1. Duyn JH, van Gelderen P, Li T-Q, de Zwart JA, Koretsky AP, Fukunaga M. High-field MRI of brain cortical substructure based on signal phase. Proceedings of the Na-tional Academy of Sciences 2007 ;104:11796–11801.
2. Kang C-K, Park C-W, Han J-Y, Kim S-H, Park C-A, Kim K-N, Hong S-M, Kim Y-B, Lee KH, Cho Z-H. Imaging and analysis of lenticulostriate arteries using 7.0-Tesla magnetic resonance angiography. Magnetic Resonance in Medicine 2009 ;61:136–144. 3. Fukunaga M, Li T-Q, van Gelderen P, de Zwart JA, Shmueli K, Yao B, Lee J, Maric D,
Aronova MA, Zhang G, Leapman RD, Schenck JF, Merkle H, Duyn JH. Layer-specific variation of iron content in cerebral cortex as a source of MRI contrast. Proceedings of the National Academy of Sciences 2010 ;107:3834 –3839.
4. Zwanenburg JJM, Hendrikse J, Luijten PR. Generalized multiple-layer appearance of the cerebral cortex with 3D FLAIR 7.0-T MR imaging. Radiology 2012 ;262:995–
1001.
5. Tallantyre EC, Morgan PS, Dixon JE, Al-Radaideh A, Brookes MJ, Morris PG, Evange-lou N. 3 Tesla and 7 Tesla MRI of multiple sclerosis cortical lesions. J Magn Reson Imaging 2010 ;32:971–977.
6. Kollia K, Maderwald S, Putzki N, Schlamann M, Theysohn JM, Kraff O, Ladd ME, Forsting M, Wanke I. First Clinical Study on Ultra-High-Field MR Imaging in Patients with Multiple Sclerosis: Comparison of 1.5T and 7T. AJNR Am J Neuroradiol 2009 ;30:699–702.
7. Conijn MMA, Geerlings MI, Biessels G-J, Takahara T, Witkamp TD, Zwanenburg JJM, Luijten PR, Hendrikse J. Cerebral Microbleeds on MR Imaging: Comparison between 1.5 and 7T. AJNR Am J Neuroradiol 2011 ;32:1043–1049.
8. Greenberg SM, Vernooij MW, Cordonnier C, Viswanathan A, Al-Shahi Salman R, Warach S, Launer LJ, Van Buchem MA, Breteler MM. Cerebral microbleeds: a guide to detection and interpretation. The Lancet Neurology 2009 ;8:165–174.
9. Liem MK, van der Grond J, Versluis MJ, Haan J, Webb AG, Ferrari MD, van Buchem MA, Lesnik Oberstein SAJ. Lenticulostriate Arterial Lumina Are Normal in Cerebral Autosomal-Dominant Arteriopathy With Subcortical Infarcts and Leukoencepha-lopathy. Stroke 2010 ;41:2812 –2816.
10. Hendrikse J, Zwanenburg JJ, Visser F, Takahara T, Luijten P. Noninvasive Depiction of the Lenticulostriate Arteries with Time-of-Flight MR Angiography at 7.0 T. Cerebro-vasc Dis 2008 ;26:624–629.
11. Vaughan JT, Snyder CJ, DelaBarre LJ, Bolan PJ, Tian J, Bolinger L, Adriany G, Anders-en P, Strupp J, Ugurbil K. Whole-body imaging at 7T: Preliminary results. Magnetic Resonance in Medicine 2009 ;61:244–248.
12. Elderen SGC van, Versluis MJ, Webb AG, Westenberg JJM, Doornbos J, Smith NB, Roos A de, Stuber M. Initial results on in vivo human coronary MR angiography at 7 T. Magnetic Resonance in Medicine 2009 ;62:1379–1384.
13. Tkác I, Oz G, Adriany G, Uğurbil K, Gruetter R. In vivo 1H NMR spectroscopy of the human brain at high magnetic fields: metabolite quantification at 4T vs. 7T. Magn Reson Med 2009 ;62:868–879.
| 17
I
Technical
2
Simple RF design for human
functional and morphological
cardiac imaging at 7 Tesla.
M.J. Versluis
N. Tsekos
N.B. Smith
A.G. Webb
AbstrAct
| 21
CardiaC rF Coil design
introduction
The majority of high field MRI studies have focused on the brain, with deve-lopments such as transmit arrays(1), contrast optimization (2) and RF pulse design for increased B1 homogeneity (3) forming a few of the areas of active
technical research. Musculoskeletal imaging at 7 T has also seen a recent
surge in activity (4–6). Abdominal imaging is acknowledged to be the most challenging area for high field MRI due to the large dimensions of the torso. The fact that these dimensions are now significantly greater than the wave-length of the electromagnetic (EM) radiation in tissue result in sample indu-ced inhomogeneities in the transmitted and received B1 fields. The complex wave behavior can also cause electric field “hot-spots”, resulting in raised local heating. Similar effects in the field of electromagnetic hyperthermia have been known for many decades, as has the solution of using transmit arrays with different magnitudes and phases applied to each element of the array (7, 8). In MRI terms, this process has been termed “B1-shimming” (9), in which the spatial distributions of the magnetic component of the EM field is the major focus of the optimization strategy.
Only recently has it been shown that whole-body imaging is feasible at 7 Tesla and above (10). The authors showed results from both an actively de-tunable TEM resonator combined with multi-channel stripline detector, and a full transmit array (10). Specific results have also been shown for the heart using this type of RF hardware (11). This approach can be considered as the optimum engineering solution, but does require extensive hardware design and construction, and a very high level of technical skill to implement succes-sfully. The purpose of our current study was to determine whether a much more simple approach could be used to acquire both morphological and functional cardiac images of clinical utility at 7 T.
MR spectroscopy is also an area that should profit considerably from the hi-gher field. Based upon these observations, the potential of cardiac imaging at 7 T appears very high.
In this paper we show that a simple RF coil configuration can be used to ac-quire high quality cardiac images at 7 T. The geometry of a quadrature trans-mit/receive surface coil was optimized to achieve coverage across the entire heart, enabling acquisition of functional cine images in both four-chamber and two-chamber cross-sections, as well as morphological images of the right coronary artery (RCA).
MaTeRialS and MeThodS
All experiments were performed using a Philips Achieva 7 T whole body sy-stem. The system has a single proton RF transmit channel, with two quadra-ture ports available on the RF interface box, through which custom-built coils can be connected via simple type-N connectors. The maximum power from the RF amplifier is 4 kW, with approximately a 50% loss through ~20 meters of cabling between the amplifier and coil interface: the maximum available power for each quadrature channel is therefore ~1 kW. All experiments were approved by the Commissie Medische Ethiek at the Leiden University
Medi-cal Center.
RF coil geometry.
In addition to improving the S/N, quadrature coils help to alleviate the B1 inhomogeneities encountered at high field (13). In this study, the different quadrature coil configurations tested included overlapped circular and rect-angular loops, rectrect-angular loops with central common capacitors (14), and loop/butterfly pairs (15): this list is certainly not exhaustive, but represents the most commonly used configurations. For a given size, the performance of each coil was assessed in terms of B1 homogeneity and S/N. Any coil ar-rangement that produced a significant dark “banding” within the image was discarded, irrespective of the S/N. Empirically, we observed that the opti-mum arrangement was the loop/butterfly pair. As described by Kumar and Bottomley (16), for circular loops the geometry that produces the maximum intrinsic S/N (excluding system and conductive losses in the detector) at a depth d is given at low frequencies by r0 = d/√5 and r8=0.6d, where r0 is the
| 23
CardiaC rF Coil design
“liftoff” phenomenon described by Suits et al. (17). These numbers give
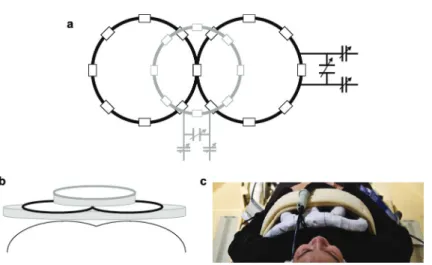
val-ues of 10.8 cm for the diameter of the single loop and 13.2 cm for the diam -eter of each loop of the butterfly coil. Upon testing, it was found that these dimensions did not give sufficient penetration for the posterior part of the heart to be seen with sufficient S/N, and so the dimensions were increased successively until the heart could be fully visualized. The values determined empirically were 15 cm diameter for the single loop and 18 cm diameter for each loop of the butterfly coil. The RF coils were segmented into conduc-tor lengths of 6 cm, corresponding to ~λ/16 at 298 MHz, using 3.9 pF non-magnetic capacitors (ATC, Series B, Huntington Station, NY). Three variable capacitors (1-40 pF, Johansson, Camarillo, CA) were used for fine tuning and impedance matching in a balanced configuration. A lattice balun was used to improve the balance of the coil. Finally, a 1 cm diameter gap, filled with foam, was used between the coil and patient to avoid very heavy sample losses (17). Figures 1(a), (b) and (c) show schematics and a photograph of the coil geometry and placement on the subject.
Figure 1. Schematic of RF coils
(a) The single loop (gray lines)/butterfly coil (black lines) configuration. Capacitors are de-noted by the small boxes. The impedance matching networks are shown for each coil. (b) Physical placement of the coils on the subject’s chest. The shaded regions represent open-core foam of thickness 1 cm. (c) Photograph of the coil assembly placed on top of the volun-teer, and interfaced to the quadrature transmit/receive box of the Philips 7 tesla.
Vector electrocardiogram (vEKG).
A four-channel commercial vector ECG (VECG) module was used to trigger from the R-wave. Despite the well-known magneto-hydraulic effect, EKG’s were obtained in the vast majority of cases without the need for electrode repositioning, as has also been reported by Snyder et al (11).
Navigator gating.
Navigator echo gating was used for imaging the RCA using a “pencil-beam” navigator. Conventional navigator gating has the pencil beam centered on the right hemi diaphragm, at the lung/liver interface in a head/foot direction. Since coverage was limited in the head/foot direction using the surface coil setup, we adapted the pencil beam to be situated at the heart/lung inter-face, but maintaining the head/foot direction of the navigator. This approach was based on previous experience of coronary artery imaging at 7 T (18), and proved to be highly reproducible despite the relatively small surface area perpendicular to the navigator beam, as compared to the conventional con-figuration.
Cine imaging.
| 25
CardiaC rF Coil design
RF spoiling and crusher gradients to eliminate transverse magnetization. A TURBOFLASH gradient echo sequence was used for prescribing the short axis views planes for cine imaging. Multislice cine scans were acquired in multiple breath-holds (acquiring one or two slices per breath-hold).with the following parameters: TR / TE =4 ms / 2.4 ms, tip angle=20°, voxel size = 1.3 x 1.4 x 8
mm3, 12-14 slices. VECG triggering was used retrospectively to reconstruct
33 heart phases. High resolution cine images were acquired for a single slice in a breath hold of ~20 s with the following parameters: TR / TE = 5.4 / 3.4 ms, tip angle = 20°, voxel size = 0.65 x 0.7 x 8 mm3.
Coronary artery imaging.
The procedure for acquisition of the coronary artery geometry is described in detail elsewhere (18). To summarize, the basic steps are to acquire scout scans for the visual identification of the time period (Td) of minimal coronary motion. The scan plane is then localized parallel to the right coronary artery (RCA). Free-breathing 3D coronary MRA (segmented k-space gradient-echo imaging, TR=4 ms, TE=1.5 ms, RF excitation angle=15°, field-of-view=320x291
mm2, scan matrix=392x373, 15 slices, slice thickness=2 mm, acquisition
win-dow ~ 100 ms , scan time ~ 5 min) was performed using prospective navigator gating with the 2D selective navigator localized at the heart-lung interface. Image data were collected in mid-diastole at the predetermined time Td. An adiabatic spectrally selective inversion recovery module with inversion time (TI) = 305ms was used for fat suppression to enhance the endogenous con-trast between the coronary blood-pool and epicardial fat.
Estimation of B1+ for SAR calculations.
The B1+ field was estimated using an interleaved dual repetition FLASH
se-quence which allows a direct calculation of the tip angle distribution (19). The following parameters were used: TR1 / TR2 / TE = 15 / 75 / 1.0 ms, tip an-gle = 40°, voxel size = 2.3 x 4.6 x 15 mm3, 15 signal averages, total scan
dura-tion was 3 minutes. Images were acquired in the transverse plane for measu-rements at the chest surface and also at the center of the heart. Fifteen signal averages were acquired to reduce the effects of heart motion on the estimated B1+ map. It should be noted that the results obtained are only
results
Coil performance.
Figure 2 shows images acquired with three different RF coil configurations using a low flip angle, low resolution TURBOFLASH sequence to assess the B1 profile of each configuration. Figure 2a uses a single loop coil, and displays minor non-uniformity in the image, as predicted by a number of previous studies. Figure 2b shows the results of using the loop/butterfly combina-tion driven in quadrature, with not only the expected increase in penetracombina-tion depth, but also an improvement in the B1 uniformity. The improvement in B1 may also be indirectly appreciated considering the increased CNR between the septal wall and the two ventricles, the improved B1 results to a higher
effective flip angle. It should be noted that the symmetric sensitivity profile of the quadrature coil arises from the combination of two asymmetric fields, the B1+ transmit field and the B
1- receive field, as described previously by
Wang et al.(21). Figure 2c is illustrative, in the sense that the two coils are driven in an anti-quadrature configuration, and gives a good indication of areas in which the B1 fields of the two coils are orthogonal.
Cine-scans.
Individual frames of a cine-sequence at a “conventional” spatial resolution of 1.3 x 1.4 x 8 mm3 are shown in Figures 3 and 4 for the short-axis and
four-chamber configurations, respectively. There is excellent blood/myocardium contrast and no areas of B1 inhomogeneity beyond those which are associ-ated with the intrinsic drop-off of B1 amplitude from a surface coil. The SNR of the myocardium was measured to be between 10 and 25:1depending on the particular area of the myocardium, the SNR of the left ventricle was bet-ween 20 and 40:1. In order to take advantage of the high sensitivity of the 7 T, a high resolution cine scan was run on one volunteer. Images with a spatial resolution of 0.65 x 0.7 x 8 mm3 are shown in Figure 5. Although the SNR is
obviously reduced compared to the images in Figures 3 and 4, there is much finer definition of the cardiac muscles.
Coronary artery imaging.
| 27
CardiaC rF Coil design
Figure 2. Scout images of different coil configurations
Coronal (left) and axial (right) low-resolution scout images acquired using different coil con-figurations. (a) Single loop coil, (b) loop/butterfly pair in quadrature configuration, (c) loop/ butterfly pair in an anti-quadrature configuration. SAR estimation.
Despite some initial promising studies using direct MRI temperature measu-rements in vivo, it remains extremely challenging to measure SAR directly, and so most estimations are based on computer simulations. Since blood perfusion is not included in the majority of simulations, one must also re-cognize that such simulations represent “worst-case” scenarios in terms of causing actual tissue heating. We have based our SAR estimations on pre-vious work by Collins and Smith (22), who specifically modeled the SAR for a surface coil adjacent to an anatomically-correct human body model. The regions of highest SAR were found to be at the right medial portion of the pectoral muscle near the superior end of the sternum: the SAR in the heart itself is extremely low. The authors provide appropriate scaling factors for setups different than the particular one which they studied.
Figure 3. Images from a short-axis cine sequence.
Figure 4. Images from a four-chamber cine sequence.
Images are acquired over eight breath-holds with times corresponding to 27 ms intervals. Every fourth images is shown above at times 108, 216, 324 and 432 ms after the R-wave. Data acquisition parameters are described in the main text. The right coronary artery can also be seen (small arrow) perpendicular to the slice dimension.
The initial step was to estimate the B1+ using the same power level as for all
the cine sequences. Using the technique outlined previously our estimated B1+ at the center of the heart was 1.4 µT (using a 0.6 ms duration half
sinc-gauss excitation pulse) and at the surface of the chest was 4.9 µT, compared to values of 1.875 µT and 20 µT from a 3 ms rectangular pulse used in the Collins paper (22). The difference in the ratios of the two values can be at least in part explained by the larger surface coil chosen for the simulations (a 22.9 cm diameter linear surface coil with four-port drive). The results from the Collins and Smith paper were interpolated to values at 298.1 MHz since frequencies of 64, 125, 175, 260 and 345 MHz were used in the original sim-ulations. Using the fact that the SAR is proportional to the time integral of the magnitude of the square of the B1+ field, we can arrive at approximate
SAR values. The SAR in the heart is, as derived from the relative B1+ values,
negligible compared to that at the chest surface. As noted by Collins and Smith, the local SAR is the limiting factor, since the average SAR is up to two orders of magnitude less. The estimated value of local SAR at the chest sur-face is ~0.2 W/kg per 1 g of tissue, which is more than a factor-of-four below those of the Food and Drug Administration (FDA) and International Electro-technical Commission (IEC).
Figure 5. Images from a high resolution short-axis cine sequence.
| 29
CardiaC rF Coil design
Figure 6. Right coronary artery.
Two successive slices through a volunteer showing the right coronary artery.(top). Expan-sion of the images showing more clearly the delineation of the artery (bottom).
conclusions
Although the optimum RF engineering configuration for high field body ima-ging will ultimately consist of separate multi-channel transmit and receive arrays, this setup is not widely available at the current time, and there is a sentiment that it is not possible to perform useful body imaging at 7 tesla and above without such technology. The results shown here illustrate that a well-designed simple coil setup is capable of obtaining both cine-cardiac se-quences for functional applications, as well as structural information related to, for example, dimensions of the coronary artery.
challen-ges in order to obtain high quality spectra. The aim of this current paper is to show that, even with relatively simple RF coil design, both functional and structural information can be obtained, and that many groups can now apply their expertise acquired at lower fields to the challenges of cardiac MR at7 tesla and above.
Acknowledgements
The help of Saskia van Elderen and Albert de Roos at the Leiden University Medical Center, as well as Matthias Stuber at Johns Hopkins, is gratefully
acknowledged.
references
1. Adriany G, Van de Moortele P-F, Ritter J, Moeller S, Auerbach EJ, Akgün C, Snyder CJ, Vaughan T, Uğurbil K. A geometrically adjustable 16-channel transmit/receive transmission line array for improved RF efficiency and parallel imaging perfor-mance at 7 Tesla. Magn Reson Med 2008 ;59:590–597.
2. Duyn JH, van Gelderen P, Li T-Q, de Zwart JA, Koretsky AP, Fukunaga M. High-field MRI of brain cortical substructure based on signal phase. Proc Natl Acad Sci U S A 2007 ;104:11796–801.
3. Zelinski AC, Wald LL, Setsompop K, Alagappan V, Gagoski BA, Goyal VK, Adalsteins-son E. Fast slice-selective radio-frequency excitation pulses for mitigating B+1 inho-mogeneity in the human brain at 7 Tesla. Magn Reson Med 2008 ;59:1355–1364. 4. Krug R, Carballido-Gamio J, Banerjee S, Burghardt AJ, Link TM, Majumdar S. In vivo
ultra-high-field magnetic resonance imaging of trabecular bone microarchitecture at 7 T. J Magn Reson Imaging 2008 ;27:854–859.
5. Krug R, Carballido-Gamio J, Banerjee S, Stahl R, Carvajal L, Xu D, Vigneron D, Kel-ley DAC, Link TM, Majumdar S. In vivo bone and cartilage MRI using fully-balanced steady-state free-precession at 7 tesla. Magn Reson Med 2007 ;58:1294–1298. 6. Zuo J, Bolbos R, Hammond K, Li X, Majumdar S. Reproducibility of the quantitative
assessment of cartilage morphology and trabecular bone structure with magnetic resonance imaging at 7 T. Magn Reson Imaging 2008 ;26:560–566.
7. Sullivan D. Mathematical methods for treatment planning in deep regional hyper-thermia. IEEE Transactions on Microwave Theory and Techniques 1991 ;39:864–
872.
8. Wust P, Nadobny J, Felix R, Deuflhard P, Louis A, John W. Strategies for optimized application of annular-phased-array systems in clinical hyperthermia. Int J Hyper-thermia 1991 ;7:157–173.
9. Metzger GJ, Snyder C, Akgun C, Vaughan T, Ugurbil K, Van de Moortele P-F. Local B1+ shimming for prostate imaging with transceiver arrays at 7T based on subject-dependent transmit phase measurements. Magn Reson Med 2008 ;59:396–409. 10. Vaughan JT, Snyder CJ, DelaBarre LJ, Bolan PJ, Tian J, Bolinger L, Adriany G,
| 31
CardiaC rF Coil design
11. Snyder CJ, DelaBarre L, Metzger GJ, Moortele P-F van de, Akgun C, Ugurbil K, Vaug-han JT. Initial results of cardiac imaging at 7 tesla. Magnetic Resonance in Medicine 2009 ;61:517–524.
12. Gharib AM, Elagha A, Pettigrew RI. Cardiac magnetic resonance at high field: prom-ises and problems. Curr Probl Diagn Radiol 2008 ;37:49–56.
13. Hoult DI, Phil D. Sensitivity and power deposition in a high-field imaging experi-ment. J Magn Reson Imaging 2000 ;12:46–67.
14. Boskamp EB. Magnetic resonance imaging apparatus comprising a quadrature coil system. 1989 ;
15. Hyde JS, Jesmanowicz A, Grist TM, Froncisz W, Kneeland JB. Quadrature detection surface coil. Magn Reson Med 1987 ;4:179–184.
16. Kumar A, Bottomley PA. Optimized quadrature surface coil designs. MAGMA 2008 ;21:41–52.
17. Suits BH, Garroway AN, Miller JB. Surface and gradiometer coils near a conducting body: the lift-off effect. J. Magn. Reson. 1998 ;135:373–379.
18. Elderen SGC van, Versluis MJ, Webb AG, Westenberg JJM, Doornbos J, Smith NB, Roos A de, Stuber M. Initial results on in vivo human coronary MR angiography at 7 T. Magnetic Resonance in Medicine 2009 ;62:1379–1384.
19. Yarnykh VL. Actual flip-angle imaging in the pulsed steady state: A method for rapid three-dimensional mapping of the transmitted radiofrequency field. Magnetic Res-onance in Medicine 2007 ;57:192–200.
20. Wu X, Deelchand D, Yarnykh V, Ugurbil K, Van de Moortele P. Actual flip angle imag-ing: from 3D to 2D. In: Proc. Intl. Soc. Mag. Reson. Med. 2009. p. 371.
21. Wang J, Yang QX, Zhang X, Collins CM, Smith MB, Zhu X-H, Adriany G, Ugurbil K, Chen W. Polarization of the RF field in a human head at high field: a study with a quadrature surface coil at 7.0 T. Magn Reson Med 2002 ;48:362–369.
3
Right Coronary MR Angiography at
7 Tesla: A Direct Quantitative and
Qualitative Comparison with 3 Tesla
in Young Healthy Volunteers
S.G.C. van Elderen
M.J. Versluis
J.J.M. Westenberg
H. Agarwal
N.B. Smith
M. Stuber
A. de Roos
A.G. Webb
AbstrAct
Purpose:
To objectively compare quantitative parameters related to image quality at-tained at coronary magnetic resonance (MR) angiography of the right coro-nary artery (RCA) performed at 7 Tesla (T) and 3 T.
Materials and Methods:
Institutional review board approval was obtained, and volunteers provided signed informed consent. Ten healthy adult volunteers (mean age ± standard deviation, 25 years ± 4; seven men, three women) underwent navigator-ga-ted three-dimensional MR angiography of the RCA at 7 T and 3 T. For 7 T, a custom-built quadrature radiofrequency transmit-receive surface coil was used. At 3 T, a commercial body radiofrequency transmit coil and a cardiac coil array for signal reception were used. Segmented k-space gradient-echo imaging with spectrally selective adiabatic fat suppression was performed, and imaging parameters were similar at both field strengths. Contrast-to-noise ratio between blood and epicardial fat; signal-to-Contrast-to-noise ratio of the blood pool; RCA vessel sharpness, diameter, and length; and navigator ef-ficiency were quantified at both field strengths and compared by using a Mann-Whitney U test.
Results:
The contrast-to-noise ratio between blood and epicardial fat was significant-ly improved at 7 T when compared with that at 3 T (87 ± 34 versus 52 ± 13; P = .01). Signal-to-noise ratio of the blood pool was increased at 7 T (109 ± 47 versus 67 ± 19; P = .02). Vessel sharpness obtained at 7 T was also higher (58% ± 9 versus 50% ± 5; P = .04). At the same time, RCA vessel diameter and length and navigator efficiency showed no significant field strength depen-dent difference.
Conclusion:
| 35
right Coronary mr angiograPhy
introduction
Currently, relatively few (approximately 40) 7 T magnetic resonance (MR) imaging systems are available for human use, and most of them are situa-ted in research centers. High-field-strength cardiac MR imaging initially was thought to be problematic due to magnetic field inhomogeneity and spe-cific absorption rate constraints. Furthermore, contemporary commercial 7 T units are not routinely equipped with body radiofrequency (RF) transmit coils or surface RF receive coils. Despite these major challenges, a number of research groups already have demonstrated the feasibility of cardiac imaging at 7 T and beyond (1–5). Initial attempts focusing on coronary artery imaging at 7 T showed that these barriers can be removed successfully, and initial in vivo human images were promising (6). Although these early 7 T studies were conducted by using single-channel RF transmit-receive coil architecture, re-cent advances in surface coil technology seem particularly promising. Howe-ver, although an improvement in image quality may be expected at higher magnetic field strength (7), there have been no reports, to our knowledge, on cardiac MR imaging studies in which investigators directly and objectively compare parameters related to image quality at 7 T with those obtained at lower field strength. Therefore, the purpose of our study was to objectively compare quantitative parameters related to image quality attained at coro-nary MR angiography of the right corocoro-nary artery (RCA) performed at 7 T
and 3 T.
MaTeRialS and MeThodS
Our study was approved by our institutional review board, and all volunteers provided signed informed consent. Three-dimensional (3D) MR angiography of the right coronary system was performed in 10 healthy young adult vo-lunteers (mean age ± standard deviation, 25 years ± 4; seven men, three women) who underwent imaging at 7 T and 3 T (Achieva; Philips Healthcare, Best, the Netherlands) in a prospective study design. For practical reasons, 7 T imaging always occurred before 3 T imaging. Coronary MR Angiography was performed with prospective navigator technology and vector electrocar-diographic (ECG) triggering (8). All volunteers underwent imaging in a head-first, supine position. None of the volunteers received nitroglycerin before MR imaging. The mean interval between the two examinations was 8 weeks ± 5.
Imaging at 7 T
loops (13-cm diameter each) was constructed in-house (Fig 1). The coil size is larger than described previously (4, 6) to improve volumetric coverage. First, non–ECG-triggered scout images in coronal, transverse, and sagittal orientations were acquired to plan subsequent images and to localize the two-dimensional selective navigator. At 7 T, the navigator was placed at the lung-heart interface because of the limited sensitive volume of the surface coil. Second, ECG-triggered, breath-hold multisection transverse cine scout imaging was performed for both the determination of the period of minimal coronary motion (trigger delay) and the volume targeting of the 3D stack in parallel with the middiastolic RCA. Finally, volume-targeted coronary MR angiography was performed by using a 3D segmented k-space gradient-echo imaging technique (parameters are in Table 1) combined with a spectrally selective adiabatic inversion-recovery pulse (inversion time, 200 msec) for fat saturation. First-order local volume shimming at the anatomic level of the RCA was performed in all cases.
Figure 1:RF coil
Custom-built quadrature RF transmit-receive surface coil consisting of two 13-cm elements used for our study at 7 T.
Imaging at 3 T
naviga-| 37
right Coronary mr angiograPhy
tor localization in random order: (a) with navigator localization at the lung-heart interface (navigator at lung-heart) and (b) with navigator localization at the lung-liver interface (navigator at liver). Both 3 T coronary imaging sequences consisted of a 3D segmented k-space gradient-echo technique with spec-trally selective adiabatic inversion recovery (inversion time, 150 msec) for fat saturation. The coronary MR angiography imaging parameters were similar (Table 1) at both field strengths to support a fair quantitative comparison.
Table 1: Imaging Parameters at 7 T and 3 T Coronary MR Angiography
Field strength 7 Tesla 3 Tesla 3 Tesla
Sequence 3D gradient echo 3D gradient echo 3D gradient echo
Navigator position/ correction factor
Lung-Heart
interface / 1.0 Lung-Heart interface / 1.0 Lung-Liver interface / 0.6
Coil Quadrature
two-element surface
coil transmit/ receive
Body coil transmit / six-element phased array receive
Body coil transmit / six-element phased array receive
Fat suppression Adiabatic SPIR Adiabatic SPIR Adiabatic SPIR
TR (ms) 4.3 4.3 4.3
TE (ms) 1.38 1.38 1.38
TI (ms) 200 150 150
Acquired voxel
size (mm³) 0.82x0.86x2.00 0.82x0.86x2.00 0.82x0.86x2.00
Reconstructed
voxel size (mm³) 0.82x0.82x1.00 0.82x0.82x1.00 0.82x0.82x.1.00
Number of slices 30 30 30
Field of view
(mm²) 420x268 420x269 420x269
Matrix 512x312 512x312 512x312
Flip angle (˚) 15 15 15
Acquisition
window (ms) 107 108 108
Data Analysis
imaging) with the supervision of a senior researcher (M.S., with 18 years of experience in cardiac MR imaging).
The following parameters were measured: contrast-to-noise ratio (CNR) bet-ween the blood pool and the epicardial fat, signal-to-noise ratio (SNR) of the blood pool, RCA vessel sharpness and diameter of the first 4 cm, and visible vessel length. The CNR was defined as the difference in signal intensity bet-ween a manually placed region of interest (ROI) in the aortic root (mean ROI area, 1.80 cm2 ± 0.60) near the offshoot of the RCA, and that of an ROI placed
in the epicardial fat adjacent to the proximal RCA (mean ROI area, 0.90 cm2
± 0.61), divided by the standard deviation of the background signal from an ROI positioned anterior to the chest wall (noise; mean ROI area, 9.95 cm2 ±
3.98). The SNR was calculated for the blood signal intensity in the described ROI localized in the aortic root. The average signal intensity from this ROI was divided by the noise. Vessel sharpness was measured by using signal inten-sity gradients perpendicular to the 3D course of the RCA and was calculated for the proximal 4 cm of the RCA (9). The RCA vessel length was measured manually, and both vessel sharpness and diameter for the proximal 4 cm of the RCA were calculated automatically by the software.
Statistical Analysis
Data are presented as mean ± standard deviation. Comparisons were made between the results obtained at 7 T and 3 T and between the results ob-tained with the different navigator positions at 3 T. For comparisons, a non-parametric Mann-Whitney U test was used. P < .05 was considered to indi-cate a statistically significant difference.
results
Coronary MR angiography was performed successfully in all volunteers at both field strengths. At 7 T, one study volunteer complained about vertigo while the table was moving. All quantitative findings are listed in Table 2. Total time in the magnet was on average 30 minutes at 7 T and 20 minutes
at 3 T.
| 39
right Coronary mr angiograPhy
(7 T versus 3 T navigator at heart, P = .013; 7 T versus 3 T navigator at liver, P = .009).
Table 2: Quantitative results obtained from 10 healthy volunteers
7 Tesla, navigator on lung-heart 3 Tesla, navigator on lung-heart 3 Tesla, navigator on lung-liver
CNR 87.5 ± 33.9* 51.7 ± 12.7 47.8 ± 15.2
SNR blood pool 109.2 ± 46.9* 66.9 ± 19.4 67.2 ± 24.9
RCA vessel sharpness
(%) 58.3 ± 8.9
* 49.7 ± 5.1 48.9 ± 7.5
RCA vessel length (cm) 7.24 ± 2.34 8.21 ± 2.19 7.99 ± 2.73
RCA diameter, first 4 cm
(mm) 2.97 ± 0.27 3.07 ± 0.38 3.07 ± 0.37
Navigator efficiency (%) 54 ± 20 53 ± 20 46 ± 14
Acquisition time (sec) 469 ± 225 410 ± 180 470 ± 191
Heart rate (beats / min) 70 ± 15 67 ± 10 69 ± 10
* significantly different from 3 T (p<0.05). CNR: contrast-to-noise ratio between proximal coronary blood pool and surrounding perivascular tissue; RCA: right coronary artery; SNR: signal-to-noise ratio
navigator at heart, P = .520; 7 T versus 3 T navigator at liver, P = .821) also were not field strength dependent. No significant difference in CNR between the blood pool and epicardial fat, SNR of the blood pool, RCA vessel sharp-ness, vessel length, vessel diameter, navigator efficiency, or acquisition time was found between the 3 T images acquired with the different navigator localizations.
Figure 2: Coronary MR angiograms of the RCA.
Obtained at (a) 7 T and (b) 3 T in the same healthy 18-year-old man (double oblique volume targeted plane parallel to the RCA). Improved suppression of the epicardial fat (long dotted arrow) with high contrast between the blood and epicardial fat is visible at 7 T. At both fi eld strengths, a number of small branching vessels are depicted (short dashed arrows). Also at 7 T, a long portion of the RCA is visible (solid arrow = distal part of RCA). Ao = aortic root, LV = left ventricle, RV = right ventricle, TW = thoracic wall.
discussion
In our study comparing 7 T and 3 T RCA coronary MR angiography in young healthy volunteers, we found improved CNR between the blood pool and the epicardial fat, enhanced SNR of the blood pool, and increased vessel sharp-ness at 7 T. These findings may have implications, since vessel conspicuity and well-defined borders of the coronary arteries support improved identifi-cation of significant coronary artery stenoses.
di-| 41
right Coronary mr angiograPhy
agnostic quality approaching that of CT angiography may be expected soon; therefore, the development of new MR imaging methodology at higher mag-netic field strength is of particular interest.
Figure 3: Coronary MR angiograms of the RCA.
Double oblique volume targeted plane parallel to the RCA) in a healthy 26-year-old man display a high visual vessel defi nition (dotted arrows) in (a) the 7 T image compared with that at (b) 3 T. At 7 T, contrast is limited between the myocardium ( . ) and the blood pool ( .. ). Multiple RCA side branches (dashed arrows) and distal parts of the RCA (solid arrow) are depicted clearly at both fi eld strengths.
Approximately a twofold increase in SNR is predicted at 7 T when compared with 3 T (7, 12), whereas a 60% SNR improvement was found in our study, which may be explained with the prolonged T1 at 7 T and the depth pene -tration of the RF transmit-receive coil, which was clearly inferior to that at 3 T. However, a significant 60% increase in SNR with a simple coil design is en-couraging and emphasizes the need for further developments in coil techno-logy. Recent advances in RF transmit arrays (2, 3) are a step in this direction. Findings from previous studies in which investigators compared 1.5 T and 3 T coronary MR angiography (13–15) clearly demonstrated that the expected 100% improvement in SNR could not be obtained. At 7 T, the lack of com-mercially available RF coils and the only recent availability of 7 T for whole-body human use constitute additional 7 T–specific limitations. Despite these limitations, the reported 60% improvement in SNR, when going from 3 T to 7 T, is consistent with that reported for direct 1.5 T versus 3 T.
ima-ging sequences with different navigator localizations were performed at 3 T to exclude the influence of navigator localization on the quantitative pa-rameters related to image quality. Consistent with earlier findings (16), no navigator-dependent quantitative differences were observed.
Figure 4: Sinoatrial nodal artery (SN) and a proximal branch of the RCA.
Image obtained in a double oblique volume targeted plane parallel to the RCA in a healthy 28-year-old man. (a) At 7 T, there is not much difference in signal intensity between the blood pool ( . ) and the myocardium ( .. ). (b) At 3 T, this contrast is slightly improved. On b , the great cardiac vein (GCV ) can be identifi ed easily, but this structure is less visible on a , likely because of shortened T2* at 7 T, as well as limited surface coil RF penetration. Ao = aortic root, dashed arrow = RCA side branch.
The results from the RCA vessel length and diameter measurements were similar for both field strengths. This finding suggests that coverage and RF penetration of the surface coil at 7 T may not be limiting factors for visuali-zation of the RCA.
resolu-| 43
right Coronary mr angiograPhy
tion. However, the objective of our work was a direct, quantitative, objective
comparison with 3 T.
In conclusion, although substantial challenges are associated with 7 T car-diac MR imaging, a number of them have been addressed successfully. In our study directly comparing in vivo human imaging of the RCA at 7 T and 3 T in young healthy volunteers, quantitative parameters related to image quality attained at 7 T equal or surpass those from 3 T. Our results clearly warrant further evaluation in patients with coronary artery disease to assess the potential of our 7 T approach for the visualization of luminal RCA disease. Future work will concentrate on refinements in coil technology and contrast generation to support concomitant imaging of the left coronary system.
Acknowledgments
references
1. Maderwald S, Orzada S, Schäfer LC, Bitz AK, Brote I, Kraff O, Theysohn JM, Ladd ME, Ladd SC, Quick HH. 7T Human in vivo cardiac imaging with an 8-channel transmit/ receive array. In: Proceedings of the 17th Annual Meeting of ISMRM. 2009. 2. Snyder CJ, DelaBarre L, Metzger GJ, Moortele P-F van de, Akgun C, Ugurbil K,
Vaug-han JT. Initial results of cardiac imaging at 7 tesla. Magnetic Resonance in Medicine 2009 ;61:517–524.
3. Vaughan JT, Snyder CJ, DelaBarre LJ, Bolan PJ, Tian J, Bolinger L, Adriany G, Ander-sen P, Strupp J, Ugurbil K. Whole-body imaging at 7T: Preliminary results. Magnetic Resonance in Medicine 2009 ;61:244–248.
4. Versluis MJ, Tsekos N, Smith NB, Webb AG. Simple RF design for human functional and morphological cardiac imaging at 7 tesla. Journal of Magnetic Resonance 2009 ;200:161–166.
5. Frauenrath T, Hezel F, Heinrichs U, Kozerke S, Utting JF, Kob M, Butenweg C, Boe-siger P, Niendorf T. Feasibility of cardiac gating free of interference with electro-magnetic fields at 1.5 Tesla, 3.0 Tesla and 7.0 Tesla using an MR-stethoscope. Invest Radiol 2009 ;44:539–547.
6. Elderen SGC van, Versluis MJ, Webb AG, Westenberg JJM, Doornbos J, Smith NB, Roos A de, Stuber M. Initial results on in vivo human coronary MR angiography at 7 T. Magnetic Resonance in Medicine 2009 ;62:1379–1384.
7. Wen H, Denison TJ, Singerman RW, Balaban RS. The intrinsic signal-to-noise ratio in human cardiac imaging at 1.5, 3, and 4 T. J. Magn. Reson. 1997 ;125:65–71. 8. Fischer SE, Wickline SA, Lorenz CH. Novel real-time R-wave detection algorithm
based on the vectorcardiogram for accurate gated magnetic resonance acquisiti-ons. Magn Reson Med 1999 ;42:361–370.
9. Etienne A, Botnar RM, Muiswinkel AMC van, Boesiger P, Manning WJ, Stuber M. Soap-Bubble visualization and quantitative analysis of 3D coronary magnetic reso-nance angiograms. Magnetic Resoreso-nance in Medicine 2002 ;48:658–666.
10. Miller JM, Rochitte CE, Dewey M, Arbab-Zadeh A, Niinuma H, Gottlieb I, Paul N, Clouse ME, Shapiro EP, Hoe J, Lardo AC, Bush DE, de Roos A, Cox C, Brinker J, Lima JAC. Diagnostic performance of coronary angiography by 64-row CT. N. Engl. J. Med. 2008 ;359:2324–2336.
11. Kato S, Kitagawa K, Ishida N, Ishida M, Nagata M, Ichikawa Y, Katahira K, Matsumoto Y, Seo K, Ochiai R, Kobayashi Y, Sakuma H. Assessment of coronary artery disease using magnetic resonance coronary angiography: a national multicenter trial. J. Am. Coll. Cardiol. 2010 ;56:983–991.
12. Vaughan JT, Garwood M, Collins CM, Liu W, DelaBarre L, Adriany G, Andersen P, Merkle H, Goebel R, Smith MB, Ugurbil K. 7T vs. 4T: RF power, homogeneity, and signal-to-noise comparison in head images. Magn Reson Med 2001 ;46:24–30. 13. Bi X, Deshpande V, Simonetti O, Laub G, Li D. Three-dimensional breathhold SSFP
coronary MRA: a comparison between 1.5T and 3.0T. J Magn Reson Imaging 2005 ;22:206–212.
| 45
right Coronary mr angiograPhy
15. Yang PC, Nguyen P, Shimakawa A, Brittain J, Pauly J, Nishimura D, Hu B, McCon-nell M. Spiral magnetic resonance coronary angiography--direct comparison of 1.5 Tesla vs. 3 Tesla. J Cardiovasc Magn Reson 2004 ;6:877–884.
16. Stuber M, Botnar RM, Danias PG, Kissinger KV, Manning WJ. Submillimeter three-dimensional coronary MR angiography with real-time navigator correction: compa-rison of navigator locations. Radiology 1999 ;212:579–587.
17. Botnar RM, Stuber M, Danias PG, Kissinger KV, Manning WJ. Improved coronary artery definition with T2-weighted, free-breathing, three-dimensional coronary MRA. Circulation 1999 ;99:3139–3148.
4
improved Signal-to-noise in Proton
Spectroscopy of the human calf
Muscle at 7 Tesla Using localized B
1Calibration
Maarten J. Versluis
Hermien E. Kan
Mark A. van Buchem
Andrew G. Webb
AbstrAct
| 49
loCalized B1 CaliBration
introduction
Human MRI at high magnetic fields, i.e., 7T and above, has to overcome a large variation in the strength of the radiofrequency field (B1) over the ima-ging volume. The primary, intrinsic reason is that the wavelength of the cor-responding radiofrequency (RF) excitation and reception is less than, or com-parable to, the dimensions of the body. The second, more practical reason is that the lack of a body coil, particularly on commercial systems, leads to a more frequent use of local Tx / Rx surface coils than at lower field. Both of these factors result in accurate tip angle calibration techniques being very important for obtaining the optimal SNR. Conventional methods used com-monly at lower field strengths, which measure the tip angle averaged over a slice or over the complete sensitive volume of the coil (1, 2) lead to subopti-mal results at high field, as outlined by a recent article on 7 T cardiac imaging (3).
Many different approaches have been proposed for B1 mapping, including those based on repeated measurements with different tip angles (4–6), dif-ferent repetition times (7), measuring the ratio between the signal intensity from spin echoes and stimulated echoes (1, 2, 8, 9), and detecting tip angle related phase changes (10). These methods can be divided in two categories: first, those that use gradients to encode the entire volume and calculate the tip angle on a pixel-by-pixel basis (4–10), and second, those that measure the tip angle over a large volume using non-selective, or slice-selective RF pulses (1, 2). Methods in the first category tend to be lengthy procedures and are therefore not suitable for use as a calibration sequence in a clinical setting. Methods in the second category are fast but lead to inaccurate results when the B1 distribution is very inhomogeneous.
technique (POslice), the standard on most commercial MR systems that aver-ages the measured tip angle over a slice through the center of the VOI (2).
MeThodS
All experiments were performed on a commercial 7 T Philips Achieva MRI scanner (Philips Healthcare, Best, The Netherlands). A quadrature half-vol-ume Tx/Rx coil was constructed for the human calf. Two square loops of dimensions 10 cm were constructed from copper tape (1 cm wide, 25 µm thick), which was fixed to a flexible Teflon former (2 mm thickness). The loops were capacitively split into sections ~5 cm in length, corresponding to 1/20th of the RF wavelength at 7 T. The two loops were overlapped by ~10%
to minimize mutual inductance. Balanced impedance matching using vari-able capacitors and a lattice balun were used for each excitation port, which were fed from the quadrature outputs of the Philips transmit/receive inter-face box. The entire coil assembly was mounted on a rigid semi-cylindrical plexiglass former (thickness 5 mm, inner diameter 15 cm). A layer of foam, ~1 cm thick, was placed inside the cylinder, and the subject’s lower leg lay on top of this foam layer.
Subjects
Seven volunteers (6 males, 1 female, age 37 ± 9 years) were scanned and localized spectra were obtained at multiple locations with respect to the coil. In addition, a B1 map was obtained from one volunteer to show the RF ho-mogeneity of the coil. Informed consent was obtained from all subjects in accordance with guidelines of the local medical ethics committee.
Calibration sequence
The power of the RF amplifier was calibrated by measuring the tip angle in a VOI using the ratio of the signal intensities from two stimulated echoes for the four-pulse sequence shown in Figure 1. A three-dimensional volume was selected using four slice-selective RF pulses. The first three pulses were applied with the gradients in orthogonal directions, with the fourth RF pulse applied simultaneously with the gradient in the same direction as during the third RF pulse. The resulting stimulated echo signals were acquired. All other free induction decay and echo pathways were carefully spoiled using crusher
gradients.
| 51
loCalized B1 CaliBration
[1]
where αi denotes the RF pulse angle for the different pulses, and τi denotes
the time at which each RF pulse is applied. When α2 equals α3 Eq. [1] reduces to:
[2]
The value of τ3 is chosen such that τ3 << T1 (12). Therefore the tip angle can be accurately estimated for the selected volume using the following equation:
[3]
For the pulse sequence in Figure 1, the maximum signal intensity for the STE2 signal occurs when the tip angle for α0 and α1 is90°,and 45° for α2 and α3.
Figure 1: Sequence diagram of the volume selective RF calibration technique.
A volume is selected using four RF pulses and gradients. Targeted angles for maximum signal intensity of STE2 are α0 = α1 = 90° and α2 = α3 = 45°. Two stimulated echoes are acquired (STE1 and STE2) at times 2τ1+τ2 and 2τ1+τ3 respectively, while the spin-echo and free induction decay pathways are spoiled using crusher gradients on all three axes. The intervals between the RF pulses are: τ1 = 8 ms, τ2 = 15 ms and τ3 = 19.5 ms.
The sequence was performed twice, both before and after shimming and determination of the water resonance frequency (f0). Both shimming and f0
determination were performed using adiabatic pulses, which are relatively insensitive to variations in RF power. Image based shimming (13) as provi-ded by the manufacturer was used for regions where conventional shimming
failed.
The conventional slice-selective calibration method was measured with the slice oriented along the slice selection direction of the VOI, which was, de-pending on the exact orientation of the voxel, approximately perpendicular
to the coil.
Localized spectroscopy
The new calibration technique was evaluated in several stimulated echo ac-quisition mode (STEAM) MR spectra of the calf muscle. The following scan parameters were used: 10x10x10 mm3 voxel, TR = 2000 ms, mixing time (TM)
| 53
loCalized B1 CaliBration
locations in the calf muscles, one set using the standard power calibration sequence over the entire slice, and the other set with the new four-pulse vo-lume-selective calibration technique. In addition, for both scans a non-water suppressed scan with the same settings as the water suppressed scan was acquired to measure SNR using eight averages. The VOIs for the spectrosco-py scans were positioned in the central zone of the soleus muscle (SOL), the medial side of the gastrocnemius muscle (GM) and in two different locations in the medial side of the soleus muscle (SM) based on a T1 -weightedanato -mical image acquired with the following parameters: TR / TE / flip angle (FA) = 300 ms/ 5.2 ms/ 30°, voxel = 0.5 x 0.5 x 4 mm3, field-of-view (FOV) = 180 x
180 x 66 mm3, 15 slices, scan duration is two minutes.
The spectra were viewed in jMRUI (14) and the AMARES algorithm (15) was used to fit the water peak based on a Lorentzian line shape. The SNR of the spectra was measured by dividing the integrated area under the fitted water peak of the non-water-suppressed scans by the standard deviation of the last 200 points of the time-domain signal, which contained only noise. The water signal was chosen because the intensity is much larger than that of any metabolite and since residual dipolar couplings and bulk susceptibility effects can hamper accurate quantification of metabolite signals in muscle (16).
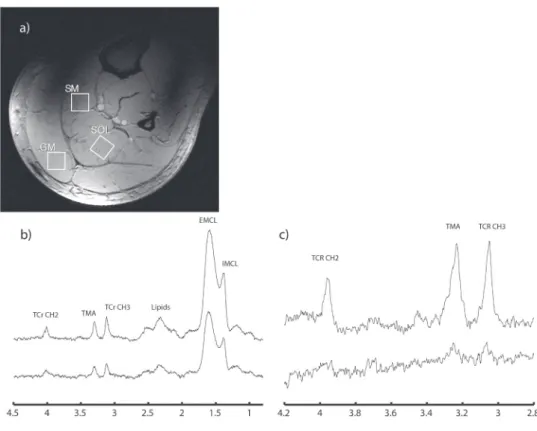
Figure 2: Coverage and B1-profile of coil.
The left image (a) shows a single slice from a low resolution 3D gradient echo sequence of the calf muscle. The right image (b) shows the corresponding B1 map scaled as a percentage
B1 mapping
A B1 map was acquired using a 3D spoiled gradient echo sequence with two interleaved repetition times (TR1 and TR2) with the following parameters: TR1 / TR2 / TE / FA = 20 ms/ 100 ms/ 1.8 ms/ 30°, voxel = 2 x 2 x 4 mm3, FOV = 180
x 180 x 116 mm3, total scan duration is two-and-a –half minutes. The ratio of
the resulting images with different TR yields a tip angle distribution map (7).
results
Figure 2 shows a single slice from the 3D B1 map illustrating that the tip angle varies considerably over the field-of-view, and that the excitation pattern is not symmetric. The latter observation is in line with several previous studies carried out at high field (17). The sensitive region of the coil is large enough to almost completely cover the soleus and gastrocnemius muscles, and the tip angle varies by more than a factor-of-two over this region. Toward the SM on the medial side of the leg there is a region where the B1 inhomogeneity is particularly pronounced. Differences were found in the result of the calibra-tion sequence before and after f0 determination and shimming when the VOI was moved from the SOL to the SM.
Figure 3a shows the approximate locations of three volumes from which localized spectra were obtained. For all volunteers, the POvolume calibration sequence iteratively arrived at the desired pulse angle for the selected vo-lume. At the location of the SM conventional volume shimming failed due to the high B1 inhomogeneities, therefore image based shimming was used. MR spectra in the SM were acquired at two different locations within the same volunteer because of the high variability in B1 in that region. Increases in SNR were found in all locations when compared to the standard POslice technique. The amount of SNR increase was dependent on the location with respect to the coil. Representative spectra from the SOL are shown in figure 3b and spectra from the SM are shown in figure 3c. The bottom spectrum is acquired with the POslice technique, whereas the one at the top is acquired with the POvolume technique. The POvolume technique results in an increase in SNR of 24% and 224% for SOL and SM, respectively, in this volunteer, based
upon the unsuppressed water signal.
Figure 4 shows the SNR increases averaged over all volunteers for different regions in the calf muscles. The measured increases in SNR were 34 ± 5% in the GM, 22 ± 5% in the SOL and 166 ± 42% in the SM based upon the
| 55
loCalized B1 CaliBration
Figure 3: Anatomic image and acquired MR spectra.
(a) T1-weighted anatomical image for reference showing the locations where the MR spectra were obtained. (b) Localized MR spectra of the SOL of a volunteer, top: POvolume , bottom: POslice. (c) Localized MR spectra of the SM, top: POvolume , bottom: POslice. Note the clear increase in SNR of the spectra from the new volume-selective power optimization method. Based on the signal intensity of the water peak (not displayed) an SNR increase of 24% was found in (b) and 224% in (c). Scan parameters: STEAM sequence, 10x10x10 mm3 voxel, TR/
TM / TE = 2000 ms/ 25 ms/ 25 ms, 64 averages. Volumes were placed in the central zone of the soleus muscle (SOL), the medial side of the gastrocnemius muscle (GM) and the medial side of the soleus muscle (SM).
discussion