SOCIAL AND NONSOCIAL EFFORT-BASED DECISION-MAKING IN ADOLESCENTS WITH AUTISM SPECTRUM DISORDERS
Maya G. Mosner
A thesis submitted to the faculty of the University of North Carolina at Chapel Hill in partial fulfillment of the requirements of the degree of Master of Arts in the Department of Psychology
and Neuroscience (Clinical Psychology).
Chapel Hill 2016
iii ABSTRACT
Maya G. Mosner: Social and Nonsocial Effort-Based Decision-Making in Adolescents with Autism Spectrum Disorders
(Under the direction of Gabriel S. Dichter)
There has been recent emphasis on addressing the impact of motivational factors on social deficits in Autism spectrum disorders (ASD). The present investigation evaluated effort-based decision-making in social and nonsocial contexts to examine one aspect of social
iv
TABLE OF CONTENTS
LIST OF TABLES………... v
LIST OF FIGURES……… vi
LIST OF ABBREVIATIONS………... vii
SOCIAL AND NONSOCIAL EFFORT-BASED DECISION-MAKING IN ADOLESCENTS WITH AUTISM SPECTRUM DISORDERS………... 1
The Social Motivation Hypothesis of Autism………. 2
The Current Study……… 3
METHODS………... 6
Participants………... 6
Procedure………. 7
Materials and Measures………... 8
DATA ANALYTIC PLAN………16
RESULTS……….. 17
Symptom and Dimensional Measures……… 17
Primary Analysis……… 18
Correlational Analysis………..23
DISCUSSION……… 24
Limitations………. 27
v
Clinical Implications……….. 29
Conclusions……… 30
APPENDIX: SUPPLMENTARY ANALYSES……… 42
vi
LIST OF TABLES
Table
1. Mean (and Standard Deviation) scores on demographic and
clinical measures for the ASD and TDC Groups………. 31 2. Assessments administered to different age and diagnostic groups………... 32 3. Mean (and Standard Deviation) scores for the ASD and TDC Groups………... 33 4. Correlations between the proportion of hard task choices and
vii
LIST OF FIGURES
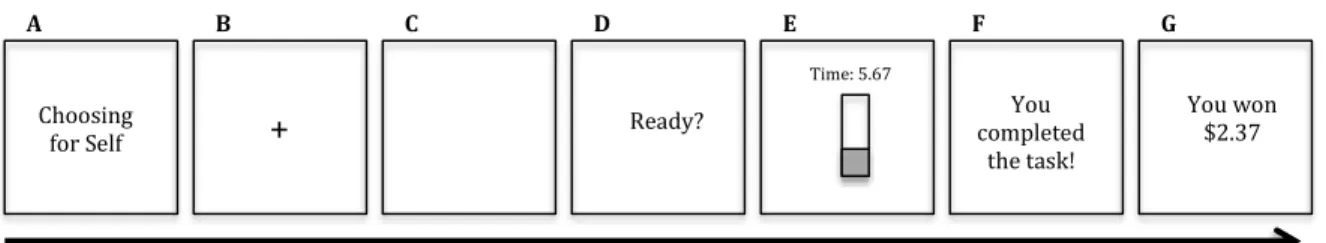
Figure 1 – Schematic diagram of a single trial of the “Self vs. Other” modified
version of the Effort Expenditure for Rewards Task (EEfRT)……….. 35
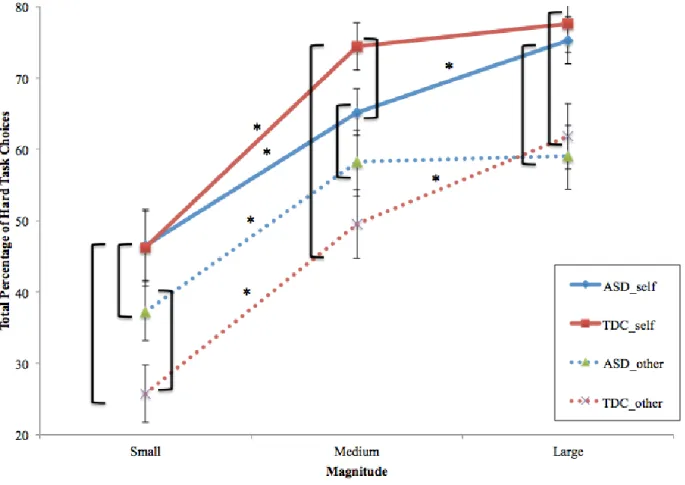
Figure 2 – Reward Magnitude for Self and Other………. 36
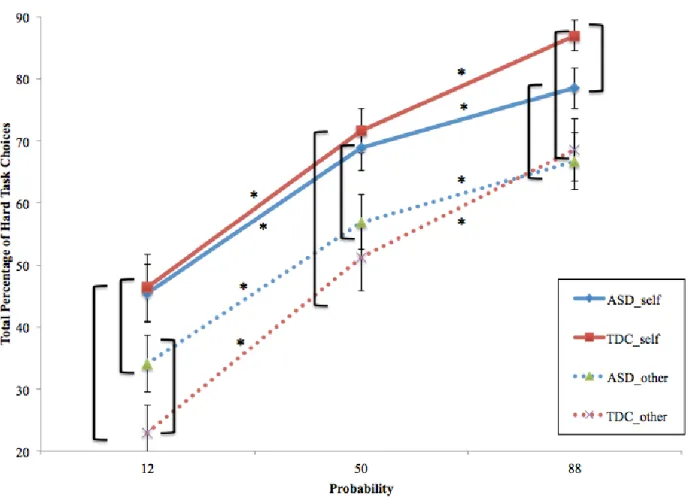
Figure 3 – Reward Probability for Self and Other………. 37
Figure 4 – Correlations with TEPS-C and Reward Magnitude for Self……… 38
Figure 5 – Correlations with TEPS-C and Reward Probability for Self……… 39
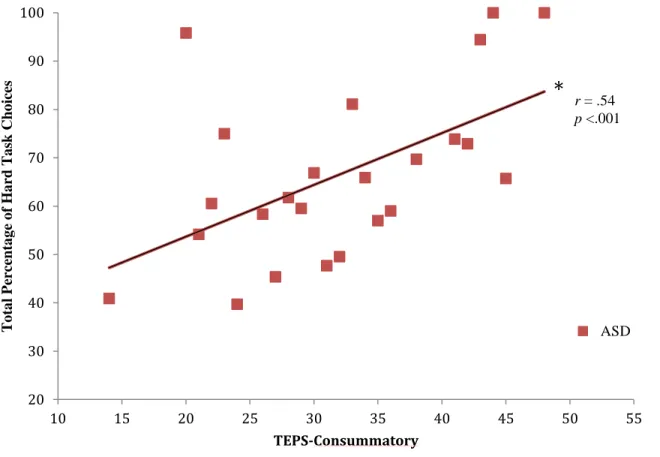
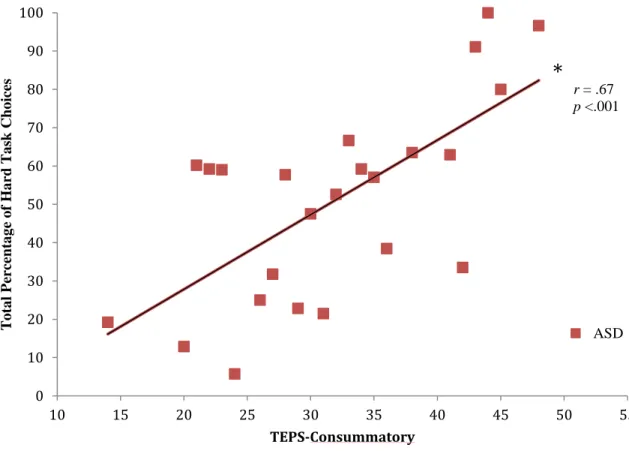
Figure 6 – Correlations with TEPS-C and Reward Magnitude for Other………..40
viii
LIST OF ABBREVIATIONS
ASD Autism Spectrum Disorder
EEfRT Effort Expenditure for Rewards Task TDC Typically Developing Control
TEPS Temporal Experience of Pleasure Scale
1
SOCIAL AND NONSOCIAL EFFORT-BASED DECISION-MAKING IN ADOLESCENTS WITH AUTISM SPECTRUM DISORDERS Since Leo Kanner’s (1943) seminal paper that described children with “autistic disturbances of affective contact,” impairments in social communication have been
conceptualized as a core deficit of autism spectrum disorders (ASD; American Psychiatric Association, 2013). Current definitions of ASD continue to emphasize social communication deficits, which have been shown to encompass impairments in certain domains of social
cognition, including difficulties with social attention, joint attention, and theory of mind (ToM). For example, deficits in eye contact are a diagnostic feature of ASD and indices of eye contact are included in many ASD diagnostic instruments (i.e. the Autism Diagnostic Observation Schedule, ADOS; Lord et al., 2000). Within the first six months of infancy, individuals later diagnosed with ASD exhibit diminished attention to the eyes of others (Jones & Klin, 2013). Studies examining early home videos of children have shown that those later diagnosed with ASD are significantly less likely to respond to their name or look at people than are typically-developing counterparts (Baranek, 1999; Werner, Dawson, Osterling, & Dinno, 2000).
2
stories and films (Baron-Cohen, Wheelwright, Hill, Raste, & Plumb, 2001; Golan, Baron-Cohen, & Golan, 2008; White, Hill, Happe, & Frith, 2009).
The Social Motivation Hypothesis of Autism
Despite extensive data that indicate social communication deficits in ASD, recent evidence highlights the influence of motivational factors in social communication abilities in ASD. That is, it appears that deficits in social motivation may contribute to social
communication impairments in ASD such that, under certain motivational conditions, certain social cognitive abilities, such as difficulties solving ToM tasks and recognizing basic facial expressions, may not be impaired in ASD (Chevallier, Kohls, et al., 2012; Lahaie et al., 2006; Wang, Dapretto, Hariri, Sigman, & Bookheimer, 2004). Chevallier and colleagues (2012) theorized that social motivation plays an important role in social communication abilities, leading to the development of the “social motivation hypothesis of autism.” This framework is a complementary model to existing theories of social cognition and posits that early-emerging disruptions in social motivation may be a primary deficit in ASD, with downstream effects on the development of social communicative skills (Chevallier, Kohls, et al., 2012; Dawson et al., 2004). According to this model, social motivation is defined as psychological dispositions and biological mechanisms that increase motivation to orient to the social world (social orienting), to take pleasure from social interactions (social reward), and to work to gain and maintain social relationships (social maintaining), each of which has been shown to be disrupted in individuals with ASD (Chevallier, Grezes, Molesworth, Berthoz, & Happe, 2012; Chevallier, Kohls, et al., 2012; Sasson & Touchstone, 2014).
3
infrequent orienting to one’s own name (Dawson, Bernier, & Ring, 2012). Additionally, individuals with ASD tend to show these deficits from infancy that persists through early childhood, which can impede the development of social functioning. For instance, compared with typical peers, children with ASD reported less enjoyment in social situations, and social enjoyment in this sample was correlated with diminished flattery behavior (Chevallier, Grezes, et al., 2012). These classic deficits can be conceptualized as a reflection of social cognitive deficits or alternatively, as social cognitive deficits resulting from decreased pleasure from social stimuli and/or contexts (“reward liking”), as well as diminished anticipation of social rewards (“reward wanting”) (Chevallier, Kohls, et al., 2012; Dichter et al., 2012).
The Current Study
To better understand the influence of social motivation deficits on social impairments in ASD and how these deficits interact, paradigms are needed that are capable of teasing these two constructs apart. Most studies of ASD have examined social cognition and social motivation separately, proposing that early impairments in social motivation can lead to social cognition deficits throughout development (Chevallier et al., 2014; Schultz, 2005). To date, only two studies have concurrently assessed social motivation and social cognition in ASD. Chevallier and colleagues (2014) found that, due to diminished sensitivity to the presence of others (reduced social motivation), children with ASD demonstrated ToM deficits only when the ToM task was administered by a human rather than by a computer. Peterson and colleagues (2013)
demonstrated that adequate incentives boosted motivation and, as a result, improved
4
The purpose of the present investigation was to evaluate effort-based decision-making in social and nonsocial contexts as a means to address one aspect of the social motivation
hypothesis of ASD. Animal studies have demonstrated a “law of least effort”, namely that animals choose to exert the least amount of effort necessary to obtain a reward; however, when reward preferences increase, due to reward magnitude for instance, the animal will exert more effort to obtain such a reward (Salamone, 2006; Solomon, 1948). Factors influencing effort exertion include: perceived effort required, valuation of potential rewards, and the probability that the reward will be received if the animal is successful at completing the task (Salamone, 2006). Further, dopaminergic activity in the ventral striatum (and more specifically, the nucleus accumbens) mediates how behavioral choices are influenced by expected reward value and effort expenditure (Salamone, Correa, Farrar, & Mingote, 2007). Therefore, effort-based decision-making paradigms are designed to measure motivation for reward based on how much effort is exerted to obtain a reward of a given magnitude. The Expenditure for Rewards Task (EEfRT) was created as a task sensitive to these motivational processes and to mimic these classic
preclinical behavioral tasks that assay behavioral output of the mesolimbic dopaminergic system (Treadway et al., 2009; Treadway & Zald, 2011).
Recent studies have used the EEfRT to examine motivational processes in nonclinical and clinical populations. EEfRT performance is modulated by the administration of d
5
Zald, 2012; Treadway et al., 2009). Most recently, the EEfRT was found to be a valid and reliable measure of effort expenditure for rewards in individuals with schizophrenia (Reddy et al., 2015).
Our research group previously used the EEfRT to measure effort-based decision-making in adults with ASD. Damiano et al. (2012) found altered patterns of effort-based decision-making in ASD characterized by more hard task choices to expend effort to obtain rewards and an insensitivity to the magnitude or probability of the reward relative to expended effort. These results suggest hyperactive behavioral output of the mesolimbic dopamine system in individuals with ASD and provide further evidence that individuals with ASD display atypical patterns of effort-based motivation for rewards. In the present study, we sought to downward extend these findings to adolescents with ASD. Additionally, to address both social motivation and social cognition, the present study used a modified version of the EEfRT that includes social and nonsocial conditions in adolescents 12-20 years old and age- and gender-matched typically developing controls (TDC). Specifically, the task included conditions where participants worked toward earning rewards for themselves (“Self”) or another study participant (“Other”).
6
the proportion of hard task choices would not be accounted for by ToM deficits. Finally, linkages between effort-based decision-making and symptom severity, as well as dimensions of affect and reward sensitivity, were explored. I hypothesized that patterns of effort-based decision-making in the ASD group would predict more severe core autism symptoms and more severe impairments in associated measures of affective and reward sensitivity.
Methods
The biomedical institutional review board reviewed and approved this study and data collection is complete.
Participants
Fifty adolescents with ASD and 32 TDCs ranging in age from 12-20 years participated in this study. All participants with ASD were high functioning, defined as having fluent phrase speech and a nonverbal IQ>70. Groups were matched on chronological age. Across both groups, inclusion criteria included: no known sensory deficits or diagnosis of intellectual disability. Additional inclusion criteria for the ASD group included: an established clinical diagnosis corroborated by the Autism Diagnostic Observation Schedule, Second Edition (ADOS-2). Additional inclusion criteria for the TDC group included: no current or history of diagnosis of ASD or other Axis I diagnoses assessed via the MINI International Neuropsychiatric Interview (MINI), self-report and MINI for Children and Adolescents (MINI-KID-P).
7
more females in the TDC group than in the ASD group. Findings from the MINI and MINI-KID-P revealed that 68% (n=34) of the ASD group met criteria for at least one comorbid disorder. Recruitment
Participants with ASD were recruited via the UNC Autism Research Registry, a resource at the Carolina Institute for Developmental Disabilities (CIDD). A mailing and brochure was distributed to individuals identified by the Registry personnel and participants responded if interested. If this was the case, their contact information was passed along only to the research team. Recruitment of typically developing adults (>18) took place via mass email to UNC-Chapel Hill employees and students. I recruited typically developing adolescents (<18) via the CIDD Child Development Registry (http://www.cidd.unc.edu/Registry/researchers/default.aspx). Once interest was determined and contact information obtained, a member of the research team contacted the participant (or parent) via phone or email to schedule the appointment.
Procedure
For both groups (ASD and TDC), the study included a 2-4 hour testing session at the CIDD located in Carrboro, NC. Prior to participation, consent was obtained from all parents and adolescents over 18 years of age and assent was obtained from adolescents younger than 18 years. Following consent, the EEfRT task, diagnostic and symptom assessments, and cognitive test were conducted. Demographic information was also collected. The EEfRT task and
8
compensation, participants received $10 per hour, $10 for completion of the computer task, and an additional $2.00-8.66 earned during the behavioral task.
Materials and Measures
Effort-based decision-making task. The primary goal of the central study was to
examine effort-based decision-making in adolescents with ASD in social and nonsocial contexts. Participants completed a modified version of the Effort-Expenditure for Rewards Task (EEfRT; Damiano et al., 2012; Treadway et al., 2009; Treadway & Zald, 2011), the “Self vs. Other” EEfRT, which was created by collaborator Dr. Michael Treadway who developed the original EEfRT. During one block of trials, participants were making decisions about rewards for themselves (“Self”), and during the other block of trials they were making decisions about rewards for someone else (“Other”) (see Figure 1).
The EEfRT task is a multi-trial game in which participants were given an opportunity on each trial to choose between two different task difficulty levels in order to obtain rewards. For all trials, participants made repeated manual button presses within a short period of time. Each button press raised the level of a virtual “bar” displayed. Participants were eligible to win money during each trial if they raise the bar to the “top” within the given time period. Each trial
presented the participant with a choice between two levels of task difficulty, a “hard task” and an “easy task.” Successful completion of hard task trials required the participant to make 100 button presses within 21 seconds, using his/her non-dominant pinky finger, while successful completion of easy-task trials required the participant to make 30 button presses within seven seconds, using his/her dominant index finger.
9
participants were eligible to win greater amounts that varied per trial within a range of $1.24 – $4.30 (“reward magnitude”). There were three levels of magnitude: small magnitude was defined as any value between $1.24 and $2.00; medium magnitude included values between $2.01 and $3.00; and large magnitude included values between $3.01 and $4.12. Additionally, participants were not guaranteed to win the reward if they completed the task; some trials were “win” trials, in which the participant received the stated reward amount, while others were “no win” trials, in which the participant received no money for that trial. To help them determine which trials were more likely to be win trials, participants were provided with accurate probability cues at the beginning of each trial (“reward probability”). There were three levels of probability: “high” 88% probability of being a win trial, “medium” 50% and “low” 12%. These levels always applied to both the hard task and easy task, and there were equal proportions of each probability level across the experiment. Each level of probability appeared once along with each level of reward value for the hard task (Treadway et al., 2009). Both reward magnitude and reward probability have been shown to influence nucleus accumbens dopamine release during reward anticipation, especially during high uncertainty (50%) and high reward magnitude trials (Fiorillo, Tobler, & Schultz, 2003; Schultz, 2002). Furthermore, at the beginning of each trial and prior to receiving information about reward magnitude and probability, participants were told whether or not they would be earning money for themselves or for an imaginary “other” person whom they had not met (the next participant in the study). They were also informed that a previous
participant already earned money for them. Trials were presented in the same randomized order for every participant.
10
of money won during those trials. Participants were informed that the task takes approximately twenty minutes. Given that hard task trials take approximately twice as much time to complete as easy-task trials, the number of trials completed depended in part on the choices that the
participant made. Therefore, making more hard task choices at the beginning of the experiment could reduce the total number of trials, which could mean that the participant would not get a chance to play high value, high-probability trials that might appear towards the end of the playing time. This trade-off was meant to ensure that neither a strategy of always choosing the easy nor the hard option could lead to an “optimal” performance on the task.
All trials began with information regarding whether participants were “choosing for self” or “choosing for other” for the given trial. This was followed by a one-second fixation cross, then a choice period in which participants were given information regarding the reward
magnitude of the hard task and the probability of receiving reward. The unlimited choice period was modified from the original version of the EEfRT in order to accommodate potential slower processing speeds in the ASD group (Damiano et al., 2012). After making a choice, participants were then shown a one-second “Ready” screen after which they completed the task. Following task completion, participants were shown a two-second feedback screen informing them whether the task was successfully or unsuccessfully completed. If participants successfully completed the task, a second feedback screen appeared for two seconds in which they were told whether they won money for that trial (reward feedback). In total, easy-task trials took approximately 15 seconds while hard task trials took approximately 30 seconds.
11
rate of $10 for completing the task, plus any additional money that they might “win” during the task. Thus, participants could receive $12.00-$18.66 for completing this portion of the task.
Diagnostic Assessments. ASD participants were given a gold-standard diagnostic tool, the Autism Diagnostic Observation Schedule, Second Edition (ADOS-2) to confirm ASD diagnoses (Lord et al., 2012). The ADOS was conducted by a research reliable assessor
supervised by Dr. Dichter, a licensed psychologist. Modules 3 and 4 of the ADOS-2 were used, as they are designed for verbally fluent children and adolescents, respectively. The difference between the modules lies primarily in whether information about social communication is
necessary during play or through a conversational interview; adolescents may feel uncomfortable or uninterested in playing with toys such as action figures. Each module includes 10-15
activities, with 29-31 accompanying ratings. Standard algorithm cutoffs for ASD were met on the ADOS-2.
To assess for past or present Axis I psychopathology, all participants completed either the MINI International Neuropsychiatric Interview (MINI) or the MINI for Children and
Adolescents (MINI-KID-P). The MINI is a semi-structured clinical diagnostic interview that evaluates the presence of current DSM-IV and ICD-10 psychiatric disorders in adults; the MINI-KID-P evaluates the presence of these disorders in children and adolescents ages 6-17 via parent interview (Sheehan et al., 1998; Sheehan et al., 2010). The MINI and MINI-KIP-P have yet to be validated in an ASD sample; however, there is no gold standard tool to assess comorbid
12
study, the goal was to use the same instrument across all participants while considering
participant burden. Therefore, I chose the MINI and the MINI-KID-P because it is brief and has concordant validity with the K-SADS (Sheehan et al., 2010).
Cognitive Assessment. Intellectual functioning was assessed using the Wechsler Abbreviated Scale of Intelligence (WASI) or the Kaufman Brief Intelligence Test, Second Edition (KBIT-II). The WASI is a reliable measure of intelligence that comprises of four subtests: Vocabulary, Similarities, Block Design, and Matrix Reasoning. The KBIT-2 is a reliable measure of intelligence that comprises of three subtests: Verbal Knowledge, Matrices, and Riddles. Both tests can be administered in just 30 minutes and produce scores for Verbal Intelligence Quotient (VIQ), Performance IQ (PIQ), and Full Scale IQ (FIQ). The WASI is in concordance with the full Wechsler Adult Intelligence Scale (WASI; Axelrod, 2002) and the KBIT-2 is in concordance with the full Kaufman Assessment Battery for Children (KABC-II; Kaufman & Kaufman, 2004). Both have been used in ASD samples (Bardikoff & McGonigle-Chalmers, 2014; Damiano et al., 2012).
ASD Symptom and Associated Measures. Symptom severity, affective functioning, and reward sensitivity were assessed with self- and caregiver-report measures (see Table 2).
Core Autism Symptoms.The Social Responsiveness Scale (SRS) is a self-report
instrument that provides a dimensional measure of autism impairments. The 65-item rating scale measures the severity of social-communicative autism symptoms as they occur in natural social settings (Constantino et al., 2003). Participants responded on a four-point Likert scale,
13
year olds); caregivers completed the caregiver-report version of the SRS (SRS-CR) for participants younger than 18 years old.
Theory of mind. Theory of mind (ToM) was assessed using several first- and second-order ToM tasks. The first ToM task was the Sally-Anne task, a first-second-order ToM task that has been used to demonstrate impaired ToM in individuals with ASD (Baron-Cohen, Leslie, & Frith, 1985; Holroyd & Baron-Cohen, 1993; Surian & Leslie, 1999). The other two second-order ToM tasks included the Puppy Story and Prisoner Story (Happe, 1994; Tager-Flusberg & Sullivan, 1994). The Prisoner Story was administered first and only if participants failed to correctly respond to this first task were the Puppy Story and Sally-Anne task administered subsequently.
Anhedonia and Reward. The Temporal Experience of Pleasure Scale (TEPS) measures, on a scale of 1 to 5, how true a particular statement is for an individual, with 1 being “very false” and 5 being “very true.” Such statements include “I appreciate the beauty of a fresh snowfall” and “When something is coming up in my life, I really look forward to it” (Gard, Gard, Kring, &
John, 2006). The measure comprises of nine items for each of two scales, consummatory
pleasure and anticipatory pleasure, and was administered to all participants with and without ASD. Total scores were generated for the two subscales with higher scores indicating greater levels of pleasure.
14
greater levels of apathy. This measure was administered to both groups, including a separate report for male and female participants as well as a self-report and caregiver report.
The Sensitivity to Punishment and Sensitivity to Reward Questionnaire (SPSRQ) is a response item questionnaire with 48 yes/no items comprising 24 items for each of two scales: sensitivity to punishment (SP) and sensitivity to reward (SR; Torrubia, Avila, Molto, & Caseras, 2001). For the purposes of the current study, only the sensitivity to reward subscale was
analyzed, with higher scores indicating greater sensitivity to reward. For both groups, 18-20 year-old participants filled out the self-report version (SPSRQ-SR) and parents filled out the caregiver-report version (SPSRQ-CR).
The Behavioral Inhibition Scale (BIS) evaluates aspects of anticipation of punishment (Carver & White, 1994) and is made up of seven items as part of the full Behavioral Inhibition Scale and Behavioral Activation Scale (BIS/BAS). Participants respond on a scale of 1 to 4, representing a range from “I do not agree at all” to “I totally agree.” The Child BIS/BAS (C-BIS/BAS) is a semi-structured interview that has been modified for parent/caregiver report in which parents respond on a scale of 1 to 7, ranging from “extremely true” to “extremely untrue” regarding child. The C-BIS/BAS helps to create a more comprehensive picture of the child’s everyday behavior and symptoms (Blair, Peters, & Granger, 2004). Both the BIS/BAS and C-BIS/BAS were administered to both groups.
15
was administered to 18-20 year-old adolescents with and without ASD. The research assistant checked this measure immediately following administration. In the highly unlikely event that the respondent indicated a desire to harm him/herself, Dr. Dichter, the PI of this protocol, was called to evaluate whether referral to a treatment provider or the emergency room would be
appropriate. A total of 10 participants indicated passive suicidal ideation over the course of the study, though no imminent risk or active ideation was ever determined. Similarly, the Child Depression Inventory (CDI) comprises 28 items, each of which includes three statements to evaluate the presence and severity of specific depressive symptoms in individuals between the ages of 7 and 17. For each item, the participant is asked to select the statement that best describes his/her feelings (Helsel & Matson, 1984). This measure was administered to adolescents (ages 12-17) with and without autism.
The Behavioral Activation Scale (BAS) items,part of the BIS/BAS, are designed to evaluate aspects of behavior such as reward responsiveness (five items), drive (or persistent pursuit of goals; four items), and fun seeking behaviors (four items) (Carver & White, 1994). The C-BIS/BAS includes similar sub-scales (Blair et al., 2004).
16
form was filled out only by parents of adolescents ages 12-17. A total score was generated with higher scores indicating greater degrees of development.
Data Analytic Plan
A priori hypotheses investigated whether the ASD group differed compared to the TDC group on their willingness to expend effort to obtain uncertain rewards for Self and rewards for Other. As such, the primary analysis was an omnibus 2 (Group: ASD, TDC) × 3 (Magnitude: Small, Medium, Large) × 3 (Probability: Low (12%), Medium (50%), High (88%)) × 2
(Condition: Self, Other) repeated measures analysis of variances on the percentage of hard task choices. I considered using Self-Other difference scores that would reflect the bias to make hard task choices for Self versus Other; however, because difference scores obscure whether effects are driven by aberrant scores on one dimension or the other, difference scores were not used. Follow-up analyses examined between- and within-group differences within and across each level of Magnitude and Probability for Self and Other conditions separately. Age and IQ were not covaried in the primary analysis (1) to allow for a direct comparison with results from adults with ASD in Damiano et al. (2012), and (2) because there are no published data documenting relationships between gender and IQ and EEfRT performance. Results with these covariates, as well as pubertal development (PPDS total score), are reported in supplementary analyses (see Appendix).
I intended to include ToM as a covariate in primary analyses to address the contribution of ToM deficits to effort-based decision-making. However, initial analyses revealed,
17
analyses (see Appendix). Lastly, supplementary analyses also include an examination of results excluding participants with comorbid diagnoses.
Correlational analyses examined relationships between effort-based decision-making and ASD symptoms as well as affective and reward sensitivity in the ASD group. Specifically, I examined the relationship between the percentage of hard task choices and scores from the following measures: SRS, CDI or BDI, SPSRQ (Reward subscale only), TEPS (Anticipatory and Consummatory subscales), BIS/BAS or C-BIS/BAS (BIS, BAS-Drive, BAS-Fun Seeking, and BAS-Reward Responsiveness subscales), the AES, and ToM. To more fully explore patterns in the data, these analyses were not corrected for multiple comparisons.
Results
Symptom and Dimensional Measures
Not surprisingly, groups significantly differed on the SRS, t(80)=12.40, p<.0001, with greater ASD symptoms reported in the ASD group compared to the TDC group. Importantly, the mean t-score for the TDC group fell within the normal range while the mean t-score for the ASD group fell above the clinical cut off (within the severe range). Groups also significantly differed on the TEPS Consummatory subscale, t(80)=2.38, p=.02, with lower ratings of consummatory pleasure reported in the ASD group compared to the TDC group. Lastly, groups significantly differed on the AES, t(77)=6.41, p<.0001, such that the ASD group reported lower levels of apathy compared to the TDC group. Additionally, of the 27 participants who were administered the ToM tasks, 71% of the ASD group compared with 85% of the TDC group correctly
18 Primary Analysis
The omnibus model was a 2 (Group: ASD, TDC) × 3 (Magnitude: Small, Medium, Large) × 3 (Probability: Low, Medium, High) × 2 (Condition: Self, Other) repeated measures ANOVA performed on the percentage of hard task choices. Centrally relevant to hypotheses, this model revealed a significant Condition × Group × Magnitude interaction, F(2,79)=3.79, p=.03, reflecting that groups differed on the influence of Magnitude in the Self relative to the Other condition, as well as a significant Condition × Group interaction, F(1,80)=3.88, p=.05, indicating that groups differed in overall responses for Self and Other.
Additionally, there was a significant Condition × Magnitude × Probability interaction, F(2,79)=3.99, p=.005 and a significant main effect of Condition, F(2,79)=33.25, p<.0001, reflecting a greater percentage of hard task choices in the Self relative to the Other condition across groups. Not surprisingly, there was a significant main effect for Magnitude with higher magnitude levels associated with more hard task choices across groups, F(2,79)=47.83, p<.0001, and a significant main effect for Probability with higher probability levels associated with more hard task choices, F(2,79)=60.25, p<.0001 across groups. All other main effects and interactions were not significant.
19
Small magnitude level, there was a significant trend, t(80)=1.81, p=0.07, with a greater proportion of hard task choices in the ASD group compared to the TDC group (see Figure 2).
Between-group t tests between levels of Probability for Self collapsing across Magnitude revealed no significant group differences at the Low (t(80)=0.13, p=.90) or Medium probabilities (t(80)=0.51, p=.61). At the High probability level, there was significant difference between groups, t(79)=2.04, p=0.04, indicating fewer hard task choices in the ASD group compared to the TDC group (see Figure 3). Between-group t tests between levels of Probability for Other
collapsing across Magnitude revealed no significant group differences at the Medium
(t(80)=0.81, p=.42) or High probabilities (t(80)=0.26, p=.79). At the Low probability level, there was a significant trend, t(80)=1.65, p=0.10, with a greater proportion of hard task choices in the ASD group compared to the TDC group (see Figure 3).
20
task choices at the Medium probability level, t(49)=2.84, p=.007, with more hard task choices for Self compared to Other. Lastly, at the High probability level there was a significant difference between the proportion of hard task choices, t(49)=3.09, p=.003, with more hard task choices for Self compared to Other.
Within-groups t tests for the TDC group compared the proportion of hard task choices across Magnitude levels for Self versus Other (see Figure 2). There was a significant difference between the proportion of hard task choices at the Low magnitude level, t(49)=3.76, p=.0007, indicating more hard task choices for Self compared to Other. There was also a significant difference between the proportion of hard task choices at the Medium magnitude level, t(49)=5.00, p<.0001, with more hard task choices for Self compared to Other. Lastly, at the Large magnitude level there was a significant difference between the proportion of hard task choices, t(49)=2.95, p=.006, with more hard task choices for Self compared to Other. Within-groups t tests for the TDC group comparing the proportion of hard task choices across
Probability levels for Self versus Other (see Figure 3) revealed a significant difference between the proportion of hard task choices at the Low probability level, t(49)=4.91, p<.0001, indicating more hard task choices for Self compared to Other. There was also a significant difference between the proportion of hard task choices at the Medium probability level, t(49)=3.69,
p=.0008, with more hard task choices for Self compared to Other. Lastly, at the High probability level there was a significant difference between the proportion of hard task choices, t(49)=3.64, p=.001, with more hard task choices for Self compared to Other.
21
the Medium magnitude, t(49)=4.75, p<.0001, indicating more hard task choices at the Medium magnitude level. There was also a significant difference between the proportion of hard task choices at the Medium magnitude and the proportion of hard task choices at the Large magnitude, t(49)=3.42, p=.001, with more hard task choices at the Large magnitude level. Within-group t tests in the ASD group comparing the proportion of hard task choices across Probability levels for Self (see Figure 3) revealed a significant difference between the proportion of hard task choices at the Low probability and the proportion of hard task choices at the
Medium probability, t(49)=5.28, p<.0001, indicating more hard task choices at the Medium probability level. There was also a significant difference between the proportion of hard task choices at the Medium probability and the proportion of hard task choices at the High probability, t(49)=2.66, p=.01, with more hard task choices at the High probability level.
Within-group t tests for the ASD group also compared the proportion of hard task choices within Magnitude levels for Other (see Figure 2). There was a significant difference between the proportion of hard task choices at the Small magnitude and the proportion of hard task choices at the Medium magnitude, t(49)=4.86, p<.0001, indicating more hard task choices at the Medium magnitude level. There was no significant difference between the proportion of hard task choices at the Medium magnitude and the proportion of hard task choices at the Large magnitude,
t(49)=0.26, p=.80. Within-group t tests for the ASD group comparing the proportion of hard task choices within Probability levels for Other (see Figure 3) revealed a significant difference
22
of hard task choices at the Medium probability and the proportion of hard task choices at the High probability, t(49)=3.17, p=.003, with more hard task choices at the High probability level.
Within-group t tests for the TDC group also compared the proportion of hard task choices within Magnitude levels for Self (see Figure 2). There was a significant difference between the proportion of hard task choices at the Small magnitude and the proportion of hard task choices at the Medium magnitude, t(31)=5.43, p<.0001, indicating more hard task choices at the Medium magnitude level. There was no significant difference between the proportion of hard task choices at the Medium magnitude and the proportion of hard task choices at the Large magnitude,
t(31)=0.81, p=.42. Within-group t tests for the TDC group comparing the proportion of hard task choices within Probability levels for Self (see Figure 3) revealed a significant difference between the proportion of hard task choices at the Low probability and the proportion of hard task choices at the Medium probability, t(31)=5.25, p<.0001, indicating more hard task choices at the
Medium probability level. There was also a significant difference between the proportion of hard task choices at the Medium probability and the proportion of hard task choices at the High probability, t(31)=4.92, p<.0001, with more hard task choices at the High probability level.
23
for Other (see Figure 3) revealed a significant difference between the proportion of hard task choices at the Low probability and the proportion of hard task choices at the Medium probability, t(31)=5.69, p<.0001, indicating more hard task choices at the Medium probability level. There was also a significant difference between the proportion of hard task choices at the Medium probability and the proportion of hard task choices at the High probability, t(31)=4.11, p=.0003, with more hard task choices at the High probability level.
Correlational Analyses
Correlations explored the relationship between EEfRT performance and ASD symptoms as well as affective and reward sensitivities in the ASD group (see Table 4). Correlations were analyzed separately for reward magnitude and reward probability for the Self and Other conditions.
24
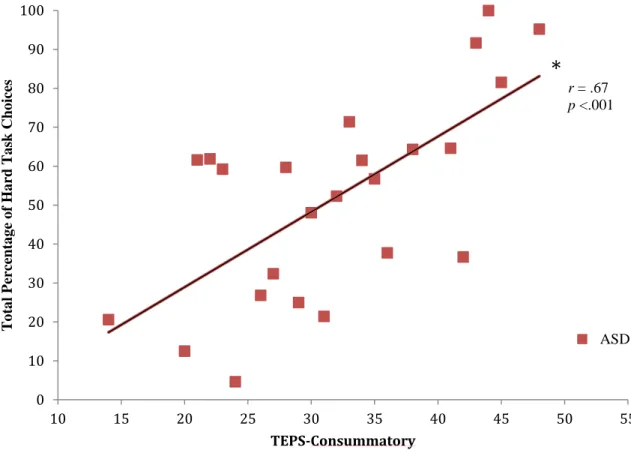
EEfRT Other Condition. The proportion of hard task choices selected for Small, Medium, and Large magnitudes were positively correlated with the TEPS consummatory subscale score (r(50)=.41, p=0.004, r(50)=.43, p=0.002, and r(50)=.39, p=.005, respectively), with increasing levels of consummatory pleasure associated with an increased proportion of hard task selection (see Figure 6). The proportion of hard task choices selected for Low, Medium, and High probability were positively correlated with the TEPS consummatory subscale score (r(50)=.40, p=0.004, r(50)=.382, p=0.007, and r(50)=.41, p=.003, respectively), with increasing levels of consummatory pleasure associated with an increased proportion of hard task selection (see Figure 7). There was also a negative correlation between hard task choices for Medium probability and the BIS, r(50)=-.28, p=.05, with increasing levels of behavioral inhibition associated with a decreased proportion of hard task selection. Lastly, there was a positive relationship between ToM scores and the proportion of hard task choices for Medium probability, r(14)=.54, p=.05, with better ToM performance associated with an increased proportion of hard task selection.
Discussion
25
hypothesized that differences in the proportion of hard task choices would not be accounted for by ToM deficits. Lastly, hypotheses predicted that patterns of effort-based decision-making in the ASD group would predict more severe core autism symptoms and more severe impairments in associated measures of affective functioning and reward sensitivity.
Contrary to hypotheses and to the findings of Damiano et al. (2012) in adults with ASD, in the Self condition, adolescents with ASD did not demonstrate a pattern of overall more hard task choices that were insensitive to reward magnitude and probability. In fact, results suggested more nuanced patterns of relations between magnitude, probability, and effort-based decisions for Self and Others in adolescents with ASD. Specifically, there was a Condition × Group × Magnitude interaction that reflected decreased sensitivity to reward magnitude in the ASD when earning rewards for others. Additionally, the significant Condition × Group interaction suggested that groups differed in responses for Self and Other. More specifically, when working to earn rewards for themselves, adolescents with ASD did not differ in their willingness to expend effort across reward probabilities and magnitudes compared to TDC adolescents; however, when earning rewards for others, the ASD group made significantly more hard task choices relative to the TDC group.
26
with ASD show decreased sensitivity to reward information, specifically reward magnitude, when making choices about working to earn rewards for others. In addition, prior research links altered effort-based decision-making in adults with ASD to differential cost-benefit gradients in the context of monetary rewards (Damiano et al., 2012). Given that the EEfRT was designed to measure motivation for reward based on how much effort is exerted to obtain a reward of a given reward parameter (Treadway et al., 2009), decreased or increased sensitivities to these reward parameters, or atypical cost-benefit gradients, suggests impaired effort-based decision-making. Therefore, it is likely that adolescents with ASD also exhibited differential cost-benefit gradients in the context of monetary rewards but more specifically in the context of rewards for others. Ultimately, this may reflect altered effort-based decision-making, and more broadly, social motivation impairments in adolescents with ASD.
In line with these findings, clinical observations of individuals with ASD also suggest social motivation impairments, as this population often shows heightened motivation for
nonsocial rewards and increased motivation to engage in nonsocial activities. This preference for nonsocial stimuli biases the individual away from social information and interactions and biases them towards nonsocial information (Sasson et al., 2008; Turner-Brown, Lam, Holtzclaw, Dichter & Bodfish, 2011). In the context of effort-expenditure in adolescents with ASD, greater sensitivity to reward parameters and greater willingness to earn rewards for themselves relative to earning rewards for others may be a result of this bias. Additionally, when thinking about altered effort-expenditure for rewards for others in the context of social interactions, this reward processing deficit may contribute to the social difficulties and lower levels of social competency observed in adolescents with ASD (Chevallier, Kohls, et al., 2012; Klin, Jones, Schultz,
27
into social relationships involves not only an understanding of others’ mental states but also an understanding and interest on one’s one role in the relationship, an interest which increases during typical adolescence (Picci & Scherf, 2015). The current findings imply that adolescents with ASD may not understand the benefits of helping another person and the role this plays in developing and maintaining social relationships, resulting in diminished social motivation.
Correlational analyses revealed a positive relationship between the consummatory
pleasure subscale of the TEPS and the proportion of hard task choices across both Self and Other conditions in the ASD group. Specifically, high consummatory pleasure, or enjoyment upon obtaining a reward (“reward liking”), was associated with a greater proportion of hard task choices when earning rewards for themselves. Additionally, adolescents with ASD who had greater levels of consummatory pleasure were more willing to expend effort for rewards that they would not themselves earn. In line with this finding, reward-circuitry hyperactivation has been shown in individuals with ASD during the receipt of nonsocial rewards that are the focus of restricted interests in ASDs (e.g. electronics and trains; Dichter et al., 2012). Therefore, the present findings indicate atypical responses to the receipt of social as well as nonsocial rewards. Limitations
28
(Mandell, Ittenbach, Levy, & Pinto-Martin, 2007). Additionally, the majority of individuals in the ASD group had a least one comorbidity. This design choice resulted in a sample that is representative of how ASD presents in the community (Mazefsky et al., 2012). However, given that results differed when participants with comorbidities were excluded, future studies should further explore the impact of comorbidities on effort-based decision-making in ASD. Moreover, groups did not differ on ToM. Although this is not an unexpected finding (performance on ToM tasks has been shown to differ with age, cognitive ability, and general reasoning skills (Scheeren, de Rosnay, Koot, & Begeer, 2013)), it limited my ability to assess the impact of ToM deficits on effort-based decision-making. Lastly, the present analyses did not correct for multiple
comparisons in order to more fully explore patterns in the data. As such, results should be interpreted with caution until replicated.
Developmental Considerations
Findings from this study provide support for adolescence as a period when altered effort-based decision-making, particularly in the context of earning rewards for others, is observed in ASD. While typical adolescents tend to show elevated valuation of and heightened behavioral and neural responses to social stimuli and peer interactions as well as increases in other-oriented thoughts compared to self-oriented thoughts (Blakemore, 2008; Rilling & Sanfey, 2011;
29
deficits and social isolation (Picci & Scherf, 2015). Thus, in the context of the present study, due to heightened social deficits, adolescents with ASD may not see the social benefit of expending effort for another person and as result, may be particularly unmotivated to earn rewards for others. Taken together, the present findings advance this growing body of literature by
suggesting that, for individuals with ASD, adolescence may be an especially vulnerable period of development for which deficits in social motivation differ compared to children and adults. Clinical Implications
Results of this study have clinical implications for adolescents with ASD. Individual differences in social motivation are associated with treatment efficacy in ASD, such that young children with ASD who are passive and less socially motivated are typically less responsive to early behavioral interventions than are children who demonstrate greater social interest and approach behaviors (Koegel & Mentis, 1985; Sherer & Schreibman, 2005). For those who are less socially motivated, successful programs have incorporated the interests of young children with ASD into communication or interpersonal interventions to increase prosocial behavioral (Dunst, Trivette, & Hamby, 2012). Thus, interventions that capitalize on motivation for nonsocial rewards may in fact enhance social motivation in individuals with ASD. However, given that developmental trajectories of reward processing are nuanced for those with ASD as well as those who are typical developing, it is critical for future studies to compare individuals with ASD to TDCs across development in order to better inform treatments. Wolff and Piven (2014) recently highlighted the importance and shortage of longitudinal research in
30
accurately pinpoint critical time periods when reward processing in ASD deviates from trajectories of typical individuals and therefore, when interventions would be particularly effective.
Conclusions
31 Table 1
Mean (and Standard Deviation) scores on demographic and clinical measures for the ASD and
TDC Groups
ASD (n=50) TDC (n=32) p-value
Mean (SD) Mean (SD)
Age 16.02 (2.58) 15.63 (2.95) .53
Verbal IQ (VIQ) 104.10 (17.17) 111.80 (11.42) .02*
Performance IQ (PIQ) 101.10 (16.29) 106.10 (10.70) .09 Full Scale IQ (FSIQ) 102.94 (16.89) 110.38 (11.46) .02*
Male: Female ratio 22:3 9:7 <.01*
ADOS SA 11.17 (3.52) NA
ADOS RRB 3.83 (1.66) NA
Participant Race
African-American 4 6
Caucasian 45 21
Hispanic 1 2
Asian American 0 2
Other 0 1
Note. ADOS SA = Autism Diagnostic Observation Schedule, Social Affect domain; ADOS RRB =
32 Table 2
Assessments administered to different age and diagnostic groups
ASD (8-12) ASD (13-17) ASD (18+) TDC (8-12) TDC (13-17) TDC (18+)
SRS (SR) X X
SRS (CR) X X X X
CDI X X X X
BDI X X
SPSRQ-SR X X
SPSRQ-CR X X X X
TEPS X X X X X X
BIS/BAS X X
C-BIS/BAS
(CR) X X X X
AES (SR) X X
AES (CR) X X X X
PPDS (CR) X X X X
ToM X X X X X X
Note. SRS = Social Responsiveness Scale; CDI = Child Depression Inventory; BDI = Beck Depression
33 Table 3
Mean (and Standard Deviation) scores for the ASD and TDC Groups
ASD TDC P-value
n Mean (SD) Mean (SD)
SRS T-score 82 77.36 (9.49) 49.84 (10.29) <.0001*
CDI 53 51.77 (2.60) 52.91 (2.14) .10
BDI 29 7.89 (6.54) 4.40 (4.95) .15
SPSRQ-Reward 79 31.43 (11.23) 30.70 (8.90) .76
TEPS-Anticipatory 82 42.96 (7.85) 45.84 (6.21) .08 TEPS-Consummatory 82 32.36 (7.75) 36.44 (7.28) .02*
BIS 82 15.00 (2.99) 15.75 (2.27) .23
BAS-Drive 82 9.18 (2.82) 8.78 (2.85) .54
BAS-Fun Seeking 82 8.80 (2.55) 7.91 (1.97) .10
BAS-Reward Responsiveness
82 8.10 (2.52) 7.56 (1.66) .29
AES 79 44.27 (10.13) 57.77 (7.00) <.0001*
34 Table 4
Correlations between the proportion of hard task choices and questionnaire measures in ASD
Variables Proportion Hard Task Choices for Self Proportion Hard Task Choices for Other
Small Med Large 12% 50% 88% Small Med Large 12% 50% 88%
SRS -0.01 0.05 0.07 -0.03 0.09 0.08 -0.02 0.02 -0.02 -0.14 0.07 0.05
CDI -0.01 0.02 0.07 -0.33 0.31 0.24 0.20 0.30 0.16 -0.10 0.33 0.31
BDI -0.17 0.17 -0.35 -0.22 -0.08 -0.15 -0.23 -0.01 0.05 -0.38 0.20 0.16
SPSRQ-R 0.04 -0.18 -0.06 -0.11 -0.22 -0.24 0.02 -0.10 -0.26 -0.20 -0.15 -0.04
TEPS-A 0.10 0.09 0.13 0.20 0.00 0.04 -0.03 -0.06 -0.02 0.05 -0.06 -0.08
TEPS-C 0.35 0.29 0.29 0.32 0.17 0.39 0.41 0.43 0.39 0.40 0.38 0.41
BIS -0.11 -0.36 -0.26 -0.24 -0.22 -0.24 -0.14 -0.26 -0.28 -0.15 -0.28 -0.25
BAS-D 0.09 0.122 0.05 -0.01 0.18 0.13 0.27 0.19 0.17 0.16 0.18 0.24
BAS-F 0.05 -0.01 0.13 0.06 0.08 0.04 0.12 0.11 0.15 0.05 0.10 0.19
BAS–R -0.12 0.04 -0.02 -0.14 0.06 0.00 0.04 0.12 0.09 -0.06 0.12 0.19
AES 0.14 0.13 0.21 0.23 0.08 0.08 0.02 0.20 0.24 0.19 0.14 0.15
ToM 0.48 0.24 0.13 0.33 0.16 0.27 0.31 0.38 0.31 0.28 0.54* 0.11
*p<.05, **p<.01
**
** ** **
** * * **
**
** **
35
Time: 5.67 Choosing
for Self + Ready?
You completed
the task!
You won $2.37
A B C D E F G
36
37
38
Figure 4. Correlations with TEPS-C and Reward Magnitude for Self.
20 30 40 50 60 70 80 90 100
10 15 20 25 30 35 40 45 50 55
T o ta l P er ce nta g e o f H a rd T a sk Cho ices TEPS-Consummatory ASD
*
r = .55
39
Figure 5. Correlations with TEPS-C and Reward Probability for Self.
20 30 40 50 60 70 80 90 100
10 15 20 25 30 35 40 45 50 55
T o ta l P er ce nta g e o f H a rd T a sk Cho ices TEPS-Consummatory ASD
*
r = .5440
Figure 6. Correlations with TEPS-C and Reward Magnitude for Other.
0 10 20 30 40 50 60 70 80 90 100
10 15 20 25 30 35 40 45 50 55
T o ta l P er ce nta g e o f H a rd T a sk Cho ices TEPS-Consummatory ASD
*
r = .67
41
Figure 7. Correlations with TEPS-C and Reward Probability for Other.
0 10 20 30 40 50 60 70 80 90 100
10 15 20 25 30 35 40 45 50 55
T o ta l P er ce nta g e o f H a rd T a sk Cho ices TEPS-Consummatory ASD
*
r = .67
42
APPENDIX: SUPPLEMENTARY ANALYSES Results including IQ as a covariate
The omnibus model was a 2 (Group: ASD, TDC) × 3 (Magnitude: Small, Medium, Large) × 3 (Probability: 12%, 50%, 88%) × 2 (Condition: Self, Other) repeated measures ANCOVA controlling for IQ was performed on the percentage of hard task choices. Centrally relevant to hypotheses, the Condition × Group × Magnitude interaction remained significant, F(2,78)=3.50, p=.04, reflecting that groups differed on the influence of Magnitude in the Self and Other conditions, as well as the significant Condition × Group interaction, F(1,79)=4.91, p=.03, indicating that groups differed in responses for Self and Other. The significant main effect of Condition also remained significant, F(1,79)=4.47, p=.04, reflecting a greater percentage of hard task choices in the Self relative to the Other condition across groups. All other main effects and interactions were not significant.
Results including gender as a covariate
When controlling for gender, results revealed a significant trend for the Condition × Group × Magnitude interaction, F(2,78)=2.64, p=.08, as well as the significant trend for the Condition × Group interaction, F(1,79)=3.09, p=.08. There was still significant main effect of Condition, F(1,79)=8.99, p=.004. In addition, the significant main effects for Magnitude, with higher magnitude levels associated with more hard task choices across groups (F(2,78)=10.88, p<.0001) and Probability, with higher probability levels associated with more hard task choices across groups (F(2,78)=10.94, p<.0001), remained significant. All other main effects and interactions were not significant.
43
When analyses controlled for pubertal development (PPDS Total Score), results revealed that the Condition × Group × Magnitude interaction remained significant, F(2,52)=4.01, p=.02, as well as the significant Magnitude × Group interaction, F(2,52)=3.56, p=.04. There was a significant trend for the main effect of Condition, F(1,53)=3.00, p=.09. All other main effects and interactions were not significant.
Results including ToM as a covariate
When controlling for ToM, results revealed a main effects for Magnitude, F(2,23)=10.79, p=.0005, and a Probability, F(2,23)=6.05, p=.008, remained significant across groups. All other main effects and interactions were not significant.
Results including participants without a comorbid diagnosis
44 REFERENCES
Axelrod, B. N. (2002). Validity of the Wechsler abbreviated scale of intelligence and other very short forms of estimating intellectual functioning. Assessment, 9(1), 17-23.
Baranek, G. T. (1999). Autism during infancy: a retrospective video analysis of sensory-motor and social behaviors at 9-12 months of age. J Autism Dev Disord, 29(3), 213-224. Baron-Cohen, S., Leslie, A. M., & Frith, U. (1985). Does the autistic child have a "theory of
mind"? Cognition, 21(1), 37-46.
Baron-Cohen, S., Wheelwright, S., Hill, J., Raste, Y., & Plumb, I. (2001). The "Reading the Mind in the Eyes" Test revised version: a study with normal adults, and adults with Asperger syndrome or high-functioning autism. J Child Psychol Psychiatry, 42(2), 241-251.
Beck, A. T., & Steer, R. A. (1984). Internal consistencies of the original and revised Beck Depression Inventory. J Clin Psychol, 40(6), 1365-1367.
Blair, C., Peters, R., & Granger, D. (2004). Physiological and neuropsychological correlates of approach/withdrawal tendencies in preschool: further examination of the behavioral inhibition system/behavioral activation system scales for young children. Dev Psychobiol, 45(3), 113-124. doi: 10.1002/dev.20022
Blakemore, S. J. (2008). The social brain in adolescence. Nat Rev Neurosci, 9(4), 267-277. doi: 10.1038/nrn2353
Carver, C. S., & White, T. L. (1994). Behavioral inhibition, behavioral activation, and affective responses to impending reward and punishment: the BIS/BAS scales. J Pers Soc
Psychol, 67(2), 319.
Chevallier, C., Grezes, J., Molesworth, C., Berthoz, S., & Happe, F. (2012). Brief report:
Selective social anhedonia in high functioning autism. J Autism Dev Disord, 42(7), 1504-1509. doi: 10.1007/s10803-011-1364-0
Chevallier, C., Kohls, G., Troiani, V., Brodkin, E. S., & Schultz, R. T. (2012). The social motivation theory of autism. Trends Cogn Sci, 16(4), 231-239. doi:
10.1016/j.tics.2012.02.007
Chevallier, C., Parish-Morris, J., Tonge, N., Le, L., Miller, J., & Schultz, R. T. (2014).
45
without autism in a theory of mind task. J Exp Psychol Gen, 143(3), 972-979. doi: 10.1037/a0035483
Constantino, J. N., Davis, S. A., Todd, R. D., Schindler, M. K., Gross, M. M., Brophy, S. L., . . . Reich, W. (2003). Validation of a brief quantitative measure of autistic traits: comparison of the social responsiveness scale with the autism diagnostic interview-revised. J Autism Dev Disord, 33(4), 427-433.
Damiano, C. R., Aloi, J., Treadway, M., Bodfish, J. W., & Dichter, G. S. (2012). Adults with autism spectrum disorders exhibit decreased sensitivity to reward parameters when making effort-based decisions. J Neurodev Disord, 4(1), 13. doi: 10.1186/1866-1955-4-13
Dawson, G., Bernier, R., & Ring, R. H. (2012). Social attention: a possible early indicator of efficacy in autism clinical trials. J Neurodev Disord, 4(1), 11. doi: 10.1186/1866-1955-4-11
Dawson, G., Toth, K., Abbott, R., Osterling, J., Munson, J., Estes, A., & Liaw, J. (2004). Early social attention impairments in autism: social orienting, joint attention, and attention to distress. Dev Psychol, 40(2), 271-283. doi: 10.1037/0012-1649.40.2.271
De Martino, B., Harrison, N. A., Knafo, S., Bird, G., & Dolan, R. J. (2008). Explaining enhanced logical consistency during decision making in autism. J Neurosci, 28(42), 10746-10750. doi: 10.1523/JNEUROSCI.2895-08.2008
Dichter, G. S., Felder, J. N., Green, S. R., Rittenberg, A. M., Sasson, N. J., & Bodfish, J. W. (2012). Reward circuitry function in autism spectrum disorders. Soc Cogn Affect Neurosci, 7(2), 160-172. doi: 10.1093/scan/nsq095
Dunst, C. J., Trivette, C. M., & Hamby, D. W. (2012). Meta-analysis of studies incorporating the interests of young children with autism spectrum disorders into early intervention
practices. Autism Res Treat, 2012, 462531. doi: 10.1155/2012/462531
Fiorillo, C. D., Tobler, P. N., & Schultz, W. (2003). Discrete coding of reward probability and uncertainty by dopamine neurons. Science, 299(5614), 1898-1902. doi:
10.1126/science.1077349
Gard, D. E., Gard, M. G., Kring, A. M., & John, O. P. (2006). Anticipatory and consummatory components of the experience of pleasure: a scale development study. Journal of Research in Personality, 40(6), 1086-1102.
46
autism spectrum conditions. J Autism Dev Disord, 38(8), 1534-1541. doi: 10.1007/s10803-007-0533-7
Happe, F. G. (1994). An advanced test of theory of mind: understanding of story characters' thoughts and feelings by able autistic, mentally handicapped, and normal children and adults. J Autism Dev Disord, 24(2), 129-154.
Helsel, W. J., & Matson, J. L. (1984). The assessment of depression in children: the internal structure of the Child Depression Inventory (CDI). Behav Res Ther, 22(3), 289-298. Holroyd, S., & Baron-Cohen, S. (1993). Brief report: how far can people with autism go in
developing a theory of mind? J Autism Dev Disord, 23(2), 379-385.
Johnson, S. A., Yechiam, E., Murphy, R. R., Queller, S., & Stout, J. C. (2006). Motivational processes and autonomic responsivity in Asperger's disorder: evidence from the Iowa Gambling Task. J Int Neuropsychol Soc, 12(5), 668-676. doi:
10.1017/S1355617706060802
Jones, W., & Klin, A. (2013). Attention to eyes is present but in decline in 2-6-month-old infants later diagnosed with autism. Nature, 504(7480), 427-431. doi: 10.1038/nature12715
Kaufman, A. S., & Kaufman, N. L. (2004). Kaufman brief intelligence test. John Wiley & Sons, Inc.
Klin, A., Jones, W., Schultz, R., Volkmar, F., & Cohen, D. (2002). Visual fixation patterns during viewing of naturalistic social situations as predictors of social competence in individuals with autism. Arch Gen Psychiatry, 59(9), 809-816.
Koegel, R. L., & Mentis, M. (1985). Motivation in childhood autism: can they or won't they? J Child Psychol Psychiatry, 26(2), 185-191.
Lahaie, A., Mottron, L., Arguin, M., Berthiaume, C., Jemel, B., & Saumier, D. (2006). Face perception in high-functioning autistic adults: evidence for superior processing of face parts, not for a configural face-processing deficit. Neuropsychology, 20(1), 30-41. doi: 10.1037/0894-4105.20.1.30
Leyfer, O. T., Folstein, S. E., Bacalman, S., Davis, N. O., Dinh, E., Morgan, J., . . . Lainhart, J. E. (2006). Comorbid psychiatric disorders in children with autism: interview
development and rates of disorders. J Autism Dev Disord, 36(7), 849-861. doi: 10.1007/s10803-006-0123-0
47
social and communication deficits associated with the spectrum of autism. J Autism Dev Disord, 30(3), 205-223.
Lord C, Rutter M, DiLavore PC, et al. (2012). Autism diagnostic observation schedule, second edition: ADOS-2. Torrance: Western Psychological Services.
Mandell, D. S., Ittenbach, R. F., Levy, S. E., & Pinto-Martin, J. A. (2007). Disparities in diagnoses received prior to a diagnosis of autism spectrum disorder. J Autism Dev Disord, 37(9), 1795-1802. doi: 10.1007/s10803-006-0314-8
Marin, R. S., Biedrzycki, R. C., & Firinciogullari, S. (1991). Reliability and validity of the Apathy Evaluation Scale. Psychiatry Res, 38(2), 143-162.
Mazefsky, C. A., Oswald, D. P., Day, T. N., Eack, S. M., Minshew, N. J., & Lainhart, J. E. (2012). ASD, a psychiatric disorder, or both? Psychiatric diagnoses in adolescents with high-functioning ASD. J Clin Child Adolesc Psychol, 41(4), 516-523. doi:
10.1080/15374416.2012.686102
Mundy, P., Sullivan, L., & Mastergeorge, A. M. (2009). A parallel and distributed-processing model of joint attention, social cognition and autism. Autism Res, 2(1), 2-21. doi: 10.1002/aur.61
Naber, F., Bakermans-Kranenburg, M. J., van Ijzendoorn, M. H., Dietz, C., van Daalen, E., Swinkels, S. H., . . . van Engeland, H. (2008). Joint attention development in toddlers with autism. Eur Child Adolesc Psychiatry, 17(3), 143-152. doi: 10.1007/s00787-007-0648-6
Orsmond, G. I., Krauss, M. W., & Seltzer, M. M. (2004). Peer relationships and social and recreational activities among adolescents and adults with autism. J Autism Dev Disord, 34(3), 245-256.
Petersen, A. C., Crockett, L., Richards, M., & Boxer, A. (1988). A self-report measure of pubertal status: Reliability, validity, and initial norms. J Youth Adolesc, 17(2), 117-133. doi: 10.1007/BF01537962
Peterson, C. C., Slaughter, V., Peterson, J., & Premack, D. (2013). Children with autism can track others' beliefs in a competitive game. Dev Sci, 16(3), 443-450. doi:
10.1111/desc.12040
48
Reddy, L. F., Horan, W. P., Barch, D. M., Buchanan, R. W., Dunayevich, E., Gold, J. M., . . . Green, M. F. (2015). Effort-Based Decision-Making Paradigms for Clinical Trials in Schizophrenia: Part 1-Psychometric Characteristics of 5 Paradigms. Schizophr Bull, 41(5), 1045-1054. doi: 10.1093/schbul/sbv089
Rilling, J. K., & Sanfey, A. G. (2011). The neuroscience of social decision-making. Annu Rev Psychol, 62, 23-48. doi: 10.1146/annurev.psych.121208.131647
Salamone, J. D. (2006). Will the last person who uses the term 'reward' please turn out the lights? Comments on processes related to reinforcement, learning, motivation and effort. Addict Biol, 11(1), 43-44. doi: 10.1111/j.1369-1600.2006.00011.x
Salamone, J. D., Correa, M., Farrar, A., & Mingote, S. M. (2007). Effort-related functions of nucleus accumbens dopamine and associated forebrain circuits. Psychopharmacology (Berl), 191(3), 461-482. doi: 10.1007/s00213-006-0668-9
Sasson, N. J., & Touchstone, E. W. (2014). Visual attention to competing social and object images by preschool children with autism spectrum disorder. J Autism Dev Disord, 44(3), 584-592. doi: 10.1007/s10803-013-1910-z
Scheeren, A. M., de Rosnay, M., Koot, H. M., & Begeer, S. (2013). Rethinking theory of mind in high-functioning autism spectrum disorder. J Child Psychol Psychiatry, 54(6), 628-635. doi: 10.1111/jcpp.12007
Schultz, W. (2002). Getting formal with dopamine and reward. Neuron, 36(2), 241-263. Sheehan, D. V., Lecrubier, Y., Sheehan, K. H., Amorim, P., Janavs, J., Weiller, E., . . . Dunbar,
G. C. (1998). The Mini-International Neuropsychiatric Interview (M.I.N.I.): the
development and validation of a structured diagnostic psychiatric interview for DSM-IV and ICD-10. J Clin Psychiatry, 59 Suppl 20, 22-33;quiz 34-57.
Sheehan, D. V., Sheehan, K. H., Shytle, R. D., Janavs, J., Bannon, Y., Rogers, J. E., . . .
Wilkinson, B. (2010). Reliability and validity of the Mini International Neuropsychiatric Interview for Children and Adolescents (MINI-KID). J Clin Psychiatry, 71(3), 313-326. doi: 10.4088/JCP.09m05305whi
Sherer, M. R., & Schreibman, L. (2005). Individual behavioral profiles and predictors of
treatment effectiveness for children with autism. J Consult Clin Psychol, 73(3), 525-538. doi: 10.1037/0022-006X.73.3.525
49
Somerville, L. H., Jones, R. M., & Casey, B. J. (2010). A time of change: behavioral and neural correlates of adolescent sensitivity to appetitive and aversive environmental cues. Brain Cogn, 72(1), 124-133. doi: 10.1016/j.bandc.2009.07.003
Surian, L., & Leslie, A. M. (1999). Competence and performance in false belief understanding: A comparison of autistic and normal 3‐year‐old children. British Journal of
Developmental Psychology, 17(1), 141-155
Tager-Flusberg, H., & Sullivan, K. (1994). A second look at second-order belief attribution in autism. J Autism Dev Disord, 24(5), 577-586.
Torrubia, R., Avila, C., Moltó, J., & Caseras, X. (2001). The sensitivity to punishment and sensitivity to reward questionnaire (SPSRQ) as a measure of gray's anxiety and impulsivity dimensions. Pers Indiv Dif, 31(6), 837-862.
Treadway, M. T., Bossaller, N. A., Shelton, R. C., & Zald, D. H. (2012). Effort-based decision-making in major depressive disorder: a translational model of motivational anhedonia. J Abnorm Psychol, 121(3), 553-558. doi: 10.1037/a0028813
Treadway, M. T., Buckholtz, J. W., Schwartzman, A. N., Lambert, W. E., & Zald, D. H. (2009). Worth the 'EEfRT'? The effort expenditure for rewards task as an objective measure of motivation and anhedonia. PLoS One, 4(8), e6598. doi: 10.1371/journal.pone.0006598 Treadway, M. T., & Zald, D. H. (2011). Reconsidering anhedonia in depression: lessons from
translational neuroscience. Neurosci Biobehav Rev, 35(3), 537-555. doi: 10.1016/j.neubiorev.2010.06.006
Wang, A. T., Dapretto, M., Hariri, A. R., Sigman, M., & Bookheimer, S. Y. (2004). Neural correlates of facial affect processing in children and adolescents with autism spectrum disorder. J Am Acad Child Adolesc Psychiatry, 43(4), 481-490. doi: 10.1097/00004583-200404000-00015
Wardle, M. C., Treadway, M. T., Mayo, L. M., Zald, D. H., & de Wit, H. (2011). Amping up effort: effects of d-amphetamine on human effort-based decision-making. J Neurosci, 31(46), 16597-16602. doi: 10.1523/JNEUROSCI.4387-11.2011
Werner, E., Dawson, G., Osterling, J., & Dinno, N. (2000). Brief report: Recognition of autism spectrum disorder before one year of age: a retrospective study based on home
50
White, S., Hill, E., Happe, F., & Frith, U. (2009). Revisiting the strange stories: revealing mentalizing impairments in autism. Child Dev, 80(4), 1097-1117. doi: 10.1111/j.1467-8624.2009.01319.x
Wolff, J. J., & Piven, J. (2014). Neurodevelopmental disorders: Accelerating progress in autism through developmental research. Nat Rev Neurol, 10(8), 431-432. doi: