THE AIRWAY MICROBIOME AFTER BURN AND INHALATION INJURY
Dana M. Walsh
A dissertation submitted to the faculty at the University of North Carolina at Chapel Hill in partial fulfillment of the requirements for the degree of Doctor of Philosophy in the
Curriculum in Toxicology in the School of Medicine.
Chapel Hill 2016
Approved by: Scott H. Randell
Marianne S. Muhlebach Peggy A. Cotter
Ilona Jaspers
ABSTRACT
Dana M. Walsh: The Airway Microbiome After Burn and Inhalation Injury (Under the direction of David Diaz-Sanchez and Ilona Jaspers)
The human microbiome is composed of the entirety of microorganisms living on and in the human body along with their genetic material. Recent work has demonstrated the importance of these bacterial communities, or microbiota, in health and disease, including in the airways. Though the airways contain mechanisms to clear bacteria, disruption of homeostasis by illness and injury can induce conditions favorable to bacterial colonization and growth. Inhalation injury endured by burn victims disrupts homeostasis by damaging the airway epithelium and inhibiting innate immune responses, increasing the risk of acute respiratory distress syndrome (ARDS), infection, and
low-abundance bacteria as well as significant enrichment of Prevotella melaninogenica
ACKNOWLEDGEMENTS
I owe many thanks to many people for completion of this dissertation. First, to the University of North Carolina at Chapel Hill for accepting me into an excellent biomedical graduate program. To my mentors, Drs. David Diaz-Sanchez and Ilona Jaspers, for their continuous support and guidance. To postdoctoral researchers who have helped me with the details of this project, including Drs. Janelle Arthur, Jaime Mirowksy, Shaun
TABLE OF CONTENTS
LIST OF TABLES ... xii
LIST OF FIGURES ... xiv
LIST OF ABBREVIATIONS ... xix
CHAPTER 1: THE HUMAN MICROBIOME AND ANALYSIS STRATEGIES...1
1.1 Introduction to The Human Microbiome ...1
1.1.1 The Human Microbiome Project ...2
1.1.2 Healthy Microbiome Composition and Function ...4
1.1.3 Role of the Microbiome in Immune System Development and Education ...8
1.1.4 The Diseased and Injured Microbiome ...10
1.2 Review of Strategies for Investigating the Microbiome ...14
1.2.1 Experimental Models ...15
1.2.1.1 Human Studies ...16
1.2.1.2 In Vivo Animal Models ...17
1.2.1.3 In Vitro and Ex Vivo Systems ...22
1.2.2 Sequencing Strategies and Technology ...25
1.2.2.2 Microbiome Sequencing
Methods...29
1.2.2.2.1 16S rRNA Gene Amplicon Sequencing ...30
1.2.2.2.2 Whole Genome Sequencing ...32
1.2.3 Data Analysis ...33
1.2.3.1 Analysis Pipelines ...34
1.2.3.2 Statistical Analysis of Compositional Data ...39
CHAPTER 2: BURN AND INHALATION INJURY AND ITS RELATION TO THE AIRWAY MICROBIOME ...46
2.1 The Airway Microbiome ...46
2.2 Burn and Inhalation Injury ...59
2.3 Toxic Effects of Smoke Exposure ...62
2.4 Immune Response and Infection Risk ...64
CHAPTER 3: OPTIMIZATION OF DNA EXTRACTION AND SEQUENCING METHODS ...67
3.1 Patient Population ...67
3.2 Challenges in Extraction of Bacterial DNA From Bronchial Washings of Burn Victims ...70
3.3 DNA Extraction Methods ...72
3.4 DNA Quantification Methods ...80
3.5 Molecule Tagging Method ...85
CHAPTER 4: ALTERATIONS IN AIRWAY MICROBIOTA IN PATIENTS WITH LOW P/F RATIOS AFTER BURN AND INHALATION INJURY ...89
4.2 Methods...91
4.2.1 Patients and Sample Collection ...91
4.2.2 DNA Extraction and Sequencing ...92
4.2.3 Sequencing Data and Statistical Analysis ...93
4.3 Results ...95
4.3.1 Patients ...95
4.3.2 The Airway Microbiota Among All Patients ...96
4.3.3 Enrichment of Low-Abundance OTUs Among Patients with PaO2/FiO2 ≤ 300 ...97
4.3.4 Alpha Diversity Among Patients with and without PaO2/FiO2 ≤ 300 ...100
4.3.5 Significant Enrichment of Specific OTUs Among Patients with PaO2/FiO2 ≤ 300 ...101
4.4 Discussion ...104
CHAPTER 5: PREDICTION OF BACTERIAL TAXA ASSOCIATED WITH PAO2/FIO2 ≤ 300 AFTER BURN AND INHALATION INJURY ...117
5.1 Introduction ...117
5.1.1 Unsupervised Clustering Methods Reveal Data Structure ...118
5.1.2 Machine Learning Algorithms Predict Outcomes ...121
5.1.3 Application of Supervised and Unsupervised Methods to Burn Patient Airway Microbiota ...129
5.2 Methods...130
5.2.1 Patient Samples and Sequencing ...130
5.2.3 Supervised Random Forest Predictions ...131
5.3 Results ...133
5.3.1 Clustering Trends ...133
5.3.2 Random Forest Analysis ...140
5.4 Discussion ...143
CHAPTER 6: PREDICTION OF FUNCTIONAL CHANGES AMONG BACTERIAL NETWORKS IN PATIENTS WITH PAO2/FIO2 ≤ 300 ...152
6.1 Introduction ...152
6.2 Methods...155
6.2.1 Patient Samples ...155
6.2.2 DNA Extraction and Sequencing ...156
6.2.3 Application of SparCC to Burn Patient Microbiome Data ...156
6.2.4 Predicted Functional Gene Content of the Airway Microbiome ...160
6.2.5 Use of Machine Learning to Predict Functions Associated with Networks ...160
6.3 Results ...161
6.3.1 OTU Networks Among Patients ...161
6.3.2 Highly Represented Predicted Gene Functions ...166
6.3.3 Random Forest Prediction of Functions Representative of Network Communities ...177
CHAPTER 7: ADDITIONAL STUDIES: ALTERATION OF BRONCHIAL EPITHELIAL CELL RESPONSE TO
WOOD SMOKE PARTICLES BY BACTERIA ...193
7.1 Introduction ...193
7.2 Methods...194
7.2.1 Primary Human Bronchial Airway Epithelial Cells ...194
7.2.2 Air Liquid Interface and Exposures ...194
7.2.3 Bacterial Strains and Culture Conditions ...195
7.2.4 Wood Smoke Particle Generation and Composition ...195
7.2.5 Cytotoxicity Assay ...196
7.2.6 Transepithelial Electrical Resistance ...196
7.2.7 Oxidative Stress Response and Pro-Inflammatory Gene Expression ...197
7.3 Results ...197
7.3.1 Post-Exposure Cytotoxicity ...197
7.3.2 TEER During Cellular Differentiation ...200
7.3.3 Induction and Attenuation of Oxidative Stress Response By WSP and Bacteria ...202
7.3.4 Induction of Inflammatory Response by WSP and Bacteria ...203
7.4 Discussion ...204
CHAPTER 8: CONCLUSIONS AND FUTURE DIRECTIONS ...214
8.1 Summary ...214
8.2.1 Continuing Studies ...220
8.2.2 Mouse Models ...222
8.2.3 Predictive Modeling ...223
8.3 Conclusion ...224
APPENDIX 1: DNA EXTRACTION PROTOCOL ...226
APPENDIX 2: CHAPTER 4 R CODE ...228
APPENDIX 3: CHAPTER 5 R CODE ...241
APPENDIX 4: CHAPTER 6 R CODE ...252
LIST OF TABLES Table 1.1: Body Locations of Sampling for the
Healthy Human Microbiome ...5 Table 1.2: Comparison of Sequencing
Technology Used in Microbiome Studies ...28 Table 2.1: Sampling, Extraction, and
Sequencing Methods Among Lung
Microbiome Studies ...51 Table 3.1: Patient Demographics and
Clinical Data Collected ...68 Table 3.2: DNA Quantity and Quality
after Phenol:Chloroform:Isoamyl
Alcohol Extraction Prior to DTT Treatment ...75 Table 3.3: Percent of Total Sequences and
Molecule Tags for Human (16HBE),
Staphylococcus aureus (SAUR) and Reagent
(CNTRL) Controls ...88 Table 4.1: Clinical Variables ...96 Table 4.2: Taxa Detected in 80% of Patients
with PaO2/FiO2 > 300 ...100 Table 4.3: Taxa Detected in 80% of Patients
with PaO2/FiO2 ≤ 300 ...100 Table 4.4: OTU Level Significant Differences
in Abundance as Determined by Wilcoxon
Rank-Sum Test ...102 Table 4.5: OTU Level Significant Differences
in Detection as Determined by the
Two-Proportions Test ...103 Table 4.6: Clinical Cultures ...113 Table 5.1: Average Value per Cluster Assignment ...141 Table 6.1: OTU Overlap within PaO2/FiO2 ≤ 300 and
Table 6.2: PaO2/FiO2 ≤ 300 Communities Predicted Function
Summary ...175 Table 6.3: PaO2/FiO2 > 300 Communities Predicted Function
Summary ...176 Table 6.4: OTUs Containing the Most Important
Predicted Function Among PaO2/FiO2 ≤ 300 Communities ...179 Table 6.5: OTUs Containing the Most Important
LIST OF FIGURES Figure 1.1: Microbiome Experimental and
Sequencing Methods ...3 Figure 1.2: The Bacterial 16S rRNA Gene ...30 Figure 2.1: Dysbiosis in the Diseased Airway
Microbiome ...48 Figure 3.1: B. subtilis Gram Stain after
SDS and Lysozyme Treatment ...73 Figure 3.2: B. subtilis Gram Stain
without SDS or Lysozyme Treatment ...74 Figure 3.3: Quantity of Extracted DNA ...76 Figure 3.4: Quality of Extracted DNA ...76 Figure 3.5: Quantity of Human and
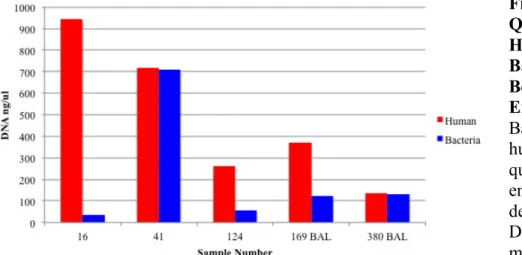
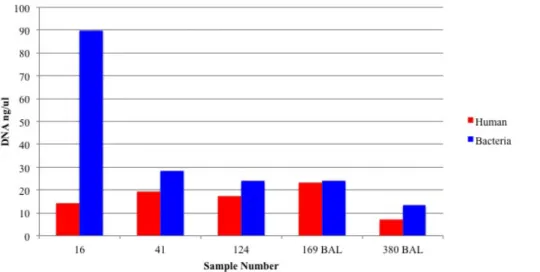
Bacterial DNA Before Enrichment ...77 Figure 3.6: Quantity of Human and
Bacterial DNA After Enrichment ...78 Figure 3.7: Enrichment Does Not
Alter Bacterial Community Composition
After 16S rRNA Gene Amplicon Sequencing ...79 Figure 3.8: Non-Human DNA in Burn
Patient Bronchial Washings ...80 Figure 3.9: Detection of Bacterial DNA
with Universal Primers ...82 Figure 3.10: Detection of Bacterial DNA
with MTFS Sequencing Primers ...83 Figure 3.11: Quantification of Bacterial
DNA in Healthy Lower Airways ...85 Figure 3.12: Sequencing Library Creation
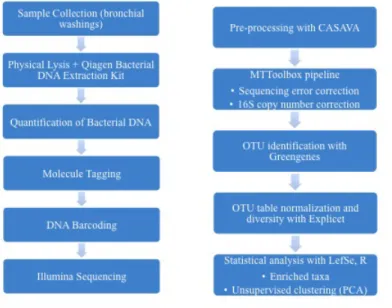
Figure 3.13: From Sample Collection to
Data Analysis ...87
Figure 3.14: Family Level OTUs Detected Among Human (16HBE), Staphylococcus aureus (SAUR), and Reagent (CNTRL) DNA Controls ...88
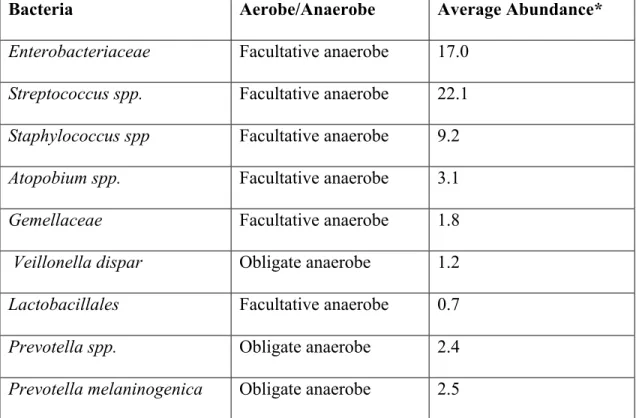
Figure 4.1: Unique Facultative Anaerobic OTUs are Significantly Enriched Among All Patients ...95
Figure 4.2: The Airway Microbiota Among Patients with PaO2/FiO2 > 300 ...98
Figure 4.3: The Airway Microbiota Among Patients with PaO2/FiO2 ≤ 300 ...99
Figure 4.4: Average Chao1 Diversity Index of Patients with and without PaO2/FiO2 ≤ 300 ...101
Figure 4.5: Specific Bacterial Taxa are Enriched Among Patients with PaO2/FiO2 ≤ 300 ...103
Figure 4.6: Percent Abundance Increase in OTUs with Significant Differences Detected by LEfSe ...104
Figure 4.7: Streptococcaceae Family Members are Enriched in Patients with PaO2/FiO2 ≤ 300 ...107
Figure 4.8: Antibiotic Treatment Alters the Microbiome but Does Not Impact Association of the Prevotella melaninogenica OTU with PaO2/FiO2 ≤ 300 ...110
Figure 4.9: Average Unique OTUs Identified as Facultative or Strict Anaerobes and Aerobes Among Patients with and without PaO2/FiO2 ≤ 300 ...112
Figure 5.1: The Maximal Margin Classifier ...122
Figure 5.2: Neural Networks ...124
Figure 5.4: Random Forests ...127 Figure 5.5: Sparse, Non-negative PCA
Colored by Patient ALI Status ...132 Figure 5.6: Cluster Assignments as
Determined by Hierarchical Clustering ...133 Figure 5.7: Cluster Assignments as
Determined by K-means Clustering ...134 Figure 5.8: Hierarchical Clustering Dendrogram ...136 Figure 5.9: Hierarchical Clustering-Based Heatmap
of Abundance Data ...137 Figure 5.10: K-Means Clustering-Based Heatmap
of Abundance Data ...138 Figure 5.11: DAPC Identifies Three Clusters ...139 Figure 5.12: RF Analysis Identifies BMI as
Most Predictive of Sample Clustering by DAPC ...141 Figure 5.13: RF Analysis Identifies the
Streptococcaceae Family as Most Predictive
of PaO2/FiO2 ≤ 300 ...142 Figure 6.1. NMI Between Adjacent Threshold
Points in the PaO2/FiO2 ≤ 300 Network ...156 Figure 6.2. NMI Between Adjacent Threshold
Points in the PaO2/FiO2 > 300 Network ...157 Figure 6.3: Number of Communities vs.
Threshold for the PaO2/FiO2 ≤ 300 Network ...158 Figure 6.4: Number of Communities vs.
Threshold for the PaO2/FiO2 > 300 Network ...158 Figure 6.5: PaO2/FiO2 ≤ 300 Community Clusters
Identified by SparCC ...161 Figure 6.6: PaO2/FiO2 > 300 Community Clusters
Figure 6.7: PaO2/FiO2 ≤ 300 Communities Abundance
Heatmap ...164
Figure 6.8: PaO2/FiO2 > 300 Communities Abundance Heatmap ...165
Figure 6.9: Community 1 Predicted Functions ...167
Figure 6.10: Community 2 Predicted Functions ...168
Figure 6.11: Community 3 Predicted Functions ...169
Figure 6.12: Community 4 Predicted Functions ...170
Figure 6.13: Community A Predicted Functions ...171
Figure 6.14: Community B Predicted Functions ...172
Figure 6.15: Community C Predicted Functions ...173
Figure 6.16: Community D Predicted Functions ...174
Figure 6.17: Predicted Functions Ranked by Importance in Determining the SparCC Community Assignments in the PaO2/FiO2 ≤ 300 Network ...178
Figure 6.18: Predicted Functions Ranked by Importance in Determining the SparCC Community Assignments in the PaO2/FiO2 > 300 Network ...179
Figure 7.1: K. pneumoniae-Induced Cytotoxicity ...197
Figure 7.2: WSP-Induced Cytotoxicity ...198
Figure 7.3: WSP Alone and WSP with K. pneumoniae Cytotoxicity ...199
Figure 7.4: Changes in TEER During HBEC Differentiation ...200
Figure 7.5: Disruption of Epithelial Integrity by K. pneumonia ...201
Figure 7.7: K. pneumoniae Increases IL-8
LIST OF ABBREVIATIONS
ABX Antibiotics ALI Acute lung injury ALIF Air-liquid interface ANOVA Analysis of variance
ARDS Acute respiratory distress syndrome ATP Adenosine triphosphate
AUC Area under the curve BAL Bronchoalveolar lavage BALF Bronchoalveolar lavage fluid BMI Body mass index
BV Bacterial vaginosis
CARS Compensatory anti-inflammatory response syndrome cDNA Complementary deoxyribonucleic acid
CF Cystic fibrosis
COHb Carboxyhaemoglobin CONV Conventionalized
COPD Chronic obstructive pulmonary disease DA Discriminant analysis
DAPC Discriminant analysis of principle components DNA Deoxyribonucleic acid
dNTP Deoxynucleotide FBS Fetal bovine serum
FiO2 Fraction of inspired oxygen FMT Fecal microbiota transplantation
GF Germ-free
GSTM1 Glutathione S-transferase Mu 1 HBEC Human bronchial epithelial cells HCl Hydrochloric acid
HIV-1 Human immunodeficiency virus-1 HMGB-1 High mobility group box 1 protein HMP Human Microbiome Project HO-1 Heme oxygenase-1
HSP-70 Heat shock protein 70 HuMiX Human-microbial crosstalk IBD Irritable bowel disease IgG Immunoglobulin G II Inhalation injury
IL-1Ra Interleukin-1 receptor antagonist IL-8 Interleukin-8
KEGG Kyoto Encyclopedia of Genes and Genomes LEfSe Linear discriminant analysis effect size mL Milliliter
mRNA Messenger ribonucleic acid MT Molecule tag
MTFS Molecule tagging frame shifting NGS Next-generation sequencing NIH National Institutes of Health NMI Normalized mutual information
Nrf2 Nuclear factor erythroid 2-related factor 2
NSPCA Non-negative, sparse principle components analysis PAH Polycyclic aromatic hydrocarbon
PaO2 Partial pressure of arterial oxygen PCA Principle components analysis PC Principle component
PCI Phenol:chloroform:isoamyl alcohol PCR Polymerase chain reaction
PICRUSt Phylogenetic investigation of communities by reconstruction of unobserved states
PRR Pattern recognition receptor
RF Random forest
ROS Reactive oxygen species SCFA Short chain fatty acid
SFB Segmented filamentous bacteria
SHIME Simulator of the Human Intestinal Microbial Ecosystem SIRS Systemic inflammatory response syndrome
SparCC Sparse Correlation for Compositional Data SPIEC-
EASI Sparse Inverse Covariance Estimation for Ecological Association Inference SVM Support vector machine
TBSA Total body surface area TLR Toll-like receptor
TNF-α Tumor necrosis factor alpha UniProt Universal Protein Resource
VAMPS Visualization of Microbial Population Structures VEC Vaginal epithelial cells
CHAPTER 1: THE HUMAN MICROBIOME AND ANALYSIS STRATEGIES
1.1 Introduction to The Human Microbiome
Advances in sequencing technology have revolutionized the study of
microorganisms living on and within the human body. Populations of bacteria can now be identified en masse without first knowing each individual’s unique metabolic
between individuals and within body locations, but metabolic functions remain relatively stable, indicating similarity in function among healthy people [8]. In the gut, which maintains the largest population of bacteria within the human body, the microbiota play key roles in education of the developing immune system, extraction of nutrients from dietary fiber, metabolism of xenobiotic compounds, and production of small molecules that influence distant organ systems [9–14]. A growing body of work on the microbiota in other body locations implies parallels as well as distinctions in their composition and function in comparison to the gut. Whereas increased diversity is generally associated with improved health outcomes in the gut, this is associated with poor outcomes in the vagina [15]. Conversely, in the nasal and oral microbiome, loss of diversity is seen in conjuncture with increased severity of diseases such as chronic rhinosinusitis and periodontal disease [16,17]. Regardless of body location, development of disease alters the microbiota, their functions, and their relationship with the host. Understanding this relationship requires advancement in experimental, computational, and statistical techniques, which together contain exciting potential for advances in preventative and individualized medicine.
1.1.1 The Human Microbiome Project
present and their functions [18]. The HMP is effectively an extension of the Human Genome Project in its mission to identify bacterial genes and functions that contribute to human health outcomes. Unlike the Human Genome Project, the HMP faced the
challenge of analyzing multiple genomes from multiple bacterial species, many of which cannot be cultured [19]. This required deep, whole-genome sequencing of selected individual bacteria to develop reference genomes as well as other sequencing methods, specifically 16S rRNA gene sequencing, that are capable of detecting and identifying
outcomes, the HMP recognized the need to characterize the healthy microbiome and its associated functions from a wide range of individuals in order to assess the impact of disease-induced change. The project has so far generated publicly available clinical specimens, reference genomes, sequencing and annotation protocols, and other
collection, extraction, and analysis methods [20]. A paper published in 2012 details the standardized protocols established for collection, sequencing, and analysis of 5,298 samples from 15 or 18 body sites in 242 healthy individuals [20]. Bacterial 16S ribosomal gene amplicon sequencing was used on all samples and a subset was sequenced using whole-genome techniques [20]. Because suitable 16S rRNA gene sequencing methods did not exist at the start of the project, the HMP was instrumental in developing a standardized way to analyze 16S rRNA gene data for future studies.
Further, the project has resulted in the development of analysis tools and statistical methods specific to microbiome data, which is key to fully understanding the implications of the results.
1.1.2 Healthy Microbiome Composition and Function
Since initiation of the HMP, microbiome research has increased exponentially. Studies are encompassing a growing number of body locations, disease states, and environmental exposures as researchers recognize the far-flung impacts of these bacterial communities. Results from the HMP provide a starting point in understanding bacterial community membership and function in healthy individuals from a broad range of
healthy status, and submitted either 15 (for men) or 18 (for women) samples from body locations listed in Table 1.1.
Body Site Specific Location
Oral cavity Attached keratinized gingiva Buccal mucosa
Hard palate Palatine tonsils Saliva
Subgingival plaque Supragingival plaque Throat
Tongue dorsum Nasal cavity Anterior nares
Skin Left & right antecubital fossa Left & right retroauricular crease Gastrointestinal tract Stool
Urogenital tract Mid vagina Posterior fornix Vaginal introitus
Table 1.1: Body Locations of Sampling for the Healthy Human Microbiome.
saliva microbiota displayed high alpha diversity but low beta diversity, indicating bacterial communities rich in bacterial taxa that were similar among individuals [8].
One of the goals of the HMP was to determine whether a core microbiome exists among healthy individuals [7]. Bacterial taxa that are core to a community are
consistently present among two or more individuals or habitats [21–23]. In the strictest definition, the core taxa must be present among all the communities in a group [21]. However, other studies have used membership among 95% of individuals to as few as 50% [23–25]. Identification of a core microbiome is complicated by the level of taxonomic specificity as well as sub-populations of people and environments [22]. It is easier to define core taxa at the phylum level than it is at the species level, since there is wide variation in species carriage among healthy individuals [8]. Various subject
Despite differences in taxonomic composition among individuals, the HMP found relative stability among the functions of microbial communities inhabiting specific body sites in healthy individuals [8]. Common metabolic pathways, such as the components necessary for translation, ATP synthesis, and glycolysis, were consistently represented among healthy subjects [8]. This underscores the idea that microbial community function may be more important in understanding health outcomes than composition. Although common metabolic pathways could be correlated with subject metadata through multivariate statistical analysis, this does not explore the impact of less abundant functions, such as those associated with pathogenesis [8].
The HMP was an enormous undertaking and provided many tools previously lacking in the microbiome field, including standardized protocols, new bioinformatics methods, and an understanding of the healthy microbiome in various body sites.
However, much work remains to be done to fully understand the breadth and depth of the healthy human microbiome. Some major limitations of the HMP data set are its
genetics can shape the microbiome to influence microbial growth and metabolism and host phenotype [33,34]. For example, several taxa were identified as heritable among monozygotic twin pairs, with Christensenellaceae being the most heritable and demonstrating the ability to reduce obesity when introduced to germ-free mice in the company of obesity-associated taxa [33]. Further, specific microRNA produced by human intestinal epithelial cells have been shown to regulate bacterial gene transcripts and modulate bacteria growth [34]. Clearly, there is a complex interaction among the microbiota, host, and environment, which we have yet to completely understand. Though the HMP’s work was pioneering, there remains a need to expand it to take into account a more diverse range of subjects and incorporate a rich set of metadata in order to more completely define the healthy human microbiome.
1.1.3 Role of the Microbiome in Immune System Development and Education
Recent studies have revealed the key roles microbiota play both in the
development and function of the host immune system, and how dysbiosis, or perturbation of the communities, contributes to disease [16,35–38]. Millions of years of co-evolution has resulted in finely balanced cross-talk that allows the host to shape microbial
and drug treatments, and environmental exposures, may predispose infants to
inflammatory, allergic, and other diseases later in life [14,42]. Germ-free (GF) mice, which are born in a sterile environment and deprived of microbial interactions, display stunted immune maturation and impaired responses to pathogenic bacteria, demonstrating the importance of commensal microbes in development of a functional immune system [39]. Large-scale studies with human children show reduced risk of allergies if they grow up in a farm environment, suggesting that early exposure in life to diverse microbes aids in educating the immune system to respond appropriately to foreign antigens [43]. This is incorporated in the hygiene hypothesis, which encompasses the idea that modern-day sterility reduces early-life exposure to microbes to a degree that results in poor
development of immunity and increases the risk of allergic disease [44]. Inflammation in the absence of microbiota, which is ameliorated by introduction of innocuous bacterial products, supports this hypothesis from a microbiome perspective [42]. This work shows that early life microbial exposures are important to appropriate immune development and function later in life.
In an appropriately educated immune environment, microbiota play key roles in regulation of inflammation and prevention of infection. In the intestine, a loss in
microbial diversity or perturbation of the community predisposes the gut to infection, highlighting the importance of commensal species in limiting pathogen growth and stimulating immune response [39]. Treatment of mice with antibiotics impairs adequate innate and adaptive immune responses to viral infection, reducing clearance of the virus [45]. In the healthy microbiome, segmented filamentous bacteria (SFB) drive
rodentium [39]. In the nasal microbiome, the commensal bacteria Lactobacillus murinus
is less effective in stimulating CD4+ T cells than the pathogen Streptococcus pyogenes
and does not induce disease [46]. This demonstrates the immune system’s ability to differentiate between commensal and pathogenic organisms and elicit appropriate responses. The immune system can also differentiate between the commensal and pathogenic potential of the same organism depending on its location in the body. If staphylococcal species within the skin microbiome are present below the dermis, an inflammatory response is invoked [10]. If they are instead on the epidermal surface, no inflammation is produced due to inhibition of Toll-like receptor 3 (TLR3) signaling of keratinocytes by staphylococcal lipoteichoic acid [10]. These studies imply that interactions between microbiota and the immune system are finely tuned to maintain homeostasis and their disruption can lead to inflammation and infection. Ongoing work continues to explore these interactions and how they might be manipulated to prevent and/or treat disease.
1.1.4 The Diseased and Injured Microbiome
At the coarsest level, more than 90% of phylotypes (sequences with >97% similarity; also known as operational taxonomic units or OTUs) in the healthy gut belong to one of two phyla; either the Bacteroidetes or the Firmicutes [47]. The phyla Proteobacteria, Actinobacteria, Fusobacteria, and Verrucomicrobia have also been consistently detected in the gut at lower abundance [23,47]. In the presence of IBD, the abundance of
Actinobacteria and Proteobacteria increase, Bacteroidetes decrease, and these changes are accompanied by a loss of bacterial diversity [47]. In colorectal cancer, Fusobacteria and Proteobacteria increase while overall diversity decreases [48]. Patients with type two diabetes display a loss of bacteria in the Firmicutes phylum with an increase in Betaproteobacteria [49]. Fewer studies on the role of the gut microbiome in allergies exist, but a study of infants showed increases in anaerobes and lactobacilli and decreases in bifidobacteria and enterobacteria [42]. Finally, obesity is known to induce shifts in the gut microbiome, with specific increases in Actinobacteria and Bacteroidetes accompanied by an overall loss of diversity as compared to lean individuals [50]. Though these
disparate diseases show alteration in different bacterial phyla, they all display a loss in diversity among the gut microbial communities. This has been a consistent finding
among other gut microbiome studies as well, leading to the general acceptance of the idea that a loss of microbial diversity is associated with poor health outcomes.
Supplementation with additional bacteria, such as in probiotics or fecal microbiome transplants, is a possible therapeutic intervention to ameliorate the effects of these gut diseases.
outgrowth of a single, low-abundance bacterium, Poryphyromonas gingivalis, is known to induce periodontitis [17]. Periodontitis is a polymicrobial disease characterized by inflammation and bone loss [17]. P. gingivalis was shown to induce periodontitis through the complement pathway only in the presence of other commensal microbiota, despite it being a low-abundance organism [17]. Outgrowth of P. gingivalis and development of periodontitis was accompanied by a loss of oral microbiome diversity [17]. In a similar manner, Corynebacterium tuberculostearicum mediated severity of chronic rhinosinusitis in the nasal microbiome [16]. Here, C. tuberculostearicum was enriched in the presence of decreased nasal microbiome diversity but could be inhibited by Lactobacillus sakeii
[16]. These studies not only confirm the association between loss of diversity and poor outcomes, but also demonstrate the ability of single, low-abundance species to mediate disease. Interventions aimed at controlling the growth of these specific bacteria, possibly through other microbiota known to inhibit their growth, could prove effective in
managing and preventing disease.
The vaginal microbiome is one of the few known body locations in which low diversity is associated with better health outcomes. In healthy, non-pregnant women, the vaginal microbiome has low alpha diversity and is dominated by one or two of the following Lactobacillus species; L. crispatus, L. gasseri, L. iners, or L. jensenii [41]. Its composition fluctuates with changes in age, hormones, infection, and sexual behavior [41]. During bacterial vaginosis (BV), vaginal microbiome diversity increases, which indicates poor health outcomes for this body site [51]. In contrast, the vaginal
placental microbiome. In preterm births, the vaginal microbiome displays a decrease in the abundance of lactobacilli with a dominance of the Prevotella and Peptoniphilus
genera [52]. Healthy term births are associated with increased Enterobacter and L. crispatus in the placenta, but preterm births with severe chorioamnionitis display enrichment of Ureaplasma parvum, Fusobacterium nucleatum, and Streptococcus
agalactiae in the placenta [40]. Though the role of these bacteria in BV and preterm birth is unclear, intervention strategies which supplement the vagina with Lactobacillus
depending on vaginal pH level have shown decreases in preterm births [41]. Larger clinical trials are necessary to confirm the positive impact of Lactobacillus
supplementation in pregnant women.
Injury to the microbiome, such as by surgery, smoke inhalation, or toxic
were exposed to low and high doses of diethyl phthalate, methylparaben, triclosan, or a mix of these three from birth through adulthood [32]. Significant increases in
Bacteroidetes and decreases in Firmicutes were seen at the adolescent stage in these rats, but these changes disappeared by adulthood [32]. Arsenic, a common drinking water contaminant, also shifts microbial composition and metabolic phenotype [54]. Arsenic demonstrated time and dose-dependent changes in Bacteroidetes and Firmicutes along with microbial and host nitrogen metabolism, possibly inducing conditions favorable to infection and disease [54]. Cigarette smoke, which contains known cytotoxic compounds such as acrolein and polycyclic aromatic hydrocarbons (PAH), alters the nasal and oral microbiome [55–59]. Comparison of the upper and lower respiratory microbiota in smokers and non-smokers revealed overall enrichment of certain taxa in the lung but the effect of smoking was only significant in the oral microbiome [58]. Another study comparing the effect of smoking on the nasal and oral microbiota revealed increased microbial diversity in smokers and clustering first by body site and then by smoking status, indicating the greater effect of location over smoke exposure [59]. These studies demonstrate that injury, whether physical or chemical, can induce changes in the microbiota in a variety of body locations, but their immediate and long-term effects on health are unclear and require additional investigation.
1.2 Review of Strategies for Investigating the Microbiome
in vitro cellular models have been developed, allowing for mechanistic investigation into observations from human studies, as well as various bioinformatics pipelines and
statistical methods specific to the unique requirements of microbiome data. Microbiome studies require the unification of biological experiments with computational data
analysis, encouraging the formation of multi-disciplinary groups to carry out the most effective research. Effective communication between experts in these fields is crucial to optimization of research strategies.
1.2.1 Experimental Models
1.2.1.1 Human Studies
1.2.1.2 In Vivo Animal Models
Animal models allow study of manipulations to both the host and the microbiome that may not be ethically possible in human studies. Animals can be treated with
pathogens and toxic compounds that are known to do harm to people, and they can be euthanized and dissected to study the impact of such compounds on specific body
locations [62]. Although such methods provide crucial knowledge that ultimately benefits human health, their use in people would clearly be unethical and violate the principle of beneficence laid out by the Belmont Report. Therefore, animal models provide a critical link between observations in human studies and specific manipulations that aid in understanding the mechanism behind them.
Of existing animal models, mice are used most frequently due to ease of working with and maintaining them, genetic tools available, and their genetic similarities to humans [60]. Mice share ninety-nine percent of their genes with humans, and various knock-out, knock-in, and transgenic models have been developed to study the function of these genes and their impact on human biology. Environmental conditions in mouse models, such as diet, exercise, wake/sleep cycles, and stress are easy to alter and assess the resulting impact on microbiota and health outcomes. Mice have played key roles in the study of transgenerational inheritance, which is the idea that epigenetic alteration to previous generations, through environmental exposures and/or disease, can be passed on to the offspring [63]. Though not widely explored in the context of the microbiome, recent mouse studies demonstrate the role epigenetics may play in appropriate
host epigenetic mechanisms [64,65]. Mice provide a convenient model system in which to explore the interaction of host genetics, epigenetics, and the microbiome.
The most widely used mouse model in microbiome studies is the germ-free mouse (GF). These mice are born in sterile isolators that keep them free from
colonization with any microorganism; bacteria, virus, or fungi [66]. These animals can then be colonized with individual bacteria, selected communities, or even donor communities from humans in order to link them to specific functions [66]. Once
colonized, these animals are known as gnotobiotic mice [60,66]. The utility of this model is exemplified in a recent study on the composition and function of the gut microbiota in twins [67]. Here, fecal microbiota from one monozygotic twin pair and three dizygotic twin pairs, all of which were discordant for obesity, were transplanted into GF mice. The mice were fed a low-fat, high-plant polysaccharide diet and assessed for adiposity and metabolic changes. Because mice are coprophagic, cohousing one mouse with the lean microbiota and another with the obese microbiota allowed study of transmission of the microbiota between them. The model revealed increases in adiposity in mice colonized with the obese microbiota, along with decreased metabolism of short-chain fatty acids (SCFA), and increased metabolism of branched-chain amino acids. Cohousing prevented adiposity in obese mice and shifted their microbiota to a lean-like state, which included increased abundance of Bacteroidales [67]. Although compositional and functional differences can be measured from human microbiota, the use of GF mice in this study provided evidence that the bacteria themselves, rather than diet, contributed to increased body mass and adiposity. Further, the ability to cohouse these mice demonstrated
preventing obesity. This level of fine experimental control is not possible in human studies and provides direct evidence for functional roles of the microbiota in health and disease.
Though GF mice play crucial roles in elucidation of microbial functions, they are not without their limitations. In comparison to conventionalized (CONV) mice, GF animals demonstrate stunted immune responses, altered gene expression profiles in epithelial intestinal cells, and reduced renewal of epithelial cells after injury [39,66]. Several recent studies imply that microbial colonization after birth is critical to
development of appropriate immune responses as well as brain development [14,68–70]. In the prefrontal cortex of GF mice, genes involved in myelination and myelin plasticity were upregulated and axons showed hypermyelination, suggesting that microbiota are necessary for appropriate regulation of this process [68]. Though the GF model allows elucidation of functional roles of microbiota, particulary during development, it may not be appropriate for studies investigating differences in microbial composition at the adult stage. Since these animals have not had exposure to microbes from birth, their responses to various microbiota may be skewed and not accurately represent differences induced by microbial communities. For example, though the previously mentioned twin study used GF mice to identify differences in function and composition between lean and obese microbiota, the response may be entirely different if CONV mice had been used instead. Despite these issues, the GF mouse remains an important model for establishing the importance of specific bacteria and communities of bacteria on host development.
easily maintained and accessible model for investigating the role of the microbiome in various life stages.
Additional considerations in using mouse models are strain and vendor specific differences in microbiota and cohousing. C57BL/6 mice obtained from two different commercial vendors, Jackson Laboratory and Taconic Farms, were observed to have significant differences in the proportion of Th17 cells in their small intestinal lamina propria [74]. Transfer of microbiota only from Taconic mice into a GF model induced accumulation of Th17 cells, and cohousing of mice from the two vendors allowed Th17 cell accumulation in Jackson mice. The hypothesis that this was due to the presence of a specific bacterial taxa in Taconic mice was confirmed; segmented filamentous bacteria were shown to induce Th17 cells and play significant roles in immune modulation [74]. Sequencing analysis of fecal microbiota of various strains from several vendors
confirmed the major impact of vendor on microbial composition and development over 24 weeks of the mouse’s life [75]. Strain-specific differences are well documented in mouse models, but vendor-specific differences at the level of the microbiota are often overlooked. These studies emphasize the importance of taking this into consideration when designing studies; results with mice from one vendor could be completely different with mice from another. The way in which mice are cohoused also has a demonstrated impact on the gut microbiome. Various studies have shown that cohousing mice results in transfer of the microbiota with healthy, advantageous species dominating the community [71]. Further, mice caged together have microbiota which are more similar in
composition than mice in other cages, indicating the development of a cage
common microbiome by gavaging mice altered microbial community composition but did not eliminate the impact of the cage microenvironment. Meaningful microbiome studies must not only choose an appropriate mouse model system, but must take into account the source of the mice as well as their living environment in assessing the impact of alterations in microbial communities.
Both GF and ABX-treated models exist in other species, and similar limitations apply. Each has specific advantages, but none are as similar genetically and
physiologically as mice are to humans. Zebrafish are popular model systems due to their transparency until they reach adulthood, ease of maintenance and generation, the suite of genetic tools available, and the similarity of their gastrointestinal tract to mammals [60,66]. Rats contain many similarities to mice, including various disease-specific and genetically altered strains. The fruit fly Drosophila has powerful genetic tools available but lacks an adaptive immune system [60]. Various other mammals, such as pigs, dogs, and the bobtail squid have also been used to model the microbiome [60,66].
1.2.1.3 In Vitro and Ex Vivo Systems
experimental variables, are less costly and higher throughput, and allow use of high-resolution molecular analyses [66].
In vitro gut bioreactors consist of either simple short-term incubations and single stage reactors or multi-compartmental continuous systems [62]. Short-term incubations and single reactors act as screening tools in which the ability of microbiota to metabolize or interact with various substrates can be measured. Continuous systems are made of multiple reactions and mimic the varying digestive capabilities of the human intestinal tract [62,66]. One of the earliest models consisted of three reaction vessels simulating the ascending, transverse, and distal colon at a pH of 6.0, 6.5, and 7.0, respectively [62]. More complex models, such as the Simulator of the Human Intestinal Microbial
Ecosystem (SHIME), incorporate additional reaction vessels and internal components to more accurately model the length of the digestive system [62,66]. SHIME has five interconnected reaction tubes containing mixtures of luminal microbes that mimic digestion by acid and pepsin in the stomach, monosaccharide metabolism in the small intestine, and fermentation by microbes in the varying regions of the colon previously modeled [62,66]. Models such as the TIM2 build on the SHIME model by adding computer-controlled peristaltic mixing through application of pressure to the tubes, and absorption of water and microbial metabolites through use of a dialysis membrane
[62,66]. These models are useful in evaluating the roles of the microbiota in digestion and metabolism of dietary components and drugs as well as studying the functional capacity of specific microbiota from healthy or diseased states. However, their major limitation is the lack of incorporation of human cells, which prevents study of host-microbe
There are a limited number of studies that have successfully co-cultured human and microbial cells [66]. Immortalized vaginal epithelial cells (VEC) grown at air-liquid interface (ALIF) form tight junctions and multilayers that resemble the stratified
squamous epithelium of the vagina and respond in a similar manner to pro-inflammatory stimuli [79]. Normal commensal members of the vaginal microbiota colonized only the apical layer of the cultures and did not induce cytokine secretion but Staphylococcus epidermidis, a skin commensal, did. This system was used to determine the impact of vaginal microbial community composition on replication efficiency of human
immunodeficiency virus-1 (HIV-1) and application of an antiretroviral medication, demonstrating its utility in reproducibly modeling the interactions of vaginal microbiota with both normal and infected host cells [77]. More complicated and recent model systems have used organoids and microfluidics [78,80]. Intestinal organoids are three-dimensional structures that differentiate into epithelial subtypes when cultured in a gel matrix [80]. Cells from the intestinal crypt, which include stem cells, are harvested from human donors for this ex vivo model. Gene expression quantification revealed that this model reflects in vivo expression levels of genes involved in the serotonin pathway. Supplementation of microbiota-derived factors induced expression of other serotonin-related genes, making it a useful tool in studying this pathway [80]. When exposed to cultured media from abundant commensal gut bacteria, organoids respond in a strain-specific manner [81]. Although organoids have not been exposed to complex
(HuMiX) involves three co-laminar microchannels for co-culture of human intestinal epithelial cells with microbiota [78]. These three chambers each have inlet ports for inoculation of cells and perfusion media as well as outlet ports for collection of eluates for down-stream molecular analyses. They are separated by porous membranes to allow perfusion of media between the chamber layers but prevent cross-contamination,
allowing long-term co-culture. The system also has integrated sensors to measure oxygen concentrations and allows for measurement of epithelial integrity by insertion of a
chopstick-style electrode [78]. This complex model allows HuMiX to recapitulate in vivo
transcriptional responses to bacteria, making it the most physiologically relevant of the in vitro and ex vivo models described here while allowing for high-resolution molecular analyses to understand host-microbe interactions. Models that integrate the multiple cell types that interact with the microbiome, allow for in-depth mechanistic studies, and simulate appropriate physiologic processes are necessary to understanding the role of microbiota in health and disease. Fine experimental control that provides reproducible data in the most physiologically relevant system will result in concrete strategies to manipulate the microbiota in vivo for improved health outcomes.
1.2.2 Sequencing Strategies and Technology
larger insert sizes [82]. However, Sanger sequencing requires shearing of DNA into fragments that are then clonally amplified within a plasmid vector [83]. This process is laborious, time-consuming, and expensive [22,82,83]. Further, library preparation may be biased due to toxicity of gene content to the vector expressing it [83]. Next-generation sequencing (NGS) methods produce shorter read lengths at a fraction of the cost of Sanger sequencing, implement the use of polymerase chain reaction (PCR)-based amplification methods, and take much less time to run. Comparison of NGS and Sanger sequencing has demonstrated that shorter read lengths are similar in accuracy to longer Sanger read lengths in clustering analysis based on environment the sample came from [84]. Shorter reads also give comparable results at the level of microbial community composition as Sanger reads in samples from lean and obese people [85]. These advantages have led to a shift in the metagenomics field to use of NGS over Sanger sequencing for identification of microbiota.
1.2.2.1 Next-Generation Sequencing
The term NGS refers broadly to high-throughput methods that allow sequencing of millions to billions of DNA strands in parallel [86]. These methods encompass varying combinations of amplification, detection, and sequencing chemistry methods, providing researchers with an array of platforms to choose from that best meet their projects’ needs. Table 1.2 provides a summary of the platforms applied to microbiome studies
Both Roche and Illumina platforms use sequencing-by-synthesis chemistry, in which a single nucleotide is incorporated into the sequence per cycle [2,83,86]. On the Roche 454 platform, DNA fragments are attached to microscopic beads for clonal amplification by emulsion PCR and then deposited into a plate for parallel
pyrosequencing [82]. For each cycle, DNA polymerase incorporates the complementary deoxynucleoside triphosphate, releasing pyrophosphate [2,82,83]. Pyrophosphate is converted to adenosine triphosphate (ATP) by the enzyme sulfurylase in the presence of adenosine 5’-phosphosulfate [2,83]. ATP acts as a substrate for the enzyme luciferase, which produces light that is detected by a charge-coupled device camera that allows conversion to the template sequence [2,82,83]. The emulsion PCR used in this method is prone to generation of artificial replicate sequences, which can be dealt with
appropriately using bioinformatics tools [82]. When the polymerase encounters
of PCR clones of the original DNA template [87]. As with Roche 454 technology, Illumina employs the sequencing-by-synthesis method, adding all of the four possible dNTPs (A, C, T, or G) fluorescently labeled with a unique color at each cycle. Only the complementary dNTP is incorporated into the growing sequence, which is imaged and the color recorded as the appropriate base. A decrease in quality may appear
Table 1.2: Comparison of Sequencing Technology used in Microbiome Studies [3,86,89–91].
Platform Method Read Length Run Time % Total Error Rate 16S rRNA Whole Genome
Sanger Capillary-based, fluorescent dideoxy terminator
750 - 800
base pairs 2 hours 0.001 Full length; 2-3 reads Long reads enable database comparisons Illumina Fluorescent
sequencing-by-synthesis
36 – 151
base pairs 4 hours – 15 days
<1 1 variable region per read Short reads aren’t limiting Roche 454 Pyrosequencing
light emission
300 – 600 base pairs
9 – 23 hours
1 3
variable regions per read Long reads enable database comparisons IonTorrent Proton
detection 200 base pairs 2 – 3 hours 2 4 variable regions per read
Short reads aren’t limiting PacBio Fluorescent
single-molecule sequencing 250 base pairs to 40 kilobases 1.5 hours
15
Full-length reads Long reads assist in assembly Oxford Nanopore Single-molecule sequencing detected by DNA passing through pore 230 – 300 kilobase pairs 1 minute – 48 hours
at the end of Illumina reads, which is due to extension of some of the sequences either falling behind or getting ahead of the others [87,92]. Illumina has become the sequencing platform of choice for microbiome studies due to its increased accuracy, lower cost, and faster run time [82].
1.2.2.2 Microbiome Sequencing Methods
1.2.2.2.1 16S rRNA Gene Amplicon Sequencing
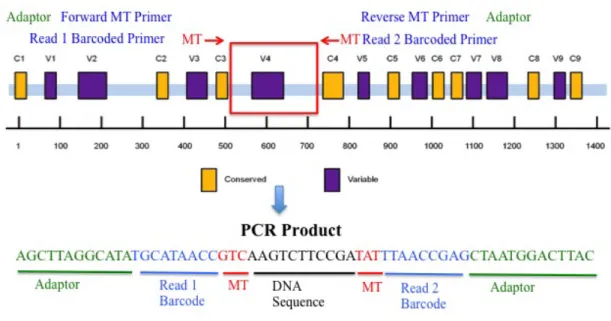
16S rRNA gene amplicon sequencing is dependent on amplification of the universally conserved bacterial 16S ribosomal gene [2]. It contains nine hypervariable regions between which nine conserved regions are interspersed, allowing design of primers that anneal to conserved regions and amplify a specific variable region for sequencing [2,3]. Figure 1.2 depicts conserved and hypervariable regions within the 16S rRNA gene. The primer set in Figure 1.2 corresponds to the highly used 515F/806R set developed by Caporaso et. al [94]. These primers specifically amplify the V4
hypervariable region which Caporaso et. al. have determined to yield optimal results based on the length of Illumina sequencing reads. However, the optimal variable region for amplifying and detecting the range of bacterial species in a microbiome sample has yet to be determined [22,91]. Despite the conserved nature of the gene, there is some variability among the conserved regions between bacteria, making certain primer sets better suited to anneal to these regions in specific populations rather than others. This results in over- or under-representation of certain taxa depending on the primer set used Figure 1.2: The Bacterial 16S rRNA Gene. The 16S rRNA gene contains nine conserved and nine hypervariable regions. Primers (red arrows) are designed that anneal to
[22]. For example, the previously mentioned primer 515F, as well as several others, matches greater than 95% of sequences of bacterial phyla in the gut, while 784F is biased against Verrucomicrobia, and 967F matches less than 5% of Bacteroidetes, a major constituent of the gut [22]. Primer bias clearly alters detection of bacteria within the microbiota, leading to significant differences in diversity metrics depending on region sequenced and making it impossible to compare studies using different primer sets [22,95]. Standardization of primer sets among microbiome studies has been suggested to address this problem, but ignores the issue of taxonomic under-representation by the specified primers in communities where the missing taxa could be crucial to
functionality. WGS, which does not depend on amplification and therefore bypasses primer bias, is a viable alternative to amplicon sequencing for microbiome studies, but is not widely used due to cost and computational complexity.
The short read length of Illumina technology was initially a concern in the microbiome field, which had previously relied upon Roche 454 reads that were nearly twice the length [94]. Longer 454 reads allow up to three hypervariable regions to be sequenced per read, whereas Illumina’s 150 base pair length allows a single region per read [3]. The shorter read length prevents high resolution of individual taxa (i.e. down to species level) but the greater number of reads and sequencing depth makes Illumina’s technology superior in overall community resolution [95]. Caporaso et. al. compared microbiome amplicon sequencing using both Roche and Illumina platforms and
either thousands of samples per run or fewer samples with much higher coverage, which has not been possible with previous sequencing technology [94]. Illumina’s fluorescently labeled dNTPs solve Roche’s homopolymer issue, making it more accurate. The
advantages of Illumina’s platform have made it the leader in microbiome amplicon sequencing studies.
1.2.2.2.2 Whole Genome Sequencing
transcriptional elements with their associated promoters and binding sites [83]. In
complex microbiome samples, genomes from each community member are only partially sequenced in short fragments and a lack of bacterial reference genomes creates difficulty in appropriately mapping the reads to the correct species. Despite these challenges, the HMP has successfully used WGS to demonstrate the relative consistency of microbial community functions from a range of body sites in healthy adults [8]. Although
computationally complex, WGS provides an additional layer to metagenomic community sampling that aids in understanding the functional roles of different microbial
communities as well as their composition.
1.2.3 Data Analysis
After sequencing, raw reads require a number of processing steps before the bacteria they represent can be identified and statistically analyzed. Various open-source tools have been developed to complete distinct steps in this process but, prior to 2009, they did not exist in a single package that could take raw reads as input and give
publication-quality figures as output. To address this issue, metagenomics pipelines were developed. These pipelines integrate other independently developed tools into a
significance of differences among bacterial abundances. Though choice of pipeline may be based on user preference, care must be taken in use of statistical methods for data analysis. An understanding of both computational and statistical methods is necessary in choosing the appropriate test to make valid biological conclusions.
1.2.3.1 Analysis Pipelines
Metagenomics pipelines were developed to streamline the analysis of both WGS and amplicon sequencing data. Very generally, a pipeline is a series of data input/output steps that is automated to run with just a few commands. Metagenomics pipelines take raw reads in FASTA and/or FASTQ file format, filter out low-quality reads, demultiplex sample barcodes, and trim off primer sequences [2]. After this pre-processing step, the samples are treated differently depending on whether they are WGS or 16S rRNA gene amplicon sequences. If they are WGS, assembly of the read fragments is required followed by comparison to a database to annotate the reads. If they are 16S rRNA gene amplicons, they are grouped into operational taxonomic units (OTU) by percent sequence similarity. This serves as a proxy of species-level taxonomy and reduces computational complexity [96]. Once grouped into OTUs, the sequences are compared to one of several 16S rRNA gene databases in order to identify the bacteria present. The number of
The earliest and most popular of the pipelines are mothur [97], developed by Pat Schloss’s group at the University of Michigan, and Quantitative Insights into Microbial Ecology (QIIME, pronounced ‘chime’) [98], developed by Rob Knight’s group at the University of Colorado at Boulder. A less popular but more user-friendly platform was developed by Susan Huse, David Welch, and Mitch Sogin at the Marine Biological Laboratory and is known as Visualization and Analysis of Microbial Population Structures (VAMPS) [99]. Tools for analysis of microbial communities are constantly evolving and improving, and, as such, the creators of each of these pipelines are continually releasing updated versions, resulting in increasing accuracy and
reproducibility of data analyzed by each. The choice of which pipeline to use for data analysis depends mainly on the user’s experience in bioinformatics, as each is excellent but has its own advantages and disadvantages.
Both QIIME and mothur are implemented in the command line and require the user to be able to operate in a Linux environment as well as have some basic knowledge of the programming language each is written in. The scripts within QIIME are written in the language Python, while those within mothur are written in C++. Python is a flexible programming language that is easy to learn and use, but can be slow due to the nature of its implementation [100]. C++ is more complex than Python, making it more difficult to learn and use, but its implementation makes it much faster [97]. When analyzing large metagenomic datasets, computational power and speed are factors that must be
considered when choosing an appropriate analysis pipeline.
the time of this writing, the original article describing QIIME was cited 2,146 times in Pubmed, while the article introducing mothur was cited 1,899 times. Both QIIME and mothur are free and open-source and contain scripts for parsing FASTQ files,
demultiplexing barcodes, trimming sequences, denoising sequencing errors, and identifying and eliminating chimeric sequences that result from PCR errors. Mothur contains scripts to bin sequences into OTUs by percent similarity, but QIIME takes this a step further and provides three separate strategies for grouping OTUs that implement external OTU clustering tools. The first two of these strategies are de novo and closed-reference OTU picking. De novo OTU picking algorithms cluster sequences together without comparison to reference sequences. Closed-reference strategies cluster reads against reference sequences and eliminate those that do not match any of the references. Open-reference OTU picking combines these two strategies; reads are matched to
reference sequences and clustered de novo if they do not match. QIIME’s default external tool for this process is UCLUST, which is an algorithm developed by Robert C. Edgar [101]. The UCLUST algorithm improved on the speed, computational power, and quality of clustering as compared to other commonly used methods, such as CD-HIT. External OTU clustering tools are also wrapped into mothur, and include DOTUR and CD-HIT [97]. Although the OTU picking methods of QIIME and mothur are valid, differences in the algorithms used has been demonstrated to give different clustering results. He et. al.
produces the best OTU stability, but eliminates discovery of new species by discarding reads without a previously sequenced match. Open-reference picking, with a de novo
clustering algorithm that is more stable, may be the best solution to this issue [96]. Understanding the nuances behind options such as OTU picking strategies is critical to getting high-quality data from metagenomics pipelines.
Beyond quality filtering and OTU picking, both mothur and QIIME contain tools for statistical data analysis and visualization. Mothur groups its scripts into OTU-based and hypothesis testing approaches, while QIIME has a variety of scripts for analyzing microbial diversity. In mothur, OTU-based approaches encompass calculation of microbial community diversity based on ecological measures. Mothur’s hypothesis testing approaches include statistical analysis of distance metrics, analysis of variance, and co-occurrence. The QIIME website includes tutorials on using analysis of variance (ANOVA) to compare categories, distance metric comparison, network building, supervised learning algorithms, and microbial source tracking. QIIME also integrates software that displays the data in visually appealing formats. Both pipelines produce publication-quality figures from statistical analyses.
QIIME and mothur. VAMPS is an excellent starting point for sequencing analysis for biologists with limited coding experience.
QIIME, mothur, and VAMPS were all initially developed to analyze 16S rRNA gene amplicon sequencing data, not WGS reads [97–99]. QIIME currently contains code under development to analyze WGS reads but mothur and VAMPS do not. As with amplicon sequencing, many tools exist to perform the various steps involved in WGS assembly and annotation but there are few pipelines that streamline these tools in order to take raw reads to publication-ready figures. WGS reads are generally either assembled by mapping to reference genomes or de novo, without a reference genome [102]. Reference-based mapping is limited by existing reference genomes while de novo assembly requires more computational power and memory. Once assembled, reads are binned into
taxonomic groups in one of two methods. The first is based on the distribution of the mers, or fixed-length ‘DNA words’, among genomes. Different genomes have unique k-mer distributions, which allows grouping independent of a reference. In the second method reads are aligned to a reference and binned based on similarity. Finally,
assembled genomes can be annotated to identify coding, noncoding, and other regulatory regions.
Unfortunately, truncating sequences to create k-mers and considering them
simultaneously for assembly requires a large amount of computational memory. Khmer deals with this issue by partitioning the reads into different files. The program counts k-mers and calculates their abundance and performs ‘digital normalization,’ in which k-mer abundance is normalized by eliminating redundant reads covering the same portion of the genome and keeping just enough to allow efficient genome assembly. Khmer does not include code to annotate assembled genomes, so users will need to seek external tools to perform this step. Though other assembly tools exist, khmer is a good choice for
efficient, reproducible WGS read assembly and is relatively easy to use. Ultimately, the choice of analysis pipeline depends on the goals of the study and the researcher.
1.2.3.2 Statistical Analysis of Compositional Data
Once amplicon or WGS reads have been transformed into OTU tables, statistical analysis can be done. The complex nature of microbiome datasets makes them
which the percent composition of each taxa totals to 100% for each individual sample. This compositional nature means that changes in abundance of one taxa will drive changes in the others, since the data is forced to sum to a constant [107]. Rarefaction, which randomly resamples to the size of the smallest library, has been used to correct for this compositional data, but it has been argued that rarefaction is inappropriate to use for this purpose [108]. McMurdie et. al. demonstrated that rarefaction results in high false positive rates when identifying significant differences in species abundance and it eliminates sequences that can be appropriately clustered using other methods. The continued use and prevalence of rarefaction in the microbiome field highlights how important it is for biologists to understand the theory behind statistical and computational methods to analyze microbiome data. Inappropriate application of statistical models can lead to conclusions that do not support the underlying biology.
Development of appropriate statistical analysis methods for microbiome data is challenging. Corrections for the compositional nature of the data include log-ratio
transformations which, in theory, do not alter underlying covariance or correlation among the data and allow application of traditional statistical analyses [107]. However, the sparseness of microbiome data often makes this transformation problematic, as it requires dividing by the geometric mean of the taxa. If the mean is zero, the value becomes
compositional microbiome data enables use of traditional statistics methods to determine significant changes in microbial populations.
Microbiome statistical analysis methods draw heavily on diversity methods from the ecology field. Species diversity indices are widely used to simplify complex
benefit from using and comparing all of them to determine interactions within communities [109–111].
Though diversity indices are useful in assessing overall trends among microbiota, identifying differential abundance of individual taxa among groups may indicate specific bacteria that play important roles in the environment or disease state. Besides the
compositional nature of microbiome data, both its sparseness and its tendency to be dominated by a few taxa make appropriately modeling this data difficult [106]. As mentioned previously, log-ratio transformations can be used in order to apply standard downstream statistical analyses. Dirichlet multinomial mixtures have been developed that take into account data sparsity as well as the presence of diverse and rare taxa [120]. Two-sample t-tests have been employed to determine differential abundance among abundant taxa and Fisher’s exact test has been used for rare taxa [106]. Variations on the Wilcoxon rank-sum test have been used as well [114]. Specific tools have been
developed to manage the challenges of microbiome data and identify significantly enriched taxa. Curtis Huttenhower’s group at Harvard has developed a suite of analysis tools written in a combination of Python, R, and Perl that perform both compositional and statistical data analysis. These tools have been implemented in the Galaxy platform, which is a web-based environment that allows researchers without a programming background to analyze high-throughput data [121]. The Huttenhower group’s programs LEfSe and MaAsLin can be used within Galaxy to determine significant enrichment of bacterial taxa based on relevant biological information [122]. LEfSe employs a
exposed to lead [123]. MaAsLin takes this a step further and allows detection of enriched taxa among multiple biological classes. The previously mentioned pipelines and R packages also contain methods to detect differentially abundant taxa and visualization options to compare them. Given the issues in appropriate statistical methods to detect enriched taxa, experimental methods such as quantitative PCR (qPCR) should be used to confirm bacterial abundances.
While diversity indices provide overall trends among microbiome data and differential abundance detects changes in specific taxa, co-occurrence relationships and network analyses aim to understand how the microbes in a community interact with each other or respond to specific variables [124]. Rather than describing how and to what degree microbial communities change, network and co-occurrence analyses predict how taxa influence each other or are altered by outside variables through the use of correlation coefficients and networks. These methods are a type of dimensionality reduction, in which complex microbiome data can be mathematically condensed into a simpler version that is easier to interpret and understand. Various studies have used both Pearson and Spearman methods to calculate correlation coefficients for changes in microbial taxa and external factors, such as exercise [125] and bacterial metabolites [126]. Though the Pearson method is appropriate for parametric data and Spearman for non-parametric, neither of these methods takes the compositional nature of the data into account [127]. Sparse Correlation for Compositional Data, or SparCC, was developed to determine pairwise correlations between microbial taxa while correcting for the data’s