Abstract
Cenozoic tectonism can be seen in a variety of different ways in the Coastal Plain of North Carolina. Using high resolution Light Detecting and Ranging digital elevation models (LiDAR), the geology of the coast can be analyzed to look for evidence supporting recent tectonism and disequilibrium. The rivers in the Coastal Plain, as well as other features, provide much evidence to support this theory. Looking at the complicated geomorphology of the rivers, particularly the Cape Fear River, gives insight to potential fault locations along the rivers. Most of the streams exhibit stream capture, another sign of disequilibrium, and the amount of stream capture was quantified on the Cape Fear River. There is a southwest migration trend in the major rivers of the Coastal Plain. While the Cape Fear Arch can explain this trend in the Cape Fear River, it does not explain the southwest migration in other rivers in the north as well.
Knickpoints were found in all of the rivers in the Coastal Plain. While most of them can be associated with sea level fall or changes in underlying lithologies, there are many that are caused by tectonics. Wave-cut escarpments were once deposited horizontally in various places due to rises and falls in sea level. Elevation profiles along these scarps show a higher elevation in the north than in the south, which could be explained by uplift. This uplift would also account for the southwest migration trend in the rivers.
Introduction
the cause. Evidence of syndepositional and post-depositional tectonics can be seen in the geology of our coast, and more specifically, the rivers and paleoshorelines.
The sediments of the coastal plain were deposited during transgressive-regressive cycles caused by eustatic sea level fluctuations, which were partially caused by the expansion and recession of glacial ice caps (Soller). During an interglacial period, high sea level allowed marine sediment to be deposited, and falling sea level during the onset of glaciation caused regression, incision, and erosion (Soller). These sequences occurred multiple times and are seen on the coast. During the maximum transgressions, erosional, wave-cut scarps were formed, marking the landward extent of a cycle’s deposits, or the paleoshores (Soller). Elevation differences, from north to south, in these scarps provide supporting evidence for uplift (Rowley).
There has been documented uplift occurring in North Carolina since the Cretaceous. The Cape Fear Arch, located slightly northeast of the Cape Fear River, is the predominant upwarp in the coastal plain (Soller). The Norfolk arch in southern Virginia and northern North Carolina is also another location of upwarp, but is not as prominent (Soller). The Neuse Arch is in between these two arches and is also not as predominant (Rowley). The Cape Fear Arch has helped the Cape Fear River to migrate in a southwestward direction. However, the Cape Fear River is not the only river that shows signs of southwest migration. In fact, all of the rivers in the coastal plain of North Carolina show a southwest migration trend. This could either be from regional uplift along the entire coastal plain, or faults (Bartholomew).
also migrated significantly from its initial position, providing evidence for uplift. Dunes deposited by the river show evidence of migration. As the transgresive-regressive cycles
occurred, terraces were formed as the river migrated. These terraces can be dated and correspond with the fluctuations in sea level. Other key evidence associated with the Cape Fear River
supporting disequilibrium in the coast includes stream capture and knickpoints in stream profiles. Stream capture occurs essentially when a stream flows into a previous stream. Originally, the streams were moving in two different directions, but tectonics caused a shift in the river movement, allowing one stream to capture another. Knickpoints clearly indicate that the river gradient is in disequilibrium and is trying to reequilibrate.
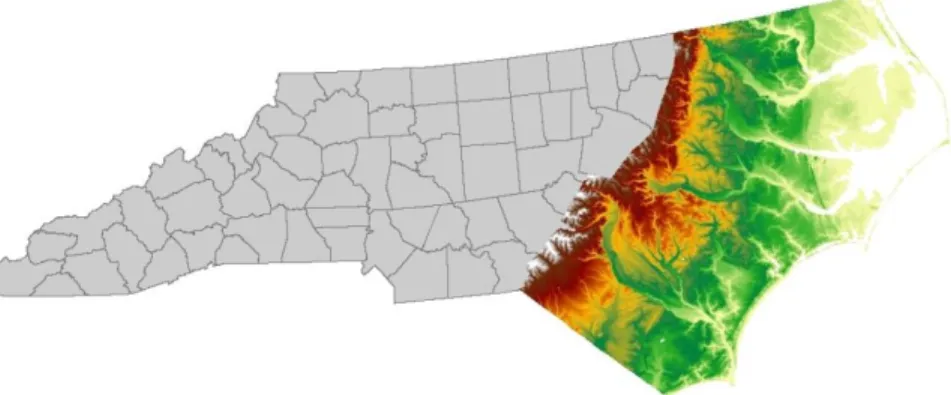
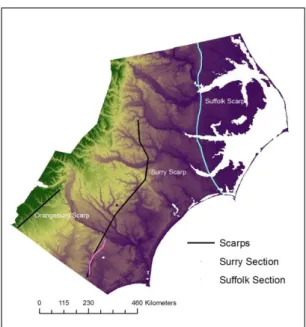
The coastal plain gives us very clear evidence that the coast is not in equilibrium. An analysis on the scarp elevations and the change in the Cape Fear River will provide further evidence to support the hypothesis that the coast is in a state of disequilibrium. The area of interest can be seen below in Figure 1.
Figure 1. Map of North Carolina with area of interest, or the coastal plain, indicated by elevation data.
Methods
of ArcGIS, most of the important features on the coast can be observed and analyzed, providing supporting evidence for disequilibrium on the coast. Lidar data is extremely clear with a high resolution, providing an accurate and very detailed elevation map. All of the Lidar data was obtained through the North Carolina Department of Transportation, who obtained this data from the North Carolina Flood Mapping Program. Elevation grids were available for all fifty counties in North Carolina with a twenty foot cell size. Only the counties located in the coastal plain were used and mosaicked together create a single map of the entire coastal plain of North Carolina.
The general coastal geology as well as key structures can be clearly seen in the Lidar elevation grids. The paleoshorelines or scarps are clearly identified because of the elevation differences between the higher, older coastlines from high stands, and the lower sediments deposited as the shoreline was prograding. Using the 3D Analyst tools on ArcMap, these scarps can be traced, and the elevation along them can be plotted. Large elevation differences trending from north to south show how sediment that was originally deposited nearly horizontally, have changed and have been either uplifted or depressed, supporting the hypothesis that our coast is in disequilibrium. The most easily identifiable scarp would be the Suffolk Scarp. The Orangeburg Scarp and the Surry Scarp produce very noisy results and will not be analyzed, except for one small section of the Surry Scarp.
fall in sea level can be seen very clearly. A history of how this key river has changed throughout time can be explained using the Lidar grid.
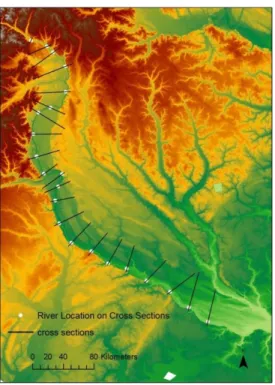
Figure 2. Map showing locations along the Cape Fear River on which cross sections were made.
The movement of the rivers through time can also be seen and quantified. The location of the Cape Fear River has changed drastically since the Pleistocene, and this shift or river
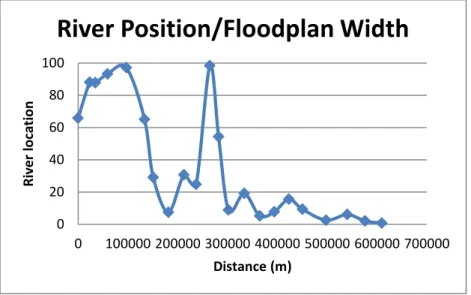
account for the difference in width of the flood plain along the river. Positions closer to zero indicated the most southwest position of the river in the floodplain, and values closer to one hundred indicate the most northeast position location of the river. The location of the river was then plotted against the distance, showing the movement across the current flood plain. To calculate the total distance the river has moved, the distance tool was used to calculate the distance between the initial river position and the position the river is currently in now. This was only done in the most exaggerated portions of the river, where the initial position was easily identifiable.
category was then put into a percentage to quantify the number of tributaries that show stream capture.
Figure 3. Image of the ModelBuilder tool used to create the stream profile.
Results
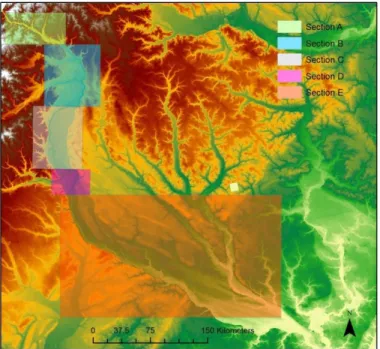
Figure 4. Five different sections of the Cape Fear River which were broken down according to geomorphologies.
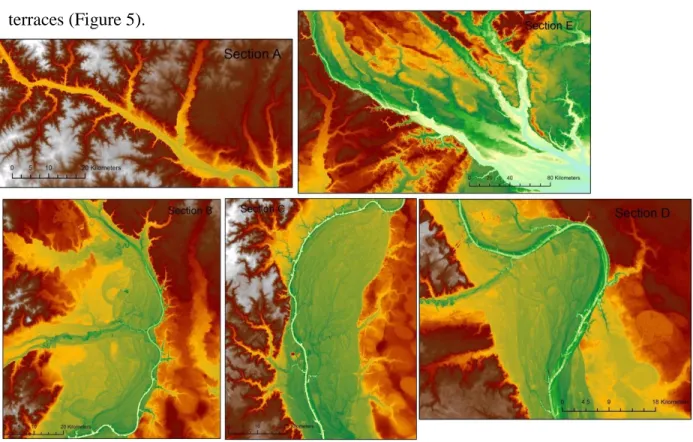
tributaries flowing in the same direction. The river shifts from a sporadic, thin, immature
meandering river in the southwest to a mature, less sinuous meandering channel in the northeast (Figure 5). Section C shows the typical southwest migration trend, as well as a shift from a complex braided river system to a much simpler meandering river system (Figure5). Section D shows a recent, strange migration trend that is very short and temporal (Figure 5). This part of the river also shifts from a braided river to a meandering river. The only long tributary joining this section of the river trends north east as well, showing that flow direction in that area is directed towards the northeast. Lastly, Section E shows a smaller southwest migration trend superimposed on the longer southwest migration trend and is characterized by sand dunes and terraces (Figure 5).
Figure 6. Map of the different scarps and surfaces that are plotted.
The Suffolk, Surry, and Orangeburg Scarps are clearly identifiable in the Lidar grids, as well as other surfaces that show elevation differences (Figure 6). The typical north to south trend in elevation is decreasing. There are noticeably higher elevations on the most north end of the scarps than the south end (Figure 7). There is strange noise in the elevation data, but after
Figure 7. Cross sections showing the trend of decreased elevation from north to south among the Suffolk Scarp and a section of the Surry Scarp.
Figure 8. Image showing the southwest migration trend in the Cape Fear River.
the river that sticks out towards the northeast, the river has shown a southwest migration trend. Only recently have parts of the river started shifting back to the northeast, as such trends are not seen in the old river beds. On the long term scale, the river has migrated at least approximately 100,000 meters but possibly as much as 130,000 meters as shown in Figure 10. Evidence
showing that the river was previously further northeast and has migrated southwest would be the sand dunes that were deposited from the Cape Fear River. As the river moved southwest, it deposited more dunes parallel to the previous dunes and in lines parallel to river flow. This large scale migration trend occurs along the majority of the Cape Fear River in the coastal plain, shown in Figure 10.
Figure 9. Plot of the normalized river position in the floodplain. Values close to 0 represent the most southwestward location and values closer to 100 indicate the most northeast location.
0 20 40 60 80 100
0 100000 200000 300000 400000 500000 600000 700000
Ri ver loc ati on Distance (m)
Figure 10. Map showing the long term migration trend of the Cape Fear River, as well as its current floodplain and the extent of older floodplains.
Stream capture occurs frequently along the Cape Fear River among its one hundred and eighty-one tributaries. Only fifty-seven of these tributaries were used in quantifying stream capture because some were too short and did not extend past the flood plain. Out of the
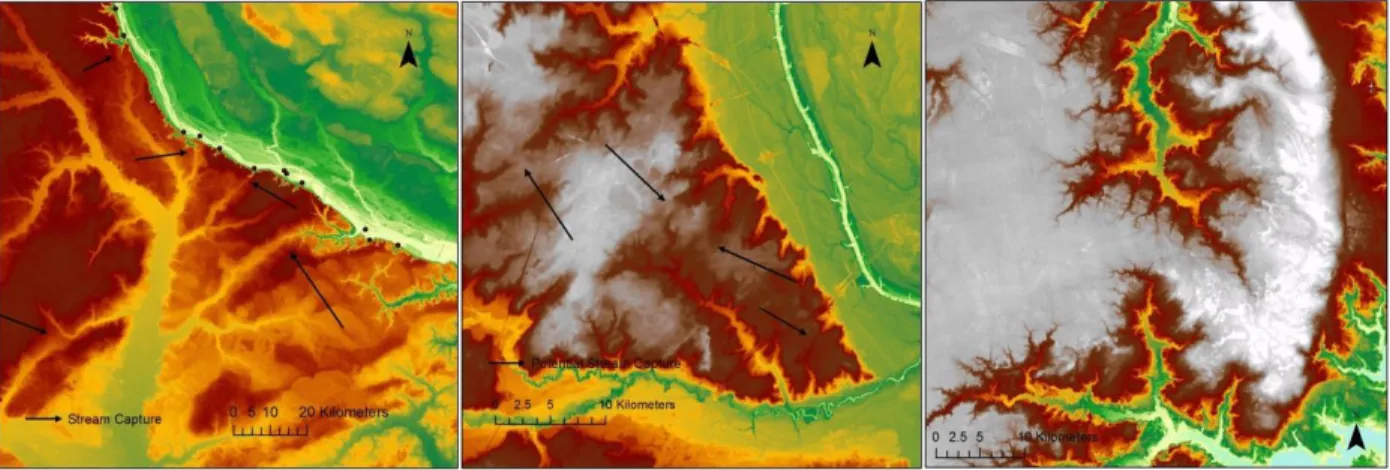
qualifying tributaries twenty, or 35.1 percent, showed stream capture, eighteen, or 31.5 percent, showed no stream capture, and nineteen or 33.3 percent, showed evidence of future stream capture (Table 1). Figure 11 shows examples of each scenario: prominently displayed stream capture, no stream capture, and evidence of future stream capture.
Tributaries Number Percent
Qualifying tributaries 57 31.5%
No stream capture 18 31.5%
Prone to stream capture 19 33.3%
Definite stream capture 20 35.1%
Figure 11. Images displaying the degree of stream capture. The first image shows definite stream capture, the second image shows potential stream capture, and the last image shows no stream capture.
Knickpoints occur in all of the rivers in the Coastal Plain (Figure 12). Most of the
knickpoints occur in the higher elevated regions of the Coastal Plain further to the west. As seen in Figure 12, few knickpoints are located on geological contacts. There are several elevations at which multiple knickpoints occur. There are four occurring at elevations between 29 and 30 meters, eight occurring between 33 and 36 meters, six from 49 to 50 meters, five from 57 to 58 meters, seven from 63 to 65 meters, ten from 84 to 87 meters, 7 from 112 to 115 meters, five from 146 to 148, and five from 215 to 218.
Figure 12. Map showing underlying geology contacts, streams in red, and knickpoints as dots. The colors of the dots represent the elevations at which the knickpoints are located. Gray is low elevation and purple is high elevation. The Cretaceous mud and clay is the purple colored unit.
Discussion
There is a very distinct southwest migration trend, both short term and long term, for the majority of the Cape Fear River. Overall, the Cape Fear River has migrated over 100,000 meters, which would not have occurred without reason. This can easily be explained by uplift from the Cape Fear Arch; however, since this trend is apparent in all of the rivers, the uplift probably starts further north. The enhanced trend on the Cape Fear may be as such due to the combination of the Cape Fear Arch, as well as another source of uplift.
The majority (68.4%) of the tributaries on the southwest side of the Cape Fear River either clearly show stream capture, or show potential for stream capture. This is a fairly high number and is a clear indicator that the coastal plain, at least around the Cape Fear River, is in disequilibrium. The other rivers in the coastal plain do show evidence of stream capture, but were not quantified. Stream capture can occur from channel migration, tectonism (tilting, doming, etc), catastrophic avulsion from high stream flows, or aggressive headward erosion (Bishop). While some of the places where stream capture occurs are from channel migration, catastrophic avulsion, or aggressive headward erosion, some of the places that show stream capture show no signs of any of the aforementioned, but might possibly have been generated due to tectonism in the area.
The stream profiles show many knickpoints in every major stream or river in the Coastal Plain. The knickpoints are controlled by several factors, such as underlying geology, sea level fall, and tectonic activity. There are hardly any knickpoints in a Cretaceous aged unit in the southern part of the Coastal Plain as opposed to the Tertiary clay and mud deposits in the north. The knickpoints that occur around the same elevations are most likely caused by a fall in sea level since the knickpoints would have migrated at the same rate. There may be some
in sea level. There are still knickpoints leftover after the lithologies and sea level falls have been accounted for. These knickpoints are tectonically related and are caused by uplift or small faults in the area. Since the Coastal Plain is relatively flat, uplift and faults occur on small scales of less than ten meters, making them very difficult to identify. The knickpoints show that uplift or faults are occurring and that the coast is in disequilibrium.
Conclusion
There is substantial evidence supporting the hypothesis that the Coastal Plain of North Carolina is in disequilibrium and is facing, at the very least, uplift associated with tectonics. The elevation difference from north to south along the scarps shows that there must be uplift
References
Bartholomew, M. J., Rich, F. J., 2013. Pleistocene shorelines and coastal rivers: Sensitive Potential Indicators of Quaternary Tectonism Along the Atlantic Coastal Plain of North America. Geological Society of America Special Papers 493, pp. 17-36.
Rowley, D. B., et al., 2013. Dynamic Topography Change of the Eastern United States Since 3 Million Years Ago. Science 340, pp. 1560-1563.