INSTITUTIONAL FOODSHED ANALYSIS:
EXPLORING THE APPLICATION AND FEASIBILITY OF A NOVEL METHODOLOGY
AT A NORTH CAROLINA HOSPITAL
ALISON SALOMON
APRIL 12, 2019
1 CONTENTS
Acknowledgements ... 2
Project Background ... 3
Part I: Literature Review Introduction ... 4
Foodshed Analysis ... 5
Instituitonal Food Procurement ... 9
Part II: Hospital Foodshed Analysis Introduction ... 12
Methods ... 13
Results ... 19
Implications ... 34
References ... 38
Tables and Figures Figure 1: Flows in the Farm-to-Hospital System ... 10
Figure 2: Map of Study Area ... 14
Table 1: Ten-Year Production Averages for Selected POI in North Carolina ... 16
Table 2: Annual Hospital Demand for POI ... 18
Table 3: Percent of Hospital Demand for POI Met by Existing Supply within Service Areas ... 20
Figure 3: Map of Apple Supply ... 21
Figure 4: Map of Bell Pepper Supply ... 22
Figure 5: Map of Blueberry Supply ... 23
Figure 6: Map of Cabbage Supply ... 24
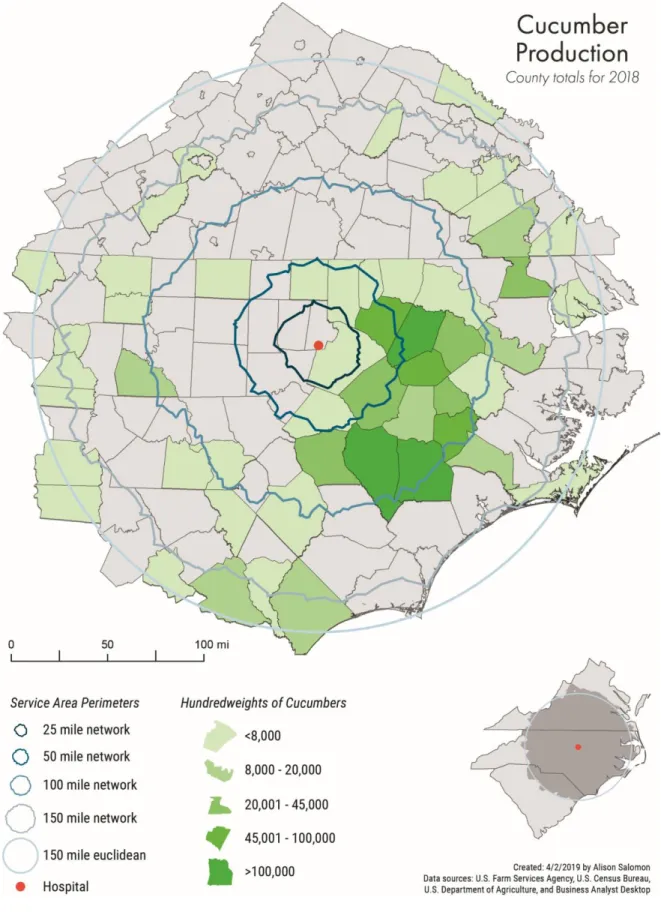
Figure 7: Map of Cucumber Supply ... 25
Figure 8: Map of Squash Supply ... 26
Figure 9: Map of Strawberry Supply ... 27
Figure 10: Map of Sweet Potato Supply ... 28
Table 4: Data Collection Observations ... 29
Table 5: Data Cleaning Observations ... 31
Table 6: Data Analysis Observations ... 32
2 ACKNOWLEDGEMENTS
My thanks to the food and nutrition services director with whom I worked, my mentors at Food Insight
Group (FIG), GIS librarian Phil McDaniel, my Capstone teammates, my advisor Andrew Whittemore, and
3 PROJECT BACKGROUND
This research is the result of a client-directed project on farm-to-hospital food procurement. The
client, Food Insight Group (FIG), is a food systems organization based out of Durham, North Carolina, that
is “committed to building just, equitable, and resilient food systems” (Katz & Thayer, 2018).
This MP augments and is supported by a Capstone project that was completed as part of the Masters
in Public Health program at UNC’s Gillings School of Global Public Health in the Health Behavior
Department. Findings from the Capstone study indicate that hospital administrators are key players within
the farm-to-hospital system and are almost solely responsible for creating change (Holbrook,
Jimenez-Magdaleno, Plaugic, Pollan, & Salomon, 2019).
Planners – whether working for local or regional government agencies, as consultants for constituent
groups, or within institutions – are often in positions that allow them to influence institutional
decision-makers and help drive systems-level change. This is the especially the case for institutional decisions
related to food systems, as planners are uniquely qualified to analyze and predict land use and economic
development impacts.
Foodshed analysis is a tool that planners may be able to leverage when working in this arena, but it
has not been studied in an institutional context. This research begins to address this knowledge gap by
articulating a methodology for institutional foodshed analysis, implementing the methodology at a large
hospital, and assessing the tool’s feasibility.
This MP has important implications for planning research and practice. This study is the first to
describe a feasible methodology for foodshed analysis that planners can apply in institutional settings.
The methods presented here can empower planners to effectively communicate with decision makers
about institutional food systems issues. Further research is needed to assess the tool’s utility and to
4
PART I:
LITERATURE REVIEW
INTRODUCTION
Among the basic essentials for life — air, water, shelter, and food — only food has been absent over the years as a focus of serious professional planning interest. This is a puzzling omission because, as a discipline, planning marks its distinctiveness by being comprehensive in scope and attentive to the temporal dimensions and spatial interconnections among important facets of community life.
— From the American Planning Association’s Policy Guide
on Community and Regional Food Planning (2007)
Food system planning is an emerging field that has been a topic of formal discussion and consideration
by planning professionals for less than two decades (American Planning Association, 2009; Born, Glosser,
Kaufman, Olinger, & Pothukuchi, 2005; Hodgson, Campbell, & Bailkey, 2011; Powell, Auld, Chaloupka,
O’Malley, & Johnston, 2007). The connections between food systems and land use, transportation,
economic development, and public health are readily apparent, but there has been limited applied
research on these topics within planning (American Planning Association, 2007; Freedgood,
Pierce-Quiñonez, & Meter, 2011; Pothukuchi & Kaufman, 2000).
This gap in applied food systems research is problematic for planning professionals. As public interest
5
policies, and develop practices that can reshape the local food landscape (American Planning Association,
2018; Dillemuth, 2017b; Hodgson, 2012). Planners can only respond to these constituent demands if they
are equipped with tools that can help them analyze, predict, and communicate about food systems — and
such tools are in short supply (Freedgood et al., 2011; K. Martin & Morales, 2015).
Foodshed analysis, also called foodshed assessment, is one tool that planners can leverage to explore,
explain, and predict the role of food systems in their communities (Horst & Gaolach, 2015; Horst,
Mcclintock, & Hoey, 2017; Raja et al., 2008). However, foodshed analysis is not widely used by planners
and its utility to the profession has yet to be established (Horst & Gaolach, 2015; Peters et al., 2016).
FOODSHED ANALYSIS
The term “foodshed” first appeared in the literature 90 years ago, when the word was used to
illustrate the flow of food from producers to consumers in How Great Cities are Fed (Hedden, 1929).
Decades later, Kloppenberg, Hendrickson, and Stevenson (1996) reintroduced the concept and expanded
upon Hedden’s usage by describing a foodshed as “a unifying and organizing metaphor [for the flow of
food] that starts from a premise of the unity of place and people, of nature and society,” a definition that
highlights the cultural significance and connectedness of food and place. In their view, a foodshed has “no
fixed or determinate boundaries,” but is instead defined by a variety of features that may or may not
overlap spatially (Kloppenburg, Hendrickson, & Stevenson, 1996). Thus, although the word intentionally
evokes the image of water moving through a watershed, the analogy is limited. Myriad nonphysical
elements – such as economic controls and cultural traditions – also influence where food is produced and
how it moves (Hedden, 1929; Kloppenburg et al., 1996). Despite these metaphoric limitations, the
foodshed concept remains a useful and intriguing way to imagine the movement of food, particularly at a
6
Horst and Gaolach (2015) identify three main ways in which to view foodsheds: spatially, “as a basis
for action,” and analytically. In the spatial sense, the word foodshed refers to the physical places, spaces,
and channels in which and through which food is produced, aggregated, processed, and distributed for
consumption by a defined population (Feagan, 2007; Freedgood et al., 2011; Peters, Bills, Wilkins, & Fick,
2008). In this context, Horst and Gaolach (2015) argue that the word “foodshed” indicates a
“natural-resource-based approach to ecosystem management” that is founded in a specific social-geographic
place. Foodshed as “a means of action” refers to the potential to advocate, educate, and create policy for
a given geography (Horst & Gaolach, 2015). Finally, a foodshed can be viewed as a unit of analysis, used
to examine food system sustainability and the degree to which a community – or, in the instance of this
MP, an institution – can access enough food to sustain itself (Horst & Gaolach, 2015).
METHODOLOGY
Academics have been exploring foodsheds and proposing methods for analyzing them for over a
decade (Horst & Gaolach, 2015). Put most simply, foodshed assessments seek to answer the question,
“what is the potential for a specific geography to feed itself?” Researchers have proposed a number of
ways to respond to this question through measurement, but no single methodology has emerged
(Freedgood et al., 2011).
In the last decade, Peters and colleagues have proposed several different ways to quantify foodsheds
and have published multiple studies articulating these methods (Clancy et al., 2017; Peters, 2010; Peters,
Bills, Lembo, Wilkins, & Fick, 2012). Experts in agricultural economics, soil science, and nutrition have
proposed a variety of methods for modeling food production and consumption, though few have
discussed their application in the context of foodshed analysis (Peters et al., 2008). Even so, researchers
have occasionally drawn on these methods when conducting foodshed analyses, particularly with regard
7
Ackerman, 2010; Conard, Ackerman, & Gavrilaki, 2011; Coppo, Stempfle, & Reho, 2017; Gatrell, Reid, &
Ross, 2011; Ge, Canning, Goetz, & Perez, 2018; Ge, Goetz, Canning, & Perez, 2018; Kremer & DeLiberty,
2011). These assessments are typically based off the nutritional or dietary requirements of a defined
human population and the productive capacity of the land within a specific geography, and both the
models and results tend to be highly technical and data-intensive (Freedgood et al., 2011).
Public groups who have conducted foodshed analyses have occasionally applied methods explored by
academic researchers, but practitioners have generally been more inclined to follow the process as first
described by Kloppenburg and colleagues in 1996. In their words, the “kinds of data/information [that]
ought to be collected… will vary as a function of who is engaging in foodshed analysis and what their
objectives and resources are” (Kloppenburg et al., 1996). Kloppenburg et al. (1996) argued that foodshed
analysis should not “conform to some predetermined theoretical and methodological framework” – a
view which explains the diverse forms of foodshed analyses in practice (e.g. Curtis, Creamer, & Thraves,
2010; D’adamo-Damery et al., 2016; Feenstra, Ellsworth, & Kuhns, 2010; Thompson, Harper, & Kraus,
2008).
LIMITATIONS & CRITIQUES
The question of whether or not foodshed analysis ought to adhere to a clearly defined methodology
is at the heart of the tool’s limitations – particularly from a planning perspective – and connects to several
of the chief critiques leveled against the practice. Lack of a uniform approach when conducting foodshed
analyses leads to a host of issues: an inability to compare assessments directly, the potential for
manipulated results, and indefensible or meaningless analytical conclusions. However, adherence to a
rigid methodology also has its limits, especially given that most proposed methodologies are highly
8
criticism, Peters and colleagues have acknowledged the limits of their methodology in practice, and in the
last few years have sought ways to make it more approachable (Peters et al., 2016).
Related to these methodological critiques, the concept of the foodshed itself has been subject to
criticism. Horst and Goalach (2015) identify two main issues: difficulty in defining a foodshed, and the
“fetishization of local.” Regarding the first point, they point out that there is no agreed upon definition of
“local,” meaning that the boundaries of a foodshed “may be in practice somewhat arbitrary” and may
“miss the importance of other influences” (Horst & Gaolach, 2015). On the second point, Horst and
Gaolach (2015) state that, “as a socially constructed scale, local has no inherent benefits.”
Planning professionals have debated this latter issue at length, and the problem even has its own
name within the planning community: “the local trap” (Born & Purcell, 2006). Born and Purcell (2006) urge
planners to use “strong caution as they engage more with food systems and draw increasingly on
food-systems research outside planning,” and to be aware of the “tendency of food activists and researchers
to assume… that local is inherently good.”
Local-scale food systems are equally likely to be just or unjust, sustainable or unsustainable, secure or insecure. No matter what its scale, the outcomes produced by a food system are contextual: they depend on the actors and agendas that are empowered by the particular social relations in a given food system.
— From Born & Purcell’s article, Avoiding the local trap: Scale and food systems
in planning research in the Journal of Planning Education and Research (2006)
Despite these critiques, it is clear that many citizens, organizations, and communities want to define
the food systems with which they interact, maintaining the relevance of foodshed analysis.
CURRENT USE
The literature indicates that both practicing professionals and academics in the planning field are
9
2018; Hodgson, 2012; Horst et al., 2017; Lengnick, Miller, & Marten, 2015; Peyton, 2012; Świader,
Szewrański, & Kazak, 2018; Zasada et al., 2017). Some have suggested a need for methodological
clarification and more use-case examples in order to increase its relevance to and use by planners
(Blum-Evitts, 2009; Campbell, 2004; Horst & Gaolach, 2015; Peters et al., 2016).
Searches for foodshed analyses using UNC Libraries’ online research databases indicate that scores of
foodshed assessments have been conducted by advocacy groups and municipalities around the country
in the last decade (Horst & Gaolach, 2015; Lengnick et al., 2015; Świader et al., 2018). Professional
planners were directly involved in less than half of all foodshed analyses returned by the search, but most
assessments conducted by jurisdictional agencies did engage planners (e.g. Conard et al., 2011;
D’adamo-Damery et al., 2016; Kremer & DeLiberty, 2011; Thompson et al., 2008)
These dozens of assessments spanned a variety of political geographies, from community to regional,
state, and even interstate levels. However, the search did not yield any foodshed analyses that had been
conducted at an institutional level (e.g. at a school, hospital, or university). This was a surprising finding,
given that foodshed analyses could be conducted at an institutional scale.
INSTITUITONAL FOOD PROCUREMENT
Universities, K-12 schools, prisons, government agencies, and other institutions feed millions of
people in the United States every day (USDA, 2011). Institutional food procurement varies widely based
upon the policies and practices in place, resulting in institutions often operating as unique and separate
food systems that are subject to differences in supply chains and internal consumptive patterns (Bloom &
Hinrichs, 2011; S. Martin & Andrée, 2012). Despite these inherent complexities, institutional food
procurement – often termed “farm-to-institution” by food systems professionals – has become a focus of
10
much of this interest lies in the fact that institutions can enable local producers and regional distributors
to “scale up” and sell more of their products and services than would otherwise be possible (Mount, 2012).
Food systems researchers have reported on barriers and facilitators to local food procurement in a
range of institutional settings, but K-12 schools and universities have been the focus of the vast majority
of these studies (Bagdonis, Hinrichs, & Schafft, 2009; Friedmann, 2007). Consequently, the mechanisms
that enable and limit local food procurement in the farm-to-school framework are well understood, and
many of these educational institutions have increased their locally-sourced offerings in recent years
(Bloom & Hinrichs, 2011). However, food procurement systems at other institutions, such as hospitals,
remain far less studied, despite their potential to have an equal – if not greater – impact on local food.
THE FARM-TO-HOSPITAL SYSTEM
Hospitals often act as anchor institutions in their communities: organizations that are influential and
provide employment opportunities, access to financial capital, and educational resources to those in their
communities (Dillemuth, 2017a; Hacke & Deane, 2017; Smith, Kaiser, & Gómez, 2013). One way in which
hospitals can drive economic development in their communities is by instituting farm-to-hospital practices
(Bendfeldt, Walker, Bunn, Martin, & Barrow, 2011; Klein, 2015).
Though the farm-to-hospital
system is complex (see Figure 1), the
locus of control is situated squarely
with hospitals: all flows in the
system stem from hospital demand
(Holbrook et al., 2019). Findings from
the Capstone study indicate that hospital administrators and actors who can exert pressure on these
hospital administrators (e.g. funders) are the key drivers of change within the entire system (Holbrook et Figure 1: Flows in the Farm-to-Hospital System
Holbrook, Jimenez-Magdaleno, Plaugic, Pollan, & Salomon, 2019.
Figure 1: Map of Study AreaFigure 2: Flows in the Farm-to-Hospital System.
Holbrook, Jimenez-Magdaleno, Plaugic, Pollan, & Salomon, 2019.
Figure 3: Map of Study Area
11
al., 2019). For this reason, it is critical that others within the system – and external groups who advocate
for them, including planners – develop ways to both measure and communicate about the system as a
12
PART II:
HOSPITAL FOODSHED ANALYSIS
INTRODUCTION
Foodshed analysis will not eschew engagement with issues at the national or even the global level. It will ask that this extra-local investigation serve the objective of framing the prospects for successfully implementing concrete initiatives or changes within a particular socio-geographic place.
— From Coming in to the Foodshed by Jack Kloppenburg, John Hendrickson, and G.W. Stevenson (1996)
As discussed in Part I, foodshed analyses have been widely used at a variety of politically defined
scales (e.g. by states, municipalities, and regions), but the utility and practicality of the tool within these
contexts is limited (Freedgood et al., 2011). Foodshed analysis’ use at an institutional level is
understudied, despite the fact that it may be particularly well suited for use within such a framework. The
feasibility of foodshed analysis within an institutional setting is explored here, in Part II, through the
development of a novel methodology and its practical application at a hospital in the Research Triangle
region of North Carolina.1
13 METHODS
Foodshed analyses do not adhere to a single methodology, as discussed in Part I. Moreover, the
literature does not elucidate any methods for applying the tool institutionally. For these reasons, the
author did not follow an existing methodology – rather, she designed and implemented the novel
methods described here.
Given the author’s external position relative to the institution of study, she began by establishing a
working relationship with a large hospital (hereafter referred to as Hospital) located in the Research
Triangle region of North Carolina. While communicating with Hospital’s food and nutrition services
director (hereafter referred to as FNSD) during the fall of 2018, the author inquired about completing a
foodshed analysis for Hospital. FNSD conferred with several senior management officials at Hospital, and
granted the author conditional permission2 to conduct the study.
The foodshed analysis methodology developed by the author consisted of five main steps: 1) defining
study geographies, 2) defining products of interest (POI), 3) estimating supply-side POI yield data, 4)
calculating demand-side POI purchasing data and 5) spatially analyzing the level of POI demand met at
each defined geography. After completing the quantitative foodshed analysis, the author employed
qualitative methods to assess the feasibility of the tool in practice.
STUDY GEOGRAPHIES & PRODUCTS OF INTEREST
Given the spatial nature of foodshed analysis, multiple geographies related to the study were defined
prior to analysis. First, a “point of purchase” was established. Normally, this would be the physical location
of the institution of study; however, because of Hospital’s desire to remain anonymous, it was incumbent
14
upon the author to create a de-identified point of purchase. The author assured Hospital’s anonymity by
15
Carolina and calculating the geographic center point of that polygon in ArcMap. Vertices of the polygon
were placed at Memorial Bell Tower, Duke Chapel, and the Old Well, as these align with a commonly used
definition of The Triangle (Research Triangle Regional Partnership, 2019). The resulting centroid is located
in south central Durham County at 35.905591, -78.890585. This point was used for the remainder of the
foodshed analysis to represent Hospital’s location – the point of purchase.
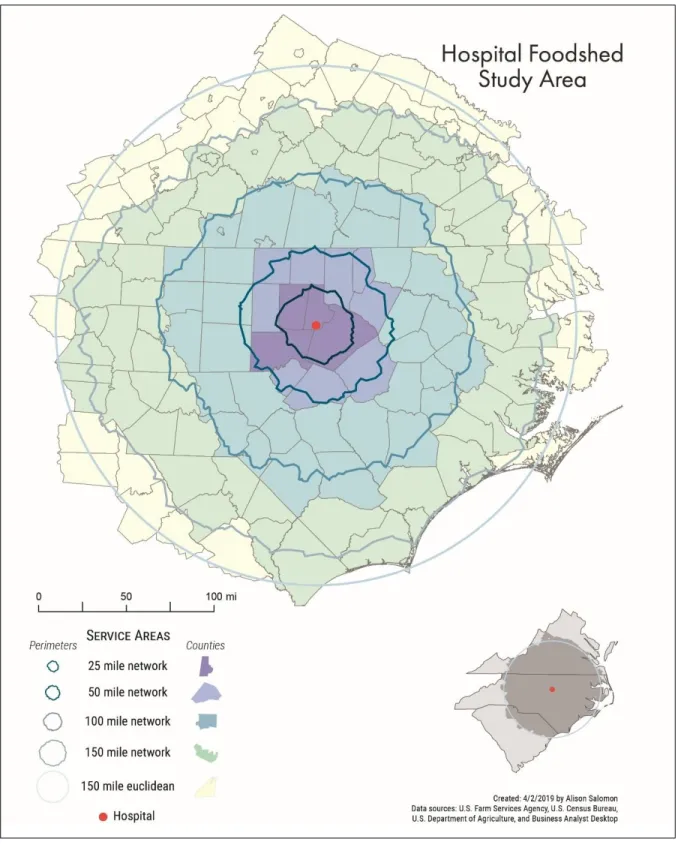
Service area perimeters were calculated from the point of purchase to correspond with commonly
used definitions of local food (e.g. grown within 100 miles). According to FNSD, Hospital does not currently
have an institutional definition for “local food,” so the author selected five different distance limits to
capture a range of possibilities. Service area perimeters using street networks were calculated from the
point of purchase using the Network Analyst tool in ArcMap 10.5.1. These were generated at driving
distances of 25 miles, 50 miles, 100 miles, and 150 miles, using the Business Analyst Desktop (2017) road
network. Additionally, the author created a Euclidean service area perimeter at 150 miles from the point
of purchase to calculate and compare the sensitivity of the network results (see Figure 2).
As with defining geographies, it was necessary to identify the foodstuffs of study prior to conducting
the foodshed analysis. Because the foodshed analysis’ purpose was to demonstrate potential
farm-to-hospital opportunities to Hospital administrators, the author considered only minimally processed items
(e.g. whole fruits and vegetables) currently grown in North Carolina. Additionally, the author selected
products with relatively lengthy “in season” periods, as seasonality is often listed by hospitals as a barrier
to farm-to-hospital procurement (see Implications section, below) (Holbrook et al., 2019). Referring to the
North Carolina Department of Agriculture and Consumer Services’ (NCDA&CS) State of Agriculture reports
and seasonality chart,3 the author identified eight fruits and vegetables to include in the foodshed
16
analysis: apples, bell peppers, blueberries, cabbage, cucumbers, strawberries, squash, and sweet
potatoes. These eight items were the products of interest (POI) used throughout the foodshed analysis.
SUPPLY
To estimate current production levels for each of the eight POI, the author used several data sources.
First, the author used Farm Service Agency (FSA) data published by the United States Department of
Agriculture (USDA) to estimate current acreage for each POI. These data are publicly available online,4
and are collected in accordance with an FSA policy that requires producers who participate in USDA
assistance programs to “submit annual reports regarding all cropland use on their farms” (United States
Department of Agriculture & Farm Services Agency, 2019). These FSA data are considered highly accurate
and reliable, and are used by other agencies across the USDA including the National Agricultural Statistics
Service (NASS) (Good, Department of Agricultural and Consumer Economics, & University of Illinois at
Urbana-Champaign, 2014; Honing & United States Department of Agriculture, 2014).
4 https://www.fsa.usda.gov/news-room/efoia/electronic-reading-room/frequently-requested-information/crop-acreage-data/index
Table 1: Ten-Year Production Averages for Selected POI in North Carolina
Data Sources: USDA, NASS, and NCDA&CS (2018). Yield/Acre (cwt)
2017 2016 2015 2014 2013 2012 2011 2010 2009 2008 10 Year Average
Apples 200 204 175 208 258 54 209 200 176 243 193
Bell Peppers 270 250 235 210 250 310 305 270 400 120 262
Blueberries 40 64 62 71 70 70 62 71 60 59 63
Cabbage 280 245 220 230 270 270 230 270 220 250 249
Cucumbers 160 140 145 115 210 190 140 110 160 105 148
Strawberries 135 120 130 140 100 135 130 120 130 130 127
Squash 97 66 98 54 51 200 130 90 110 110 101
17
In order to ascertain the number of North Carolina farms that report to the FSA, the author submitted
a Freedom of Information Act (FOIA) request (control number 2019-FPAC-BC-02641-F) to the USDA’s FOIA
office in Kansas City, Missouri. Upon receipt of the requested data, the author determined that 12,225
farms in North Carolina received FSA funding in 2018 – slightly more than one in every four farms in the
state. The majority of these are large operations, accounting for far more than 25.5% of all planted
farmland. Thus, though the FSA data do not capture 100% of planted farmland, they provide an excellent
conservative estimate.
FSA crop acreage data for 2018 were available for all eight POI at the county level (United States
Department of Agriculture & Farm Services Agency, 2019). The defined study geographies, described
above, extend into parts of South Carolina and Virginia as well as North Carolina (see Figure 2), so the
author used 2018 FSA crop acreage data from all three states.
To translate crop acreage into a yield estimate for each POI (e.g. pounds per acre), the author used
10-year North Carolina production averages (see Table 1), as the majority of counties in the study area
fall inside North Carolina (United States Department of Agriculture, National Agricultural Statistics Service,
& North Carolina Department of Agriculture and Consumer Services, 2018). For six out of the eight POI,
yield estimates were reported by NCDA&CS in “short hundredweight,” a commodity measure that is
abbreviated cwt and is equivalent to 100 pounds (United States Department of Agriculture et al., 2018).
The author converted all POI yield estimates to cwt for consistency.
DEMAND
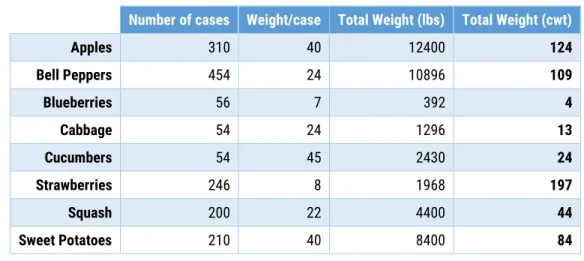
To calculate demand, the author requested purchasing data for each of the eight POI from FNSD at
Hospital. FNSD provided the author with a spreadsheet noting the “approximate number” of cases
18
case of each POI. The author converted these values to cwt to allow direct comparison to supply estimates
(see Table 2).
Number of cases Weight/case Total Weight (lbs) Total Weight (cwt)
Apples 310 40 12400 124
Bell Peppers 454 24 10896 109
Blueberries 56 7 392 4
Cabbage 54 24 1296 13
Cucumbers 54 45 2430 24
Strawberries 246 8 1968 197
Squash 200 22 4400 44
Sweet Potatoes 210 40 8400 84
Table 2: Annual Hospital Demand for POI
Data Source: Hospital FNSD (2019).
SPATIAL ANALYSIS
The author obtained Census TIGER/Line shapefiles for counties in North Carolina, South Carolina, and
Virginia and loaded these into ArcMap 10.5.1. The aforementioned study geographies (the five service
area perimeters and the centroid representing Hospital’s location and the point of purchase) were added
in ArcMap (see Figure 2). Supply-side yield estimates for all eight POI were appended as county-level
attributes. Finally, five polygons comprised of the counties within each perimeter were created. Counties
with less than 33% of their total land area inside of a given perimeter were excluded from the
corresponding polygon (see Figure 2). Analyses were conducted using Microsoft Excel and ArcMap 10.5.1.
The author created maps and charts to display the quantitative results using ArcMap, Adobe CC 2019, and
Excel (see Table 3 and Figures 3-10).
FEASIBILITY
Qualitative metrics were used to assess the feasibility of conducting an institutional foodshed analysis
using the proposed methodology, with particular attention paid to implications for the tool’s use in a
19
the three main phases of the foodshed analysis process: data collection, data cleaning, and data analysis
(see Tables 4-6). Collectively, these items inform the feasibility of using or adapting this institutional
foodshed analysis methodology in a contextually similar institutional setting (see Table 7).
Several limitations to this method of assessment threaten the validity of the feasibility findings. Most
notably, no existing feasibility measures were applicable to this evaluation and only one person – the
author – contributed observations. For these reasons, as discussed in the implications section at the
conclusion of this MP, further research is needed to validate the feasibility findings that are presented
here.
RESULTS
By comparing supply-side crop yield data to demand-side purchasing data, the foodshed analysis
illustrates what percentage of Hospital’s annual demand for the eight POI can be met by producers within
several defined network distances of the institution (see Table 3). Results of the quantitative foodshed
analysis are followed by qualitative findings related to feasibility.
HOSPITAL FOODSHED ANALYSIS
Results from the foodshed analysis indicate that Hospital’s current level of demand for all eight
products of interest (POI) can be met by existing supply within 25 miles of the institution (Table 3). This
was an unexpected finding. Prior to running any analyses, the author anticipated that institutional
demand would exceed existing supply for most – if not all – POI within 25 miles. At 50 miles, the author
hypothesized that, excepting apples, demand would be met by supply.
Findings from the foodshed analysis obliterated these hypotheses due to 1) an underestimation of
20
regard to the first assumption, the author anticipated that Hospital’s demand would be approximately ten
times higher for each POI than what Hospital reported. Even if this assumption had been correct,
Hospital’s demand still would have been met within 25 miles for all POI except cucumbers.
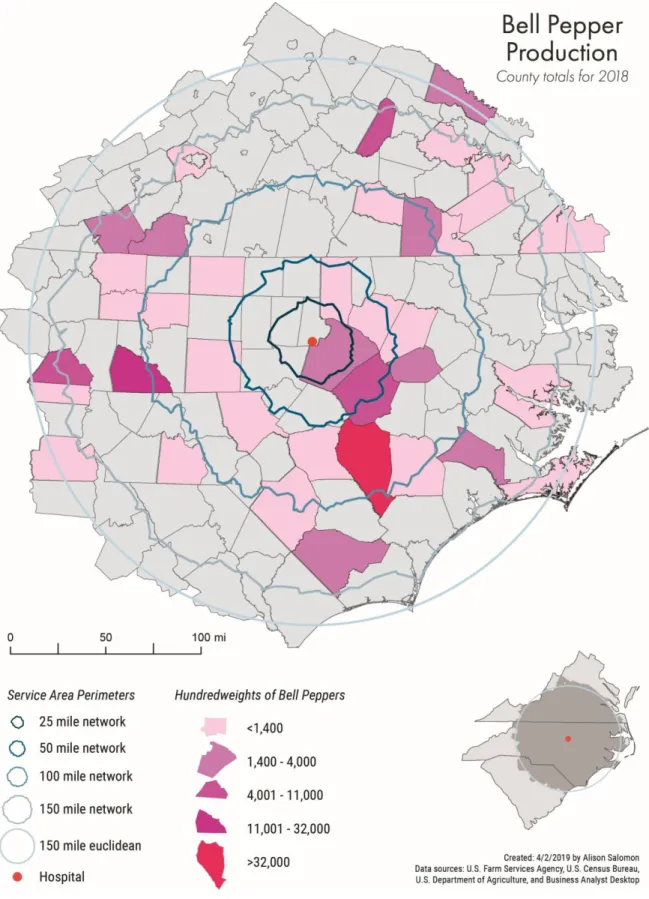
This underscores the inaccuracy of the author’s second assumption regarding current POI supply
within the 25-mile perimeter. In particular, the author underestimated POI yields in Wake County and did
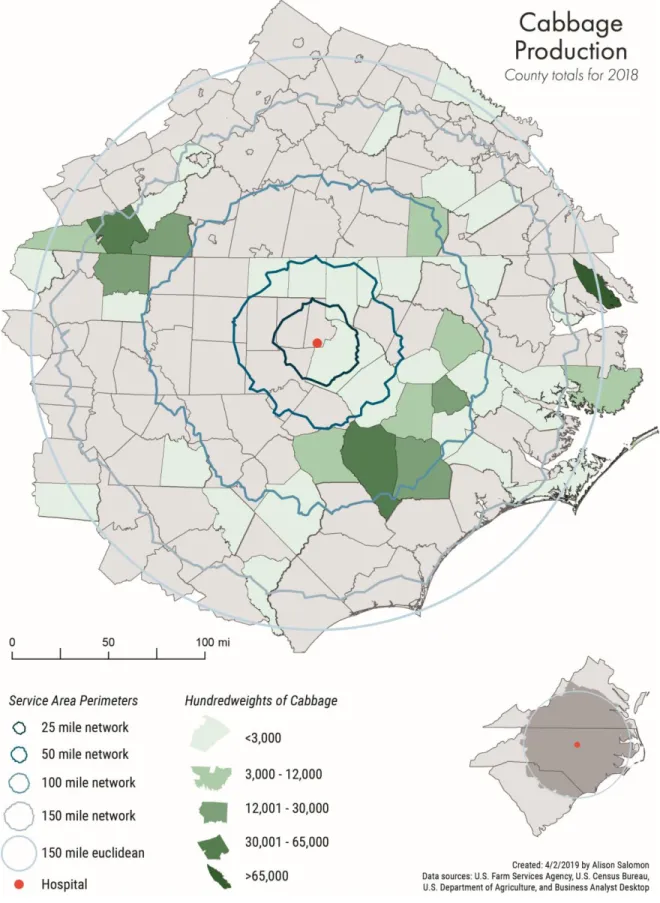
not anticipate that any apple production would occur within 50 miles of Hospital. The author created heat
maps of county-level yields for each POI to illustrate the variations in supply and highlight those counties
that are the most productive (see Figures 3 - 10).
Table 3: Percent of Hospital Demand for POI Met by Existing Supply within Service Areas
Data Sources: USDA (2018), FSA (2019), and Hospital FNSD (2019).
25 Miles 50 Miles 100 Miles 150 Miles 150 Mile Euclidean
Supply
(cwt) Demand Met (%) Supply (cwt) Demand Met (%) Supply (cwt) Demand Met (%) Supply (cwt) Demand Met (%) Supply (cwt) Demand Met (%)
Apples 1,860 1500% 2,765 2230% 6,985 5633% 186,951 150767% 324,612 261784%
Bell Peppers 2,358 2163% 8,640 7927% 273,870 251257% 328,927 301768% 334,905 307252%
Blueberries 313 7836% 1,619 40470% 113,832 2845800% 133,038 3325954% 134,574 3364347%
Cabbage 298 2292% 2,085 16038% 118,612 912400% 225,718 1736292% 539,347 4148823%
Cucumbers 111 463% 100,848 420200% 914,043 3808513% 1,005,169 4188204% 1,054,193 4392471%
Strawberries 3,016 1531% 12,828 6512% 42,745 21698% 57,083 28976% 64,610 32797%
Squash 15,551 35343% 29,256 66491% 204,990 465886% 243,493 553393% 265,529 603475%
21
22
23
24
25
26
27
28
29 FEASIBILITY
While conducting the foodshed analysis, the author recorded process observations to measure the
tool’s feasibility for use within this particular institutional setting (see Tables 4-7). Broadly speaking, these
observations fell into one of three categories that corresponded to phases of the foodshed analysis:
processes related to data collection, data cleaning, and data analysis.
The author recorded supply data observations separately from demand data observations. Resource
inputs of time and effort were considered for all categories, as were two indicators specific to each phase
of the foodshed analysis (e.g. “format” and “specificity” are metrics for the data cleaning phase).
Collectively, these processes influence the tool’s feasibility for use in other similar settings (see Table 7).
These findings directly inform some of the implications for practice discussed in the final section.
DATA COLLECTION PROCESS OBSERVATIONS
Table 4: Data Collection Observations
Supply data were publicly available, though the author was not able to locate them immediately. The
author sought county-level yield data for each POI, as data collected at that level maintain high fidelity
(data are less accurate and often unavailable at sub-county geographies). Initially, the author intended to
obtain county-level yield data via the 2017 Census of Agriculture, scheduled for release in February 2019.
However, due to the partial government shutdown in December 2018 and January 2019, the USDA did
Location Access Time Effort Overall
Sup
ply
Da
ta
moderately difficult
to locate data easy to access data moderately time-intensive moderate effort required moderately difficult to collect data
Dem
and Da
ta
30
not release these data on time.5 The USDA and NASS conduct the Census of Agriculture once every five
years, so the author briefly considered using the 2012 Census of Agriculture data. While in the pursuit of
more recent data, the author discovered that county-level acreage datasets are released bi-monthly by
the Farm Services Agency (FSA). She decided to use these in combination with acreage-based USDA yield
data estimates to extrapolate county-level yields. Once located, supply data were easily obtained: all data
were available online for download as CSV files.
Demand data collection was the opposite of supply data collection: locating data was straightforward
but obtaining the data was very difficult. Due to the author’s external position relative to the institution
of study, it was necessary to gain the institution’s trust in order to collect data. This process took several
months. Even after establishing a relationship with FNSD, it took over a month for FNSD to receive internal
permission to release the data, and only then on the condition of anonymity.
In terms of resource inputs, the collection phase was resource-intensive in terms of both time and
effort. Supply data collection was moderately time-intensive and required moderate effort. On the
demand side, this was the most resource-intensive phase of the foodshed analysis. Collection of demand
data took a significant amount of time and required a moderate-to-significant effort. Overall, the data
collection phase of the foodshed analysis was moderately difficult.
DATA CLEANING PROCESS OBSERVATIONS
The supply data files were very large, as they contained highly detailed FSA information for the entire
country. However, the original formatting of data was excellent. There was no way to specify the
geography of interest prior to download, so the author removed tens of thousands of records after the
fact. Once narrowed, the author collapsed values and removed data that were too specific (e.g.,
subcategories for different sweet potato varieties were combined into a single “sweet potatoes”
31
category). The author was readily able to accomplish these processes because of the existing data
architecture.
Table 5: Data Cleaning Observation
Formatting of the demand data was perfectly acceptable, though the spreadsheet was not as well
structured as the supply-side files. Minor adjustments were made in terms of the placement of columns,
rows, and variables. No additional cleaning was necessary for demand data, as they were straightforward
and appropriately specific.
Regarding resource inputs, neither the demand nor the supply data were taxing to clean in terms of
time and effort. Very little time was required, and only a moderate effort was needed to clean the supply
data. The data cleaning phase was the least resource-intensive of the three phases of the foodshed
analysis on both the supply and the demand side.
DATA ANALYSIS PROCESS OBSERVATIONS
In order to perform the analysis, supply data required both arithmetic and geographic manipulation.
Arithmetic adjustments were made to convert acreage amounts to yields, as described in the Methods
section. This was an uncomplicated process. Geographic manipulation of supply data was more
demanding, as records had to be matched to the appropriate counties and the different service areas that
Format Specificity Time Effort Overall
Sup ply Da ta data's original format was excellent
data were overly
specific not time-intensive moderate effort required data were easy to clean
Dem and Da ta data's original format was acceptable data were appropriately
specific not time-intensive
minimal effort
32
had been created. As described above, the author used ArcMap 10.5.1 to perform spatial analyses on the
supply data. This process necessitated familiarity with GIS and ArcMap.
Table 6: Data Analysis Observation
For the demand data, minor arithmetic adjustments were necessary to convert demand amounts into
standard cwt, as described in the Methods section. No geographic manipulation was required for these
data, as all connected to a single point – Hospital’s location.
Very little resource investment was necessary in terms of time and effort on the demand-side analysis
given the straightforward nature of the data. Resource inputs for the supply analysis were considerably
more substantial. Analysis was the most difficult and most resource-intensive of the supply-side
processes, requiring significant time investment and moderate effort. Cumulatively, the analysis process
required for both the supply and the demand data was moderately difficult, due mostly to the geographic
manipulations required for the supply data.
OVERALL FEASIBILITY
The feasibility of the foodshed analysis methodology proposed here is greatly impacted by the
position and resourcing of the observer using the tool. If the institutional observer is internally situated
(i.e. located within the institution for which the foodshed analysis is being conducted) and is adequately
Arithmetic Geographic Time Effort Overall
Sup
ply
Da
ta
data required some arithmetic adjustments data required moderately difficult geographic adjustments
time-intensive significant effort required difficult to analyze data
Dem
and Da
ta
data required minor arithmetic adjustments
data required no geographic
adjustments not time-intensive
minimal effort
33
resourced (e.g. has access to time, knowledge, and materials), this foodshed analysis methodology is
highly feasible. Conversely, an under-resourced and/or externally situated institutional observer may find
these methods difficult to employ.
The novel foodshed analysis methodology described
here is moderately feasible and is suited for use in similar
institutional settings (see Tables 4-7). The resources
available to the institutional observer (e.g. their access to
and knowledge of GIS) will significantly influence their
ability to use this tool because these factors affect their
ability to collect and analyze supply data.
Similarly, the positioning of the institutional observer
(e.g. as an employee of the institution of study or as an
outsider) has implications on their ability to collect and
analyze demand data. On the demand side, if the observer is internal to the institution of study, the data
collection phase becomes substantially easier, increasing the tool’s feasibility. Conversely, regardless of
the observer’s position, if they lack the resources – in terms of either time, tools, or skills – necessary to
perform any of the three phases of the foodshed analysis, they will not be able to implement this
methodology. Ultimately, because observer resources affect supply analysis and observer position affects
demand analysis, these aspects determine the tool’s overall feasibility in any given circumstance (see
Table 7).
Observer Position Internal External
O bser ve r Re so urce s Hig
h High
Feasibility Feasibility Moderate
Low Feasibility Moderate Feasibility Low
Table 7: Feasibility Matrix
34 IMPLICATIONS
This study has a number of implications for planning research and practice. The implications
presented below are by no means exhaustive.
FUTURE RESEARCH
Findings from this study indicate a need for additional research. First, a number of questions remain
about the utility of this proposed methodology and the results of this particular application. Additionally,
this foodshed analysis methodology should be extended to incorporate a temporal element in order to
capture fluctuations in production and adequately address questions regarding seasonality. Finally, more
research is needed to understand existing distribution pathways and infrastructural capacity for local
foods.
UTILITY
An important next step in light of this study is to measure the utility of the foodshed analysis
methodology proposed here. Perceived and actual utility of the proposed methods are factors that this
MP does not address, but the results of this study are well suited for use in future research exploring
utility. Perceived utility of the tool can be measured by capturing stakeholders’ opinions of the results
from the foodshed analysis conducted for Hospital, as well as their opinion of the methodology itself.
FNSD, food systems researchers, and planners are likely to have different perceptions regarding the utility
of these results and of the tool, which would be helpful to understand. Qualitative interviews with these
key stakeholders should be conducted to assess utility.
Understanding Hospital’s reaction to the results of the analysis is critical, given Hospital’s position of
power and ability to change the system. Interviews should be conducted with FNSD and other persons in
leadership and decision-making positions – such as the Vice President to whom FNSD reports – at Hospital.
35
What is expected/unexpected about them? 2) Which of these results are the most/least compelling?
Why? Within your institution, who are they the most/least compelling to? 3) Does Hospital intend to take
any action based upon these results? What action do they intend to take? Who will take these actions? If
no, why not? 4) Who will Hospital share these results with? Why? 5) What other POI would Hospital be
interested in knowing about? What other information would be useful to have? 6) Which visualizations
are the most/least interesting and why? Which are the most/least useful and why?
In addition to capturing Hospital administrators’ perceived utility of the results of the foodshed
analysis, it is important to find out what food systems researchers think of both the proposed
methodology and the results of this particular application. Interviews should be conducted with
stakeholders who have specialized food systems knowledge and familiarity with the institution of study.
Questions to ask researchers and institutionally-influential planners regarding results include: 1) Are these
results unexpected? Which ones? What is unexpected about them? 2) Which of these results are the
most/least compelling? Why? 3) What are the ways in which you could use these results? 4) What are the
ways in which someone else could use these results? 5) Who would you share these results with? Why?
6) Who would you not share these results with? Why?
With regard to the tool itself, questions to ask researchers and planners include: 1) Do you think
foodshed analysis as described by these methods is a useful tool? Why or why not? 2) What, if anything,
about these methods is problematic in practice? What, if anything, about these methods seems practical?
3) Do you think it is helpful to be able to quantify this information at an institutional level? Why or why
not? 4) Could you use these proposed methods to conduct an institutional foodshed analysis? Why or why
not? 5) Where, or within what type of institution, would you use these methods? 6) What other aspects
would you include to strengthen the analysis? How would those aspects strengthen the analysis? How
36 TEMPORALITY
Although the methodology presented here answers some significant questions regarding existing
supply and demand, its utility to institutional decision makers is likely limited because it does not account
for changes in consumption and supply patterns over time. For this reason, more research is needed to
extend the proposed foodshed analysis methodology into a temporal frame.
The method for foodshed analysis described by this MP provides a snapshot of annual supply and
demand patterns without regard to fluctuations over time. Ultimately, this provides an overly simplistic
analysis because it ignores the issue of seasonality. Seasonality is one of the chief reasons that institutions
cite as a barrier to sourcing local food products (Holbrook et al., 2019). For example, strawberries may
only be locally available between June and August, but Hospital’s demand for strawberries may be
constant throughout the year. If the foodshed analysis captured these seasonal changes in supply and
demand – perhaps on a quarterly or a monthly basis – the results would be more compelling to
institutional decision makers. Future research that accounts for seasonality will greatly enhance the utility
of the tool described in this MP.
SUPPLY CHAIN CAPACITY
As with seasonality, distribution capacity for local products is another barrier that institutions often
cite as a reason why they cannot source more locally produced foods. Although an understanding of
supply chain capacity for local foods would not directly influence the methods or results of an institutional
foodshed analysis, it would provide valuable context that would strengthen the tool.
This research would serve to compliment the foodshed analysis methodology presented here. If the
capacity to move local food through existing local supply chains is presented alongside the results of a
foodshed analysis, the narrative is likely to be more compelling to institutional decision makers. This is
37
would benefit from access to this information. Knowledge of the system’s capacity to move their products
will increase producers’ confidence and make them more likely to take the necessary steps to sell to
institutional buyers.
PRACTICE
Several implications for practice result from this study. First, this study describes a new methodology
for foodshed analysis that planners can practically apply in institutional settings. Prior to this study, there
were no existing, published methods for institutional foodshed analysis. Planners can use the methods
described here when assessing institutional foodsheds.
Additionally, the methodology described by this MP has the potential to be highly feasible in practice.
Results of the feasibility analysis indicate that planners are likely to find this tool moderately to highly
feasible. Planners are almost always “highly resourced,” with regard to the skills, time, and knowledge
necessary to use the methods described here, so the tool should be moderately or highly feasible,
depending on whether the planner is external or internal to the institution of study (see Table 7, the
Feasibility Matrix).
Finally, the method of institutional foodshed analysis presented in this MP empowers planners to
communicate with institutional decision makers. Prior to making any arguments for or against increasing
farm-to-institution practices, it is necessary to capture and communicate what – if any – overlap exists
between current local production and institutional consumption patterns. The foodshed analysis
methodology presented in this MP does exactly this, as it articulates a means of estimating current
regional supply and institutional demand for selected products of interest. This is valuable and necessary
information for planners who seek to influence institutional decision-makers, as future actions depend on
38 REFERENCES
American Planning Association. (2007). Policy Guide on Community and Regional Food Planning. Retrieved from http://www.planning.org/policy/guides/adopted/food.htm
American Planning Association. (2009). Essential Information Packet: Enhancing Urban Food Systems.
American Planning Association. (2018). Food Systems. Retrieved September 7, 2018, from https://www.planning.org/ontheradar/food/
Bagdonis, J. M., Hinrichs, C. C., & Schafft, K. A. (2009). The emergence and framing of farm-to-school initiatives: Civic engagement, health and local agriculture. Agriculture and Human Values, 26(1–2), 107–119. http://doi.org/10.1007/s10460-008-9173-6
Bendfeldt, E. S., Walker, M., Bunn, T., Martin, L., & Barrow, M. (2011). A Community-Based Food System: Building Health, Wealth, Connection, and Capacity as the Foundation of Our Economic Future.
Development, 35. Retrieved from http://pubs.ext.vt.edu/3306/3306-9029/3306-9029-PDF.pdf
Bloom, J. D., & Hinrichs, C. C. (2011). Moving local food through conventional food system
infrastructure: Value chain framework comparisons and insights. Renewable Agriculture and Food
Systems, 26(1), 13–23. http://doi.org/10.1017/S1742170510000384
Blum-Evitts, S. (2009). Designing a foodshed assessment model: Guidance for local and regional planners
in understanding local farm capacity in comparison to local food needs. University of Massachusetts Amherst.
Born, B., Glosser, D., Kaufman, J., Olinger, M., & Pothukuchi, K. (2005). Food System Planning White Paper. Journal of Planning Education and Research, 1–16.
Born, B., & Purcell, M. (2006). Avoiding the local trap: Scale and food systems in planning research.
Journal of Planning Education and Research, 26(2), 195–207.
http://doi.org/10.1177/0739456X06291389
Campbell, M. C. (2004). Building a Common Table: The Role for Planning in Community Food Systems.
Journal of Planning Education and Research, 23(4), 341–355.
http://doi.org/10.1177/0739456X04264916
Cardoso, A. S., Domingos, T., de Magalhães, M. R., de Melo-Abreu, J., & Palma, J. (2017). Mapping the lisbon potential foodshed in ribatejo e oeste: A suitability and yield model for assessing the potential for localized food production. Sustainability (Switzerland), 9(11).
http://doi.org/10.3390/su9112003
Clancy, K., Bonanno, A., Canning, P., Cleary, R., Conrad, Z., Fleisher, D., … Peters, C. J. (2017). Using a market basket to explore regional food systems. Journal of Agriculture, Food Systems, and
Community Development, 7(4), 163–178.
Conard, M., & Ackerman, K. (2010). Regionalizing the Food System for Public Health and Sustainability. In NESAWG (pp. 1–27).
Conard, M., Ackerman, K., & Gavrilaki, D. (2011). Modeling Production, Processing and Distribution
39
http://admin.urbandesignlab.columbia.edu/sitefiles/file/optimization-model.pdf
Coppo, G., Stempfle, S., & Reho, M. (2017). Urban food strategies and plans: considerations on the assessment construction. City, Territory and Architecture, 4(1), 1–7.
http://doi.org/10.1186/s40410-017-0064-2
Curtis, J., Creamer, N., & Thraves, T. (2010). From Farm to Fork: A Guide to Building North Carolina’s
Sustainable Local Food Economy. Retrieved from
http://www.ngfn.org/resources/ngfn-database/knowledge/State Action
Guide.pdf%5Cnhttp://www.cefs.ncsu.edu/resources/stateactionguide2010.pdf
D’adamo-Damery, P., D’adamo-Damery, N., Kunkler, T., Eshleman, J., Schroeder-Moreno, M., Cruz, A., … Ziegler, P. (2016). The Appalachian Foodshed Project: A Regional Report on Community Food
Security. Retrieved from
http://www.appalachianfoodshedproject.org/documents/2016AFPRegionalReport.pdf
Dillemuth, A. (2017a). Community food systems and economic development: the role of local governments in supporting local food economies. Planning & Policy Briefs: Growing Food
Connections, 1–12. Retrieved from
http://growingfoodconnections.org/wp-content/uploads/sites/3/2015/11/GFCPlanningPolicyBrief_EconomicDevelopment_2017Sept.pdf
Dillemuth, A. (2017b). The Role of Local Governments in Protecting Farmland, Increasing Community Food Production, and Supporting Local Food Economies. Planning & Policy Briefs: Growing Food
Connections, 1–36.
Feagan, R. (2007). The place of food: Mapping out the “local” in local food systems. Progress in Human
Geography, 31(1), 23–42. http://doi.org/10.1177/0309132507073527
Feenstra, G., Ellsworth, S., & Kuhns, M. (2010). Assessing the San Diego County Food System: Indicators
for a More Food Secure Future.
Freedgood, J., Pierce-Quiñonez, M., & Meter, K. (2011). Emerging assessment tools to inform food system planning. Journal of Agriculture, Food Systems, and Community Development, 2(1), 83–104. http://doi.org/10.5304/jafscd.2011.021.023
Friedmann, H. (2007). Scaling up: Bringing public institutions and food service corporations into the project for a local, sustainable food system in Ontario. Agriculture and Human Values, 24(3), 389– 398. http://doi.org/10.1007/s10460-006-9040-2
Gatrell, J. D., Reid, N., & Ross, P. (2011). Local food systems, deserts, and maps: The spatial dynamics and policy implications of food geography. Applied Geography, 31(4), 1195–1196.
http://doi.org/10.1016/j.apgeog.2011.01.013
Ge, H., Canning, P., Goetz, S., & Perez, A. (2018). Effects of scale economies and production seasonality on optimal hub locations: the case of regional fresh produce aggregation. Agricultural Economics
(United Kingdom), 49(2), 157–169. http://doi.org/10.1111/agec.12405
Ge, H., Goetz, S., Canning, P., & Perez, A. (2018). Optimal locations of fresh produce aggregation
facilities in the United States with scale economies. International Journal of Production Economics,
40
Good, D., Department of Agricultural and Consumer Economics, & University of Illinois at Urbana-Champaign. (2014). Comparing NASS and FSA Planted Acreage Data. Farmdoc Daily, 4(9). Retrieved from https://farmdocdaily.illinois.edu/2014/01/comparing-nass-fsa-planted-acreage-data.html
Hacke, R., & Deane, K. (2017). Improving Community Health by Strengthening Community Investment Roles for Hospitals and Health Systems, 48. Retrieved from
www.centerforcommunityinvestment.org
Hedden, W. (1929). How Great Cities are Fed. D.C. Heath and Company.
Hinrichs, C. C. (2003). The practice and politics of food system localization. Journal of Rural Studies,
19(1), 33–46. http://doi.org/10.1016/S0743-0167(02)00040-2
Hodgson, K. (2012). Planning for food access and community-based food systems: A national scan and
evaluation of local comprehensive and sustainability plans. American Planning Association.
Hodgson, K., Campbell, M. C., & Bailkey, M. (2011). Urban Agriculture: Growing Healthy, Sustainable Places, American Planning Association Planning Advisory Service, Chicago, IL., (563).
Holbrook, H., Jimenez-Magdaleno, K., Plaugic, M., Pollan, H., & Salomon, A. (2019). The Farm-to-Hospital
System in North Carolina. University of North Carolina at Chapel Hill.
Honing, L., & United States Department of Agriculture. (2014). Use of FSA Acreage Data. NASS Statistics
Division, Crops Branch. Retrieved from
https://www.nass.usda.gov/Education_and_Outreach/Understanding_Statistics/FSA_Acreage.pdf
Horst, M., & Gaolach, B. (2015). The potential of local food systems in North America: A review of foodshed analyses. Renewable Agriculture and Food Systems, 30(5), 399–407.
http://doi.org/10.1017/S1742170514000271
Horst, M., Mcclintock, N., & Hoey, L. (2017). The Intersection of Planning, Urban Agriculture, and Food Justice: A Review of the Literature. Journal of the American Planning Association, 83(3), 277–295. http://doi.org/10.1080/01944363.2017.1322914
Katz, B., & Thayer, L. (2018). Food Insight Group - About Our Work. Retrieved February 3, 2019, from https://www.foodinsightgroup.com/how-we-work
Klein, K. (2015). Values-based food procurement in hospitals: the role of health care group purchasing organizations. Agriculture and Human Values, 32(4), 635–648. http://doi.org/10.1007/s10460-015-9586-y
Kline, C. S., Joyner, L. E., Kirchoff, J. F., Crawford, A., Jilcott Pitts, S., Wall-Bassett, E., … Dunning, R. (2016). Gaps and barriers along the North Carolina agri-food value chain. British Food Journal,
118(2), 301–317. http://doi.org/10.1108/BFJ-06-2015-0223
Kloppenburg, J., Hendrickson, J., & Stevenson, G. W. (1996). Coming into the foodshed. Agriculture and
Human Values, 13, 33–42. http://doi.org/10.1007/s10460-006-9024-2
Kremer, P., & DeLiberty, T. L. (2011). Local food practices and growing potential: Mapping the case of Philadelphia. Applied Geography, 31(4), 1252–1261. http://doi.org/10.1016/j.apgeog.2011.01.007
41
climate change challenge? Journal of Environmental Studies and Sciences (Vol. 5).
http://doi.org/10.1007/s13412-015-0349-2
Martin, K., & Morales, T. (2015). Community Food System Assessments. PAS Memo.
Martin, S., & Andrée, P. (2012). The " buy local " challenge to institutional foodservice corporations in historical context. Journal of Agriculture, Food Systems, and Community Development, 2(23), 161– 175. http://doi.org/10.5304/jafscd.2012.023.008
Mount, P. (2012). Growing local food: Scale and local food systems governance. Agriculture and Human
Values, 29(1), 107–121. http://doi.org/10.1007/s10460-011-9331-0
Peters, C. (2010). Foodprints and Foodsheds: Models for evaluating dietary land requirements and the
capacity for local and regional food.
Peters, C., Bills, N., Lembo, A., Wilkins, J., & Fick, G. (2009). Mapping potential foodsheds in New York State: A spatial model for evaluating the capacity to localize food production. Renewable
Agriculture and Food Systems, 24(1), 72–84. http://doi.org/10.1017/S1742170508002457
Peters, C., Bills, N., Lembo, A., Wilkins, J., & Fick, G. (2012). Mapping potential foodsheds in New York State by food group: An approach for prioritizing which foods to grow locally. Renewable
Agriculture and Food Systems, 27(2), 125–137. http://doi.org/10.1017/S1742170511000196
Peters, C., Bills, N., Wilkins, J., & Fick, G. (2008). Foodshed analysis and its relevance to sustainability.
Renewable Agriculture and Food Systems, 24(1), 1–7. http://doi.org/10.1017/S1742170508002433
Peters, C., Wilkins, J., Rosas, S., Pepe, B., Picardy, J., & Fick, G. (2016). Engaging Stakeholders To Refine Models of State-level Food Self-reliance. Journal of Agriculture, Food Systems, and Community
Development, 6(4), 55–69. http://doi.org/10.5304/jafscd.2016.064.003
Peyton, B. (2012). Find Your Foodshed. Planning. Retrieved from
https://www.planning.org/planning/2012/jan/foodgroupsside.htm
Pothukuchi, K., & Kaufman, J. L. (2000). The food system: A stranger to the planning field. Journal of the
American Planning Association, 66(2), 113–124. http://doi.org/10.1080/01944360008976093
Powell, L. M., Auld, M. C., Chaloupka, F. J., O’Malley, P. M., & Johnston, L. D. (2007). Associations Between Access to Food Stores and Adolescent Body Mass Index. American Journal of Preventive
Medicine, 33(4 SUPPL.), 301–307. http://doi.org/10.1016/j.amepre.2007.07.007
Raja, S., Born, B., Russell, J. K., Adler, D., Allan, M., Allen, W., … Harries, C. (2008). A Planners Guide to Community and Regional Food Planning : Transforming Food Environments , Facilitating Healthy Eating. American Planning Association, (554), 1–50.
Research Triangle Regional Partnership. (2019). About RTRP. Retrieved March 8, 2019, from https://www.researchtriangle.org/about/
Smith, B. J., Kaiser, H. M., & Gómez, M. I. (2013). Identifying factors influencing a hospital’s decision to adopt a farm-to-hospital program. Agricultural and Resource Economics Review, 42(3), 508–517. http://doi.org/10.1017/S1068280500004962
42
conducting environmental carrying capacity analysis. Sustainability (Switzerland), 10(3). http://doi.org/10.3390/su10030882
Thompson, E., Harper, A. M., & Kraus, S. (2008). Think Globally, Eat Locally: San Francisco Foodshed
Assessment.
United States Department of Agriculture, & Farm Services Agency. (2019). Crop Acreage Data. Retrieved January 7, 2019, from
https://www.fsa.usda.gov/news-room/efoia/electronic-reading-room/frequently-requested-information/crop-acreage-data/index
United States Department of Agriculture, National Agricultural Statistics Service, & North Carolina Department of Agriculture and Consumer Services. (2018). News Release: 2017 Crop Summary for
North Carolina. Retrieved from
https://www.nass.usda.gov/Statistics_by_State/North_Carolina/Publications/Press_Releases/Crop Release01.pdf
USDA. (2011). Farm To Institution Initiatives. Retrieved from http://www.usda.gov/documents/6-Farmtoinstitution.pdf
Zasada, I., Schmutz, U., Wascher, D., Kneafsey, M., Corsi, S., Mazzocchi, C., … Piorr, A. (2017). Food beyond the city - Analysing foodsheds and self-sufficiency for different food system scenarios in European metropolitan regions. City, Culture and Society, (March), 0–1.