doi: 10.3389/fpsyg.2016.01016
Edited by:
Klaus Libertus, University of Pittsburgh, USA
Reviewed by:
Yoshifumi Ikeda, Joetsu University of Education, Japan Meghan Miller, UC Davis MIND Institute, USA
*Correspondence:
Tanya St. John [email protected]
Specialty section:
This article was submitted to Developmental Psychology, a section of the journal Frontiers in Psychology
Received:08 April 2016
Accepted:21 June 2016
Published:05 July 2016
Citation:
St. John T, Estes AM, Dager SR, Kostopoulos P, Wolff JJ, Pandey J, Elison JT, Paterson SJ, Schultz RT, Botteron K, Hazlett H and Piven J (2016) Emerging Executive Functioning and Motor Development in Infants at High and Low Risk for Autism Spectrum Disorder. Front. Psychol. 7:1016. doi: 10.3389/fpsyg.2016.01016
Emerging Executive Functioning and
Motor Development in Infants at High
and Low Risk for Autism Spectrum
Disorder
Tanya St. John1, 2*, Annette M. Estes1, 2, Stephen R. Dager2, 3, Penelope Kostopoulos4,
Jason J. Wolff5, Juhi Pandey6, Jed T. Elison7, Sarah J. Paterson6, Robert T. Schultz6,
Kelly Botteron8, Heather Hazlett9, 10and Joseph Piven9, 10
1Speech and Hearing Sciences, University of Washington, Seattle, WA, USA,2UW Autism Center, Center on Human
Development and Disability, University of Washington, Seattle, WA, USA,3Department of Radiology, University of
Washington, Seattle, WA, USA,4McConnell Brain Imaging Centre, Montreal Neurological Institute, Montreal, CA, USA, 5Department of Educational Psychology, University of Minnesota, Minneapolis, MN, USA,6Department of Pediatrics, The
Center for Autism Research, Children’s Hospital of Philadelphia, University of Pennsylvania, Philadelphia, PA, USA,7Institute
of Child Development, University of Minnesota, Minneapolis, MN, USA,8Department of Psychiatry, Washington University
School of Medicine, Saint Louis, MO, USA,9Carolina Institute for Developmental Disabilities, Chapel Hill, NC, USA, 10Department of Psychiatry, University of North Carolina, Chapel Hill, NC
Existing evidence suggests executive functioning (EF) deficits may be present in children with autism spectrum disorder (ASD) by 3 years of age. It is less clear when, prior to 3 years, EF deficits may emerge and how EF unfold over time. The contribution of motor skill difficulties to poorer EF in children with ASD has not been systematically studied. We investigated the developmental trajectory of EF in infants at high and low familial risk for ASD (HR and LR) and the potential associations between motor skills, diagnostic group, and EF performance. Participants included 186 HR and 76 LR infants. EF (A-not-B), motor skills (Fine and Gross Motor), and cognitive ability were directly assessed at 12 months and 24 months of age. Participants were directly evaluated for ASD at 24 months using DSM-IV-TR criteria and categorized as HR-ASD, HR-Negative, and LR-Negative. HR-ASD and HR-Negative siblings demonstrated less improvement in EF over time compared to the LR-Negative group. Motor skills were associated with group and EF performance at 12 months. No group differences were found at 12 months, but at 24 months, the HR-ASD and HR-Negative groups performed worse than the LR-Negative group overall after controlling for visual reception and maternal education. On reversal trials, the HR-ASD group performed worse than the LR-Negative group. Motor skills were associated with group and EF performance on reversal trials at 24 months. Findings suggest that HR siblings demonstrate altered EF development and that motor skills may play an important role in this process.
INTRODUCTION
Autism spectrum disorder (ASD) is a neurodevelopmental disorder characterized by deficits in social communication and repetitive behaviors (DSM-5,American Psychiatric Association, 2013). Core behavioral features of ASD appear to emerge within the first 2 years of life (seeBrian et al., 2008; Estes et al., 2015). Atypicalities associated with ASD include executive functioning (EF) deficits and motor impairments. The age at which EF deficits and motor impairments emerge in children who go on to develop ASD and their developmental trajectories are not well understood (Hughes et al., 1994; Hughes, 1996; Happé et al., 2006; Solomon et al., 2008; Corbett et al., 2009; Bhat et al., 2011). Although not considered defining features of ASD, deficits in these domains may be markers for later developmental problems and precede the unfolding of ASD symptoms in the first years of life.
EF refers to a set of cognitive functions that include attention, inhibition of behavior, working memory, cognitive flexibility, planning, and problem solving (Diamond, 2013). EF emerges progressively and increases in complexity with age during typical development (Best and Miller, 2010; Chevalier, 2015). The timing of the emergence of these functions and their developmental progression remains unclear (Diamond, 2002; Best and Miller, 2010; Jones et al., 2014). The ability to inhibit prepotent responses may be among the first functions to emerge (Chevalier, 2015). By 12 months of age infants can effectively inhibit their actions and engage their working memory to find a hidden toy (Diamond and Goldman-Rakic, 1989). There is even evidence of emerging working memory in 6-month old infants (Gilmore and Johnson, 1995). Cognitive flexibility may be the latest EF to emerge (Davidson et al., 2006; Garon et al., 2008). Research is needed to understand whether differences in EF emerge as part of early ASD symptoms and whether EF may be part of a developmental cascade that contributes to later deficits in individuals with ASD. A broad range of EF impairments have been found in individuals with ASD including impairments in planning, working memory, inhibiting behavior, and cognitive flexibility (Hughes et al., 1994; Hughes, 1996; Hill, 2004a; Happé et al., 2006; Solomon et al., 2008; Corbett et al., 2009). Verbal and Non-verbal IQ is related to performance of EF tasks measuring inhibition, working memory, and cognitive flexibility in children with ASD (Griffith et al., 1999; Dawson et al., 2002; Yerys et al., 2007; Faja et al., 2016). Evidence suggests that deficits in EF may be present in children with ASD by 3 years of age (McEvoy et al., 1993; Adrien et al., 2001; Holmboe et al., 2008), although not all studies support this finding (Griffith et al., 1999; Dawson et al., 2002; Yerys et al., 2007). Griffith et al. (1999), in one of the few longitudinal studies of EF in ASD, found that preschool-aged children with ASD committed the same number of perseverative errors on a spatial reversal task over time while a comparison group of children with developmental delay showed a trend reduction in errors on this task as they grew older. Cross-sectional studies further support the idea of altered EF trajectories of working memory and response inhibition in children with ASD. For example, Luna et al. (2007) found evidence that typically developing individuals improved their performance on a computerized task tapping working memory as
age increased whereas the ASD group did not. Similarly,Solomon et al. (2008)found that individuals with ASD did not improve their performance on a task assessing working memory and response inhibition as age increased but rather slightly worsened in their performance over time. All studies to date have focused on EF deficits after symptoms of ASD have manifested and relatively little is known about EF capabilities prior to and during the unfolding of ASD symptoms.
EF and motor development may be interrelated because of underlying neurobiology, as suggested by evidence from behavior-based tasks (Diamond, 2000). Functional neuroimaging studies have found co-activation in the dorsolateral prefrontal cortex and cerebellum on EF tasks such as the Wisconsin card sorting test (Berman et al., 1995) as well as on several working memory tasks not requiring motor-based responses (Awh et al., 1996; Desmond et al., 1997; Hautzel et al., 2009; Durisko and Fiez, 2010). Studies have also found that there are neuronal pathways linking the dorsolateral prefrontal cortex and neocerebellum (see
Diamond, 2000for further discussion). In typically developing infants, the experience of self-locomotion, such as walking, is associated with success on the A-not-B, a task measuring inhibition of prepotent responses and working memory (see
Smith et al., 1999). Various motor functions, such as reaching and standing, may also influence performance on the A-not-B (Smith et al., 1999). Furthermore, gross and fine motor skills have been associated with working memory, verbal fluency, and cognitive flexibility (Wassenberg et al., 2005; Livesey et al., 2006; Piek et al., 2008). Older children (12–13 years) with ASD have shown difficulty with tasks requiring simultaneous goal-directed and motor behavior (Hughes, 1996). Interestingly, interventions that improve motor skills in children with ASD may improve certain aspects of EF, such as working memory (Hilton et al., 2014). However, the contribution of early motor skill difficulties to the emergence of EF problems in children who later develop ASD has not been systematically studied.
In this study, we investigated the longitudinal patterns of EF performance in infant siblings at high and low risk for ASD. Siblings of children with ASD are at higher risk for developing ASD compared with siblings of children who do not have an older sibling with ASD. The recurrence rate of risk for ASD in HR siblings is estimated to be between 10 and 18 % (Constantino et al., 2010; Ozonoff et al., 2011) while the population prevalence rate is 1 in 681. High-risk (HR) infants, with older siblings with
ASD and low-risk infants (LR), with typically developing older sibling were divided into three outcome groups based on ASD diagnosis at 24 months; HR-ASD, (HR infants who developed ASD) HR-negative (HR infants who did not develop ASD), and LR-Negative (LR infants who did not develop ASD). It was hypothesized that the HR-ASD group would demonstrate less improvement in EF over time and lower EF at 12 and 24 months than the HR-Negative and LR-Negative groups. We further hypothesized that motor skills would be associated with EF performance and group.
METHODS
Participants
Infants at high-familial risk for ASD due to an older sibling with ASD (HR; n = 186) and low familial risk for ASD,
with typically developing older sibling and no family history of ASD (LR; n= 76) were included in this study. HR infants
had an older sibling who met criteria for ASD on the Social Communication Questionnaire (SCQ; Rutter et al., 2003) and Autism Diagnostic Interview, Revised (ADI-R;Lord et al., 1994) and had an ASD diagnosis, confirmed by medical records. LR infants had typically developing older siblings who did not meet cut off scores for ASD on the SCQ or Family Interview for Genetics Studies (FIGS; Maxwell, 1992) and had no first-degree relative with ASD or intellectual disability. All participants were screened and excluded based on the following: (1) birth weight <2000 g and/or gestational age < 36 weeks or significant perinatal adversity and/or exposure in utero
to neurotoxins, (2) medical/neurological conditions affecting growth, development, or cognition (e.g., seizure disorder) or significant sensory impairments (e.g., vision or hearing loss), (3) genetic conditions or syndromes, (4) adopted children or half siblings, (5) twins, (6) first-degree relative with psychosis, schizophrenia, or bipolar disorder (FIGS), (7) contraindication for MRI and, (8) predominant home language other than English.
Procedures
The sample included participants who provided valid A-not-B data at either the 12- or 24-month time point. Participants were recruited through research participant lists, flyers, brochures, email blasts, and community clinics at four clinical sites (Children’s Hospital of Philadelphia, University of Washington, University of North Carolina, and Washington University). Following eligibility screening, participants were assessed at 6, 12, and 24 months of age. Written informed consent, approved by each site’s Human Subjects Review Board, was obtained for all families.
Cognitive, social development, and EF performance were assessed by a licensed clinical psychologist, doctoral student in clinical psychology, school psychologist, or masters-level psychometrist under supervision of a licensed clinical psychologist or psychiatrist. At 24 months, all participants were assessed using the Mullen Scales of Early Learning (MSEL;
Mullen, 1995), the Autism Diagnostic Observation Schedule, Second Edition (ADOS-2; Lord et al., 2012) and ADI-R by research-reliable examiners. Each participant was assigned a clinical best estimate diagnosis made by two clinicians according to the DSM-IV-TR criteria to determine whether the child met the criteria for Autistic Disorder, Pervasive Developmental Disorder-Not Otherwise Specified, or neither. There were 30 high-risk infants meeting DSM-IV criteria for Autistic Disorder or PDD-NOS (HR-ASD), 138 high-risk infants not
meeting DSM-IV criteria for Autistic Disorder or PDD-NOS (HR-Negative), and 67 low-risk infantsnotmeeting DSM-IV-TR criteria for Autistic Disorder or PDD-NOS (LR-Negative).
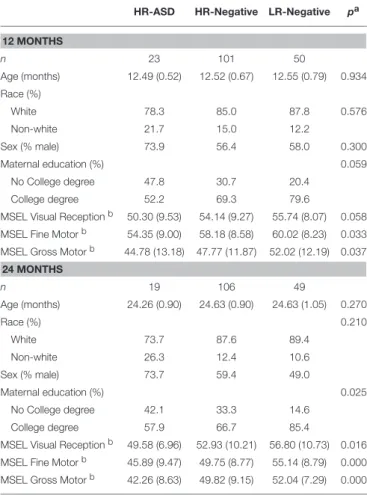
Table 1 presents demographic and descriptive information including age, gender, race, and maternal education. Groups did
not differ in age, race, or sex at either the 12- or 24-month assessment. However there were group differences in maternal education at 24 months,χ2(2,N=172) = 7.37,p=0.025 but not
12 months, χ2(2
,N=173) = 5.64, p = 0.059. Groups differed
significantly on MSEL Fine Motor skills at 12 months,F(2,171)
= 3.48, p = 0.033, and at 24 months, F(2,171) = 9.56, p < 0.001. Groups also differed significantly on MSEL Gross Motor skills at 12 and 24 monthsF(2,171)= 3.36,p=0.037,F(2,171)
=8.90,p<0.001, respectively. On the Visual Reception scale of the MSEL, groups differed significantly at 24 months but not at 12 months,F(2,171) =4. 21,p=0.016,F(2,171) =2.89, p=0.058, respectively. Floor and ceiling effects were assessed
across groups by examining score ranges. Few participants in any group fell at either the floor or ceiling values. Twenty-four participants with A-not-B had missing diagnostic outcome data and 3 LR siblings were diagnosed with ASD and, therefore, were not included in the analysis. In addition, 40 Negative, 13 HR-ASD, and 22 LR-Negative infants at 12 months (χ2 =0.83, p =0.662) and 20 HR-Negative, 9 HR-ASD, and 5 LR-Negative
infants at 24 months (χ2 = 7.11,p =0.029) did not provide
valid A-not-B data due to training failure, completion of too few trails (<10), or administration errors. Further details about the characteristics of this cohort can be found in Estes et al. (2015).
MEASURES
Executive Function
EF was assessed with the A-not-B task (Piaget, 1954) at 12 and 24 months. The A-not-B has been used as a measure of response inhibition and working memory in children as young as 6 months of age (Diamond, 1985; Diamond and Goldman-Rakic, 1989). The implementation of this task has varied across prior studies. In the current study the infant watched as a toy was hidden to the left or right of midline and was encouraged to find the toy after a delay of 5 s. Once the infant found the hidden toy on two consecutive trials, the side of hiding was reversed. The delay was increased to 12 s if the infant successfully completed two reversal trials. A maximum of 24 trials and 4 reversal trials were administered. Performance was measured by two criteria: (1) proportion of total correct reaches by total trials (working memory) and (2) the proportion of total correct reaches on reversal trials by total reversals trials (inhibition).
Cognitive Ability and Motor Skills
TABLE 1 | Study sample characteristics.
HR-ASD HR-Negative LR-Negative pa
12 MONTHS
n 23 101 50
Age (months) 12.49 (0.52) 12.52 (0.67) 12.55 (0.79) 0.934
Race (%)
White 78.3 85.0 87.8 0.576
Non-white 21.7 15.0 12.2
Sex (% male) 73.9 56.4 58.0 0.300
Maternal education (%) 0.059
No College degree 47.8 30.7 20.4
College degree 52.2 69.3 79.6
MSEL Visual Receptionb 50.30 (9.53) 54.14 (9.27) 55.74 (8.07) 0.058
MSEL Fine Motorb 54.35 (9.00) 58.18 (8.58) 60.02 (8.23) 0.033
MSEL Gross Motorb 44.78 (13.18) 47.77 (11.87) 52.02 (12.19) 0.037
24 MONTHS
n 19 106 49
Age (months) 24.26 (0.90) 24.63 (0.90) 24.63 (1.05) 0.270
Race (%) 0.210
White 73.7 87.6 89.4
Non-white 26.3 12.4 10.6
Sex (% male) 73.7 59.4 49.0
Maternal education (%) 0.025
No College degree 42.1 33.3 14.6
College degree 57.9 66.7 85.4
MSEL Visual Receptionb 49.58 (6.96) 52.93 (10.21) 56.80 (10.73) 0.016
MSEL Fine Motorb 45.89 (9.47) 49.75 (8.77) 55.14 (8.79) 0.000
MSEL Gross Motorb 42.26 (8.63) 49.82 (9.15) 52.04 (7.29) 0.000
aOmnibus ANOVA (Age, MSEL) and Chi-Square (race, maternal education, sex).
bT-scores.
ASD Symptoms
The Autism Diagnostic Observation Schedule, second edition (ADOS-2;Lord et al., 2012) is a semi-structured play assessment of communication, social interaction, play skills, and restricted interests/repetitive behavior. Module 1 was administered to all children at 24 months. Empirically derived algorithm scores, based on the severity and number of ASD symptoms demonstrated during the ADOS assessment, yield three classifications, Autism, Autism Spectrum, and Non-Spectrum.
The Autism Diagnostic Interview-Revised (ADI-R; Lord et al., 1994) is a semi-structured parent interview that assesses symptoms of ASD. The ADI-R was administered at 24 months to all parents of HR infants and all LR infants with ASD-related clinical concerns. The ADOS and ADI-R contributed to a clinical best estimate ASD diagnosis.
Statistical Analysis
EF development from ages 12 to 24 months was analyzed using generalized estimating equations (GEE) fit for a binomial distribution and exchangeable correlation matrix using SPSS version 19.0. Dependent variables included the proportion of total correct reaches by total trials (measuring working memory) and total correct reaches on reversal trials by total reversal trials (measuring response inhibition) on the A-not-B. Model
predictors included diagnostic group (HR-ASD, HR-Negative, and LR-Negative), maternal education, and the MSEL Visual Reception subscale. Cross-sectional group differences in EF were tested employing logistic regression at 12 and 24 months (see
Marcovitch and Zelazo, 1999) using the same dependent variables and model predictors. Separate regression models were run to determine if motor skills were associated with group and EF at 12 and 24 months using the same dependent variables and model predictors, with the addition of the MSEL Fine and Gross Motor subscales.
RESULTS
EF Development
Working MemoryThere was a significant main effect of Time (χ2 = 67.73, p
< 0.001) but not Group (χ2 = 3.91, p = 0.141) on working
memory (proportion of total correct reaches by total trials) after controlling for Visual Reception and maternal education. There was a significant Group x Time interaction for working memory with the LR-Negative group demonstrating improved performance from 12 to 24 months (χ2=48.60,p<0.001) and the HR-ASD (χ2 = 3.98,p =0.046) and HR-Negative (χ2 =
4.62,p=0.032) groups demonstrating less improvement than
LR-Negative group (seeFigure 1).
Response Inhibition
There was a significant main effect of Time (χ2 = 6.79,
p = 0.009) but not Group (χ2 = 2.15, p = 0.342) on
response inhibition (proportion of total correct reaches on reversal trials by total reversal trials) after controlling for Visual Reception and maternal education. The Group x Time interaction was significant for response inhibition with the LR-Negative group improving performance from 12 to 24 months and the HR-Negative group slightly worsening performance over time (χ2 = 5.48, p = 0.019; see Figure 2). The
HR-ASD group also worsened over time but no interaction effect was detected (χ2 =2.18,p=0.140).Post-hocanalysis, adding
the Fine and Gross Motor subscales as covariates, did not change the pattern or significance of the results reported above.
Group Differences in EF and Motor at 12 Months
Group differences in working memory
There was no significant main effect of group on working memory at 12 months after controlling for maternal education and Visual Reception (χ2 = 0.39, p = 0.822; see Model 1,
Table 2).
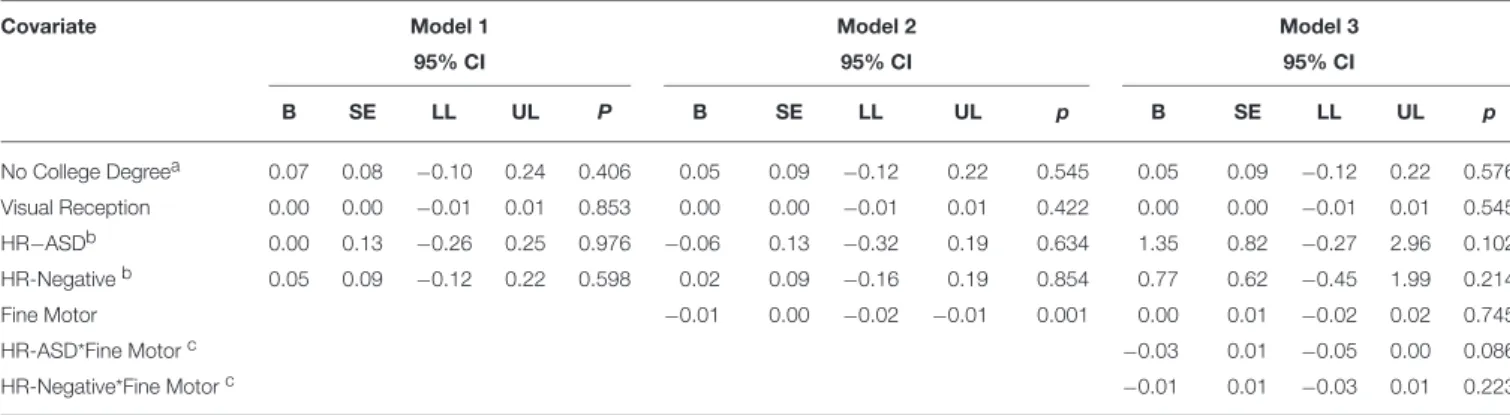
Fine motor and working memory
Lower Fine Motor scores were associated with better working memory at 12 months (χ2 = 10.52, p≤ 0.001, see Model 2,
Table 2). The Group×Fine Motor interaction at 12 months was
not significant (χ2=3.09,p=0.213; see Model 3,Table 2).
Gross motor and working memory
FIGURE 1 | Total correct reaches by total trials over time.
FIGURE 2 | Total correct reaches on reversal trials by total reversal trials over time.
The Group× Gross Motor interaction at 12 months was not
significant (χ2=0.13,p=0.938; see Model 3,Table 3).
Group differences in response inhibition
There was no significant main effect of group on response inhibition at 12 months after controlling for maternal education and Visual Reception (χ2 = 3.43, p = 0.180, see Model 1,
Table 4).
Fine motor and response inhibition
Lower Fine Motor scores were associated with better response inhibition at 12 months (χ2 = 4.00, p= 0.046, see Model 2,
Table 4). The Group × Fine Motor interaction at 12 months
was significant. The HR-ASD group demonstrated a negative association between Fine Motor scores and response inhibition
and the LR-Negative group demonstrated a positive relationship (χ2=5.10,p=0.024; see Model 3,Table 4).
Gross motor and response inhibition
There was no significant main effect of Gross Motor scores on response inhibition at 12 months (χ2 = 1.27, p = 0.258, see
Model 2,Table 5). The Group ×Gross Motor interaction was
not significant (χ2=1.39,p=0.498; see Model 3,Table 5).
Group Differences in EF and Motor at 24 months
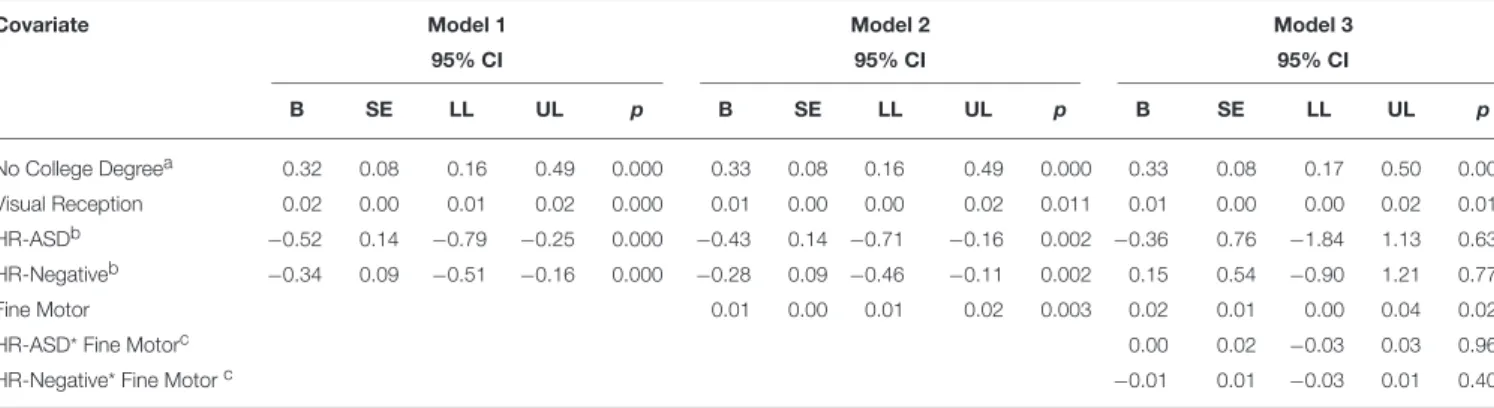
Group differences in working memory
TABLE 2 | Summary of model fit for working memory and fine motor at 12 months.
Covariate Model 1 Model 2 Model 3
95% CI 95% CI 95% CI
B SE LL UL P B SE LL UL p B SE LL UL p
No College Degreea 0.07 0.08 −0.10 0.24 0.406 0.05 0.09 −0.12 0.22 0.545 0.05 0.09 −0.12 0.22 0.576
Visual Reception 0.00 0.00 −0.01 0.01 0.853 0.00 0.00 −0.01 0.01 0.422 0.00 0.00 −0.01 0.01 0.545
HR−ASDb 0.00 0.13 −0.26 0.25 0.976 −0.06 0.13 −0.32 0.19 0.634 1.35 0.82 −0.27 2.96 0.102
HR-Negativeb 0.05 0.09 −0.12 0.22 0.598 0.02 0.09 −0.16 0.19 0.854 0.77 0.62 −0.45 1.99 0.214
Fine Motor −0.01 0.00 −0.02 −0.01 0.001 0.00 0.01 −0.02 0.02 0.745
HR-ASD*Fine Motorc −0.03 0.01 −0.05 0.00 0.086
HR-Negative*Fine Motorc −0.01 0.01 −0.03 0.01 0.223
aReference group=college degree.
bReference group=LR-Negative.
cReference group=LR-Negative*Fine Motor.
TABLE 3 | Summary of model fit for working memory and gross motor at 12 months.
Covariate Model 1 Model 2 Model 3
95% CI 95% CI 95% CI
B SE LL UL p B SE LL UL p B SE LL UL p
No College Degreea 0.07 0.08 −0.10 0.24 0.406 0.07 0.09 −0.10 0.23 0.444 0.06 0.09 −0.10 0.23 0.451
Visual Reception 0.00 0.00 −0.01 0.01 0.853 0.00 0.00 −0.01 0.01 0.625 0.00 0.00 −0.01 0.01 0.624
HR-ASDb 0.00 0.13 −0.26 0.25 0.976 0.02 0.13 −0.23 0.27 0.880 0.15 0.53 −0.90 1.19 0.780
HR-Negativeb 0.05 0.09 −0.12 0.22 0.598 0.07 0.09 −0.11 0.24 0.456 0.20 0.40 −0.57 0.98 0.611
Gross Motor 0.01 0.00 0.00 0.01 0.099 0.01 0.01 −0.01 0.02 0.264
HR-ASD* Gross Motorc 0.00 0.01 −0.02 0.02 0.811
HR-Negative* Gross Motorc 0.00 0.01 −0.02 0.01 0.726
aReference group=college degree.
bReference group=LR-Negative.
cReference group=LR-Negative*Gross Motor.
TABLE 4 | Summary of model fit for response inhibition and fine motor at 12 months.
Covariate Model 1 Model 2 Model 3
95% CI 95% CI 95% CI
B SE LL UL p B SE LL UL p B SE LL UL p
No Collegea 0.13 0.26 −0.39 0.64 0.621 0.09 0.26 −0.43 0.61 0.731 0.13 0.27 −0.39 0.66 0.616
Visual Reception 0.02 0.01 −0.01 0.05 0.115 0.03 0.01 0.00 0.06 0.040 0.03 0.01 0.00 0.06 0.062
HR-ASDb −0.01 0.40 −0.80 0.78 0.972 −0.18 0.41 −0.99 0.63 0.660 7.07 3.17 0.86 13.28 0.026
HR-Negativeb 0.43 0.27 −0.11 0.97 0.116 0.37 0.28 −0.18 0.91 0.185 3.12 2.11 −1.03 7.26 0.140
Fine Motor −0.03 0.01 −0.06 0.00 0.046 0.02 0.03 −0.04 0.08 0.571
HR-ASD * Fine Motorc −0.13 0.06 −0.25 −0.02 0.024
HR-Negative* Fine Motorc −0.05 0.03 −0.11 0.02 0.191
aReference group=college degree.
bReference group=LR-Negative.
cReference group=LR-Negative*Fine Motor.
= 18.83, p < 0.001; see Model 1, Table 6). Estimated marginal means and standard errors were generated from this model. Bonferroni corrected pair-wise comparisons further
indicated that the HR-ASD and HR-Negative groups did not differ significantly from each other (Omnibus χ2 = 19.67,
TABLE 5 | Summary of model fit for response inhibition and gross motor at 12 months.
Covariate Model 1 Model 2 Model 3
95% CI 95% CI 95% CI
B SE LL UL p B SE LL UL p B SE LL UL p
No Collegea 0.13 0.26 −0.39 0.64 0.621 0.16 0.26 −0.36 0.68 0.552 0.17 0.27 −0.35 0.69 0.524
Visual Reception 0.02 0.01 −0.01 0.05 0.115 0.03 0.01 0.00 0.05 0.074 0.03 0.01 0.00 0.06 0.063
HR-ASDb −0.01 0.40 −0.80 0.78 0.972 −0.08 0.41 −0.88 0.72 0.843 −0.53 1.71 −3.88 2.82 0.756
HR-Negativeb 0.43 0.27 −0.11 0.97 0.116 0.38 0.28 −0.17 0.92 0.176 −1.01 1.32 −3.59 1.57 0.443
Gross Motor −0.01 0.01 −0.03 0.01 0.258 −0.03 0.02 −0.08 0.01 0.169
HR-ASD* Gross Motorc 0.01 0.03 −0.06 0.08 0.833
HR-Negative* Gross Motorc 0.03 0.03 −0.02 0.08 0.280
aReference group=college degree.
bReference group=LR-Negative.
cReference group=LR-Negative*Gross Motor.
Fine motor and working memory
Higher Fine Motor scores were associated with better working memory (χ2=9.06,p=0.003, see Model 2,Table 6). The Group × Fine Motor interaction was not significant (χ2 =0.84,p=
0.656). In the interaction model there was no longer a significant main effect for group (see Model 3,Table 6).
Gross motor and working memory
There was no main effect for Gross Motor on working memory (χ2=2.73,p=0.098; see Model 2,Table 7). The Group×Gross
Motor interaction was also not significant (χ2=5.73,p=0.057).
However, in the interaction model, there was a significant main effect of Gross Motor skills on working memory (χ2=3.95,p=
0.047) and there was no longer a significant main effect for group (see Model 3,Table 7).
Group differences in response inhibition
There was a significant main effect of group on response inhibition at 24 months after controlling for Visual Reception and maternal education with the HR-ASD group and HR-Negative group performing worse than the LR-Negative group (χ2=7.39,
p=0.025; see Model 1,Table 7). Bonferonni corrected pair-wise
comparisons indicated that only the HR-ASD and LR-Negative groups differed (Omnibusχ2=7.85,p=0.020).
Fine motor and response inhibition
There was no main effect of Fine Motor scores on response inhibition at 24 months (χ2 = 3.56, p= 0.059; see Model 2,
Table 8). The Group × Fine Motor interaction was also not
significant (χ2 =3.18,p=0.204; see Model 3,Table 8). In the
interaction model, Fine Motor significantly predicted response inhibition (χ2=5.22,p=0.022) with the main effect for group
no longer reaching significance.
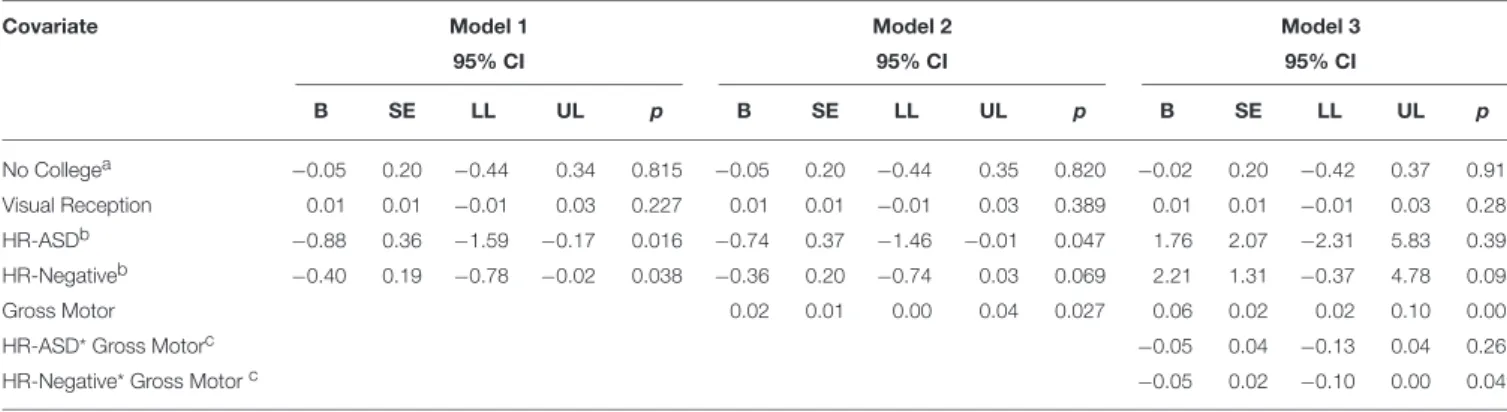
Gross motor and response inhibition
Higher Gross Motor scores were associated with better response inhibition at 24 months (χ2 = 4.90, p= 0.027; see Model 2,
Table 9). The Group by Gross Motor interaction was significant at 24 months with the HR-Negative and LR-Negative groups showing a positive relationship between Gross Motor and
performance on reversal trials but with the HR-Negative group demonstrating lower scores overall (χ2 =3.89,p=0.049; see
Model 3,Table 9).
DISCUSSION
The current study investigated the early emergence of EF in children at high and low risk for ASD, prior to the onset of the disorder. HR infants who later developed ASD and HR infants who did not develop ASD showed slower growth in working memory from 12 to 24 months of age than LR infants without ASD. The LR-Negative group showed improved response inhibition from 12 to 24 months while the ASD and HR-Negative groups showed little to no improvement in inhibition. At 12 months no group differences in working memory or inhibition were evident. Differences emerged by 24 months with the HR-ASD and HR-Negative groups demonstrating worse working memory and response inhibition than the LR-Negative group. These findings are consistent with prior research suggesting altered trajectories of EF in children with ASD (Griffith et al., 1999; Luna et al., 2007; Solomon et al., 2008). These findings are also consistent with emerging evidence that EF differences may be present in HR-Negative siblings (Hill, 2004b; Holmboe et al., 2010; Warren et al., 2012). This study is unique in providing the earliest evidence to date of EF differences in children with ASD, suggesting that these deficits may emerge in the second year of life, around the same time that the core symptoms of ASD are also emerging and consolidating.
TABLE 6 | Summary of model fit for working memory and fine motor at 24 months.
Covariate Model 1 Model 2 Model 3
95% CI 95% CI 95% CI
B SE LL UL p B SE LL UL p B SE LL UL p
No College Degreea 0.32 0.08 0.16 0.49 0.000 0.33 0.08 0.16 0.49 0.000 0.33 0.08 0.17 0.50 0.000
Visual Reception 0.02 0.00 0.01 0.02 0.000 0.01 0.00 0.00 0.02 0.011 0.01 0.00 0.00 0.02 0.011
HR-ASDb −0.52 0.14 −0.79 −0.25 0.000 −0.43 0.14 −0.71 −0.16 0.002 −0.36 0.76 −1.84 1.13 0.639
HR-Negativeb −0.34 0.09 −0.51 −0.16 0.000 −0.28 0.09 −0.46 −0.11 0.002 0.15 0.54 −0.90 1.21 0.776
Fine Motor 0.01 0.00 0.01 0.02 0.003 0.02 0.01 0.00 0.04 0.029
HR-ASD* Fine Motorc 0.00 0.02 −0.03 0.03 0.965
HR-Negative* Fine Motorc −0.01 0.01 −0.03 0.01 0.408
aReference group=college degree.
bReference group=LR-Negative.
cReference group=LR-Negative*Fine Motor.
TABLE 7 | Summary of model fit for working memory and gross motor at 24 months.
Covariate Model 1 Model 2 Model 3
95% CI 95% CI 95% CI
B SE LL UL p B SE LL UL p B SE LL UL p
No College Degreea 0.32 0.08 0.16 0.49 0.000 0.32 0.08 0.15 0.482 0.000 0.3 0.1 0.1 0.5 0.000
Visual Reception 0.02 0.00 0.01 0.02 0.000 0.02 0.00 0.01 0.022 0.000 0.0 0.0 0.0 0.0 0.000
HR-ASDb −0.52 0.14 −0.79 −0.25 0.000 −0.47 0.14 −0.75 −0.19 0.001 0.7 0.6 −0.5 1.9 0.244
HR-Negativeb −0.34 0.09 −0.51 −0.16 0.000 −0.32 0.09 −0.50 −0.147 0.000 −0.7 0.8 −2.3 0.9 0.403
Gross Motor 0.01 0.00 0.00 0.015 0.098 0.02 0.01 0.00 0.04 0.047
HR-ASD * Gross Motorc 0.01 0.02 −0.03 0.04 0.648
HR-Negative * Gross Motorc −0.02 0.01 −0.04 0.00 0.087
aReference group=college degree.
bReference group=LR-Negative.
cReference group=LR-Negative*Gross Motor.
TABLE 8 | Summary of model fit for response inhibition on reversal trials and fine motor at 24 months.
Covariate Model 1 Model 2 Model 3
95% CI 95% CI 95% CI
B SE LL UL p B SE LL UL p B SE LL UL p
No Collegea −0.05 0.20 −0.44 0.34 0.815 −0.03 0.20 −0.42 0.37 0.901 0.02 0.20 −0.38 0.42 0.927
Visual Reception 0.01 0.01 −0.01 0.03 0.227 0.00 0.01 −0.02 0.02 0.734 0.00 0.01 −0.02 0.02 0.727
HR-ASDb −0.88 0.36 −1.59 −0.17 0.016 −0.78 0.37 −1.50 −0.06 0.034 −0.21 1.85 −3.84 3.42 0.909
HR-Negativeb −0.40 0.19 −0.78 −0.02 0.038 −0.33 0.20 −0.72 0.06 0.098 1.71 1.23 −0.69 4.11 0.162
Fine Motor 0.02 0.01 0.00 0.04 0.059 0.04 0.02 0.01 0.08 0.022
HR-ASD* Fine Motorc −0.01 0.04 −0.08 0.06 0.816
HR-Negative* Fine Motorc −0.04 0.02 −0.08 0.01 0.090
aReference group=college degree.
bReference group=LR-Negative.
cReference group=LR-Negative*Fine Motor.
months, better fine and gross motor skills were associated with better working memory and response inhibition. Fine motor skills were not associated with group and EF but worse gross motor skills were associated with worse response inhibition. These findings are consistent with prior research reporting an
TABLE 9 | Summary of model fit for response inhibition and gross motor at 24 months.
Covariate Model 1 Model 2 Model 3
95% CI 95% CI 95% CI
B SE LL UL p B SE LL UL p B SE LL UL p
No Collegea −0.05 0.20 −0.44 0.34 0.815 −0.05 0.20 −0.44 0.35 0.820 −0.02 0.20 −0.42 0.37 0.917
Visual Reception 0.01 0.01 −0.01 0.03 0.227 0.01 0.01 −0.01 0.03 0.389 0.01 0.01 −0.01 0.03 0.286
HR-ASDb −0.88 0.36 −1.59 −0.17 0.016 −0.74 0.37 −1.46 −0.01 0.047 1.76 2.07 −2.31 5.83 0.396
HR-Negativeb −0.40 0.19 −0.78 −0.02 0.038 −0.36 0.20 −0.74 0.03 0.069 2.21 1.31 −0.37 4.78 0.093
Gross Motor 0.02 0.01 0.00 0.04 0.027 0.06 0.02 0.02 0.10 0.005
HR-ASD* Gross Motorc −0.05 0.04 −0.13 0.04 0.261
HR-Negative* Gross Motorc −0.05 0.02 −0.10 0.00 0.049
aReference group=college degree.
bReference group=LR-Negative.
cReference group=LR-Negative*Gross Motor.
Interestingly, HR-Negative siblings demonstrated differences in working memory compared to the LR-Negative group but not compared to the HR-ASD group, suggesting that EF differences may be a manifestation of genetic liability for ASD. Having atypical EF development could reflect a more general genetic vulnerability for developmental problems among HR siblings who do not develop full clinical symptoms of ASD. HR-Negative siblings may demonstrate a range of developmental problems such as lower developmental functioning, language delay, social difficulties, and greater internalizing problems (Landa et al., 2012; Georgiades et al., 2013; Messinger et al., 2013; Pisula and Ziegart-Sadowska, 2015). This is the first study of which we are aware to demonstrate that EF may be impaired in HR siblings who do not develop ASD. Some problems in HR-Negative siblings, such as language impairments and social-emotional problems, may be related to EF deficits, as suggested by the literature in non-ASD populations (Riggs et al., 2006; Henry et al., 2012). Future studies are needed to determine if EF and developmental problems are associated in HR-Negative siblings.
Another notable finding is that HR-ASD siblings had more difficulty inhibiting behavior than LR-Negative siblings at 24 months. The HR-Negative siblings did not differ significantly from either group and performed better than HR-ASD siblings but worse than LR-Negative siblings. It is possible that the working memory demands of the A-not-B were lower than the inhibitory demands which may indicate that children with ASD have more difficulty on tasks that put greater demand on the their EFs but that this may be less of a difficulty for HR siblings that do not go on the develop ASD. Underlying neural differences in HR-ASD siblings could account for differences in response inhibition. For example, decreased activation in the regions associated with inhibition on a behavioral inhibition task in children with ASD has been found (Kana et al., 2007). Another interesting finding was that EF differences in HR-ASD siblings were, in some cases, opposite of what was found in LR-Negative siblings. Again, this could be related to some altered, underlying brain-based process or be the effect of the type of EF that is being engaged. Finally, the impact of motor development on EF performance was noted earlier than overt differences in working memory and response
inhibition were observed. This pattern of early emerging, motor-based differences has been found in other studies of HR-ASD siblings (Bolton et al., 2012; Flanagan et al., 2012; Estes et al., 2015). However, the current study, to our knowledge, is the first to tie these differences to EF.
for objects may increase A-not-B performance in the younger ages. However, these considerations are not addressable with the current data set and future studies are needed to replicate and extend this work.
Early findings of EF deficits in school-age children and adults with ASD lead to the theory that EF deficits may be a primary deficit explaining both social and non-social ASD-related symptoms such as rigidity, repetitive behaviors and theory of mind deficits (seeHill, 2004afor review). However, EF deficits in individuals with ASD are not universal (Ozonoff and Strayer, 2001; Yerys et al., 2007) and over time it became clear that the data did not support the primary deficit hypothesis. Although we are looking at early manifestations of EF differences in ASD, we are not proposing that EF differences fully explain all ASD symptoms but instead suggest that they may contribute to some of the deficits observed in individuals with ASD.
Although the A-not-B is one of the most widely used and well-studied measures of EF in infants and young toddlers, it has important limitations. The A-not-B, used to measure EF, is not highly specific and does not simply measure one type of EF. It should also be noted that although working memory and response inhibition were discussed as being separate based on the type of trial administered, these variables are interrelated. Moreover, there are no published norms on the A-not-B and therefore the extent of EF dysfunction compared to same-aged peers is not clear. ASD diagnosis at 24-months demonstrates high classification stability over time among both clinically ascertained samples and HR sibling cohorts (Chawarska et al., 2007; Ozonoff et al., 2011; Rozga et al., 2011; Guthrie et al., 2013). However, there are potential limitations to using 24-month diagnosis or classification. In a recent study, 41% of HR siblings not initially diagnosed at 24-months were later diagnosed at 36 months (Ozonoff et al., 2015). Thus, our finding that the HR-Negative and HR-ASD groups did not differ on working memory and response inhibition could be due to some children in the HR-Negative group who may later meet diagnostic criteria for ASD. Longitudinal follow-up of these children is currently underway to assess whether changes in ASD outcomes occur over time and whether these changes reveal different patterns of early precursors to ASD.
Interestingly, our LR sample included 3 children (3.9%) who developed ASD. This rate is higher than the CDC prevalence estimate of 1.5%. Our study does not provide direct evidence for why this may have occurred. It is possible that there is a higher rate of false positive ASD diagnoses among the LR sample at 24 months. Alternatively, among our LR sample, parents with developmental concerns about other children in the family may be over represented despite screening out families with autism-related developmental concerns in older siblings. However, random sampling variability may also explain the prevalence rate of ASD in our LR sample. Since 1.5% is the point estimate in the general population, a rate of 3.9% would not likely be outside the bounds of what would be expected in random samples taken from the general population.
Studies assessing EF using a broader range of EF measures are needed (Bernier et al., 2010). This study only assessed EF twice, at 12 and 24 months. It appears that the deficits emerged
during the time period that was not assessed. Future studies are needed to assess the trajectory of EFs more densely over the second year of life. Further research on EF at 12 months as related to motor development and other functional outcomes such as adaptive functioning, temperament, and emotional regulation could help clarify potential downstream effects of early EF differences in HR infants. In addition, the relationship between 24-month performance on the A-not-B and later development is not measured in this study. Longitudinal follow up through preschool and early school age in infants at risk for autism is needed to elucidate the developmental sequelae of these early group differences. Finally, studies linking early brain and EF differences would elucidate the neurobiological underpinnings of executive dysfunction in ASD.
This study underscores the importance of addressing developmental phenomenon among unaffected high-risk siblings in relation to those who develop ASD. It also highlights the importance of studying EF and motor developmental processes early and over time. Finally, if the findings in this study are replicated, stronger evidence may exist for considering both EF and motor-based interventions for affected and unaffected high-risk siblings.
IBIS NETWORK
The Infant Brain Imaging Study (IBIS) Network is an NIH funded Autism Center of Excellence project and consists of a consortium of 8 universities in the U.S. and Canada. Clinical Sites: University of North Carolina: J. Piven (IBIS Network PI), H.C. Hazlett, C. Chappell; University of Washington: S. Dager, A. Estes, D. Shaw; Washington University: K. Botteron, R. McKinstry, J. Constantino, J. Pruett; Children’s Hospital of Philadelphia: R. Schultz, S. Paterson; University of Alberta: L. Zwaigenbaum; University of Minnesota: J. Elison; Data Coordinating Center: Montreal Neurological Institute: A.C. Evans, D.L. Collins, G.B. Pike, V. Fonov, P. Kostopoulos; S. Das; Image Processing Core: University of Utah: G. Gerig; University of North Carolina: M. Styner; Statistical Analysis Core: University of North Carolina: H. Gu
AUTHOR CONTRIBUTIONS
participated in manuscript revision, data interpretation, and study conception and design.
FUNDING
This work was supported by an NIH Autism Center of Excellence grant (NIMH and NICHD #HD055741 and HD055741), NIH Intellectual and Developmental Disabilities Research Center
grant (#U54HD083091), the Simons Foundation (SFARI Grant 140209), and Autism Speaks (6020).
ACKNOWLEDGMENTS
The authors thank the all the IBIS families for their participation in this longitudinal study. A special thank you to Dr. Flaherty who consulted on the statistical methods.
REFERENCES
Adrien, J. L., Rossignol-Deletang, N., Martineau, J., Couturier, G., and Barthelemy, C. (2001). Regulation of cognitive activity and early communication development in young autistic, mentally retarded, and young normal children.
Dev. Psychobiol.39, 124–136. doi: 10.1002/dev.1036
American Psychiatric Association (2013).Diagnostic and Statistical Manual of Mental Disorders. 5th Edn. Arlington, VA: American Psychiatric Association. Awh, E., Jonides, J., Smith, E. E., Schumacher, E. H., Koeppe, R. A., and Katz,
S. (1996). Association of storage and rehearsal in verbal working memory: evidence from positron emission tomography. Psychol. Sci.7, 25–31. doi: 10.1111/j.1467-9280.1996.tb00662.x
Berman, K. F., Ostrem, J. L., Randolf, C., Gold, J., Goldberg, T., Coppola, R., et al. (1995). Physiological activation of a cortical network during performance of the wisconsin card sorting test: positron emission tomophrahy study.
Neuropsychologia33, 1027–1046. doi: 10.1016/0028-3932(95)00035-2 Bernier, A., Carlson, S. M., and Whipple, N. (2010). From external regulation
to self-regulation: early parenting precursors of young children’s executive functioning.Child Dev.81, 326–339. doi: 10.1111/j.1467-8624.2009.01397.x Best, J. R., and Miller, P. H. (2010). A developmental perspective on executive
function.Child Dev.81, 1641–1660. doi: 10.1111/j.1467-8624.2010.01499.x Bhat, A., Landa, R., and Galloway, J. (2011). Current perspectives on motor
functioning in infants, children, and adults with autism spectrum disorders.
Phys. Ther.91, 1116–1129. doi: 10.2522/ptj.20100294
Bolton, P. F., Golding, J., Emond, A., and Steer, C. D. (2012). Autism spectrum disorder and autistic traits in the Avon Longitudinal Study of Parents and Children: precursors and early signs.J. Am. Acad. Child Adolesc. Psychiatry51, 249–260. doi: 10.1016/j.jaac.2011.12.009
Brian, J., Bryson, S. E., Garon, N., Roberts, W., Smith, I. M., Szatmari, P., et al. (2008). Clinical assessment of autism in high-risk 18-month-olds.Autism12, 433–456. doi: 10.1177/1362361308094500
Chawarska, K., Klin, A., Paul, R., and Volkmar, F. (2007). Autism spectrum disorder in the second year: stability and change in syndrome expression.J. Child Psychol. Psychiatry48, 128–138. doi: 10.1111/j.1469-7610.2006.01685.x Chevalier, N. (2015). The development of executive function: toward more
optimal coordination of control with age.Child Dev. Perspect.9, 239–244. doi: 10.1111/cdep.12138
Constantino, J. N., Zhang, Y., Frazier, T., Abbacchi, A., and Law, P. (2010). Sibling recurrence and the genetic epidemiology of autism.Am. J. Psychiatry 167, 1349–1356. doi: 10.1176/appi.ajp.2010.09101470
Corbett, B. A., Constantine, L. J., Hendren, R., Rocke, D., and Ozonoff, S. (2009). Examining executive functioning in children with autism spectrum disorder, attention deficit hyperactivity disorder and typical development.Psychiatry Res.
166, 210–222. doi: 10.1016/j.psychres.2008.02.005
Corbetta, D., and Bojczyk, K. E. (2002). Infants return to two-handed reaching when they are learning to walk. J. Mot. Behav. 34, 83–95. doi: 10.1080/00222890209601933
Davidson, M. C., Amso, A., Anderson, L. C., and Diamond, A. (2006). Development of cognitive control and executive functions from 4 to 13 year: evidence from manipulations of memory, inhibition, and task switching.
Neuropsychologia44, 2037–2078. doi: 10.1016/j.neuropsychologia.2006.02.006 Dawson, G., Webb, S., Schellenberg, G. D., Dager, S., Friedman, S., Aylward, E., et al. (2002). Defining the broader phenotype of autism: genetic, brain, and behavioral perspectives. Dev. Psychopathol. 14, 581–611. doi: 10.1017/S0954579402003103
Desmond, J. E., Gabrieli, J. D. E., Wagner, A. D., Ginier, B. L., and Glover, G. H. (1997). Lobular patterns of cerebellar activation in verbal working-memory and finger-tapping tasks as revealed by functional MRI.J. Neurosci.17, 9675–9685.
Diamond, A. (1985). Development of the ability to use recall to guide action, as indicated by infants’ performance on AB.Child Dev.56, 868–883. doi: 10.2307/1130099
Diamond, A. (2000). Close interrelation of motor development and cognitive development and of the cerebellum and prefrontal cortex.Child Dev.71, 44–56. doi: 10.1111/1467-8624.00117
Diamond, A. (2002). “Normal development of prefrontal cortex from birth to young adulthood: cognitive functions, anatomy, and biochemistry,” in
Principles of Frontal Lobe Function, eds D. T. Stuss and R. T. Knight (New York, NY: Oxford University Press), 466–503.
Diamond, A. (2013). Executive functions.Annu. Rev. Psychol.64, 135–168. doi: 10.1146/annurev-psych-113011-143750
Diamond, A., and Goldman-Rakic, P. S. (1989). Comparison of human infants and rhesus monkeys on Piaget’s AB task: evidence for dependence on dorsolateral prefrontal cortex.Exp. Brain Res.74, 24–40. doi: 10.1007/BF002 48277
Durisko, C., and Fiez, J. (2010). Functional activation of the cerebellum during working memory and simple speech tasks.Cortex46, 896–906. doi: 10.1016/j.cortex.2009.09.009
Estes, A., Zwaigenbaum, L., Gu, H., St. John, T., Paterson, S., Elison, J. T., et al. (2015). Behavioral, cognitive, and adaptive development in infants with autism spectrum disorder in the first 2 years of life.J. Neurodev. Disord.7, 1–10. doi: 10.1186/s11689-015-9117-6
Faja, S., Sullivan, K., Meltzoff, A., Estes, A., and Bernier, R. (2016). Executive function predicts the development of play skills for verbal preschoolers with autism spectrum disorders.Autism Res. doi: 10.1002/aur.1608. [Epub ahead of print].
Flanagan, J. E., Landa, R., Bhat, A., and Bauman, M. (2012). Head lag in infants at risk for autism: a preliminary study.Am. J. Occup. Ther.66, 577–585. doi: 10.5014/ajot.2012.004192
Garon, N., Bryson, S. E., and Smith, I. M. (2008). Executive function in preschoolers: a review using an integrative framework.Psychol. Bull. 134, 31–60. doi: 10.1037/0033-2909.134.1.31
Georgiades, S., Szatmari, P., Zwaigenbaum, L., Bryson, S., Brian, J., Roberts, W., et al. (2013). A prospective study of autistic-like traits in unaffected siblings of probands with autism spectrum disorder.JAMA Psychiatry70, 42–48. doi: 10.1001/2013.jamapsychiatry.1
Gilmore, R., and Johnson, M. (1995). Working memory in infancy: six-month olds’ performance on two versions of the oculomotor delayed response task.J. Exp. Child Psychol.59, 397–418. doi: 10.1006/jecp.1995.1019
Griffith, E. M., Pennington, B. F., Wehner, E., and Rogers, S. J. (1999). Executive functions in young children with autism. Child Dev. 70, 817–832. doi: 10.1111/1467-8624.00059
Guthrie, W., Swineford, L. B., Nottke, C., and Wetherby, A. M. (2013). Early diagnosis of autism spectrum disorder: stability and change in clinical diagnosis and symptom presentation. J. Child Psychol. Psychiatry 54, 582–590. doi: 10.1111/jcpp.12008
Hautzel, H., Mottaghy,F. M., Specht, K., Müller, H.-W., and Krause, B.J. (2009). Evidence of a modatlity-dependent role of the cerebellum in working memory? An fmri study comparing verbal and abstract n-back tasks.Neuroimage47, 2073–2082. doi: 10.1016/j.neuroimage.2009.06.005
Henry, L., Messer, D. J., and Nash, G. (2012). Executive functioning in children with specific language impairment.J. Child Psychol. Psychiatry53, 37–45. doi: 10.1111/j.1469-7610.2011.02430.x
Hill, E. L. (2004a). Evaluating the theory of executive dysfunction in autism.Dev. Rev.24, 189–233. doi: 10.1016/j.dr.2004.01.001
Hill, E. L. (2004b). Executive dysfunction in autism.Trends Cogn. Sci.8, 26–32. doi: 10.1016/j.tics.2003.11.003
Hilton, C. L., Cumpata, K., Klohr, C., Gaetke, S., Artner, A., Johnson, H., et al. (2014). Effects of exergaming on executive function and motor skills in children with autism spectrum disorder: a pilot study.Am. J. Occup. Ther.68, 57–65. doi: 10.5014/ajot.2014.008664
Holmboe, K., Elsabbagh, M., Volein, A., Tucker, L. A., Baron-Cohen, S., Bolton, P., et al. (2010). Frontal cortex functioning in the infant broader autism phenotype.
Infant Behav. Dev.33, 482–491. doi: 10.1016/j.infbeh.2010.05.004
Holmboe, K., Fearon, R. M. P., Csibra, G., Tucker, L. A., and Johnson, M. H. (2008). Freeze-Frame: a new infant inhibition task and its relation to frontal cortex tasks during infancy and early childhood.J. Exp. Child Psychol.100, 89–114. doi: 10.1016/j.jecp.2007.09.004
Hughes, C. (1996). Brief report: planning problems in autism at the level of motor control.J. Autism Dev. Disord.26, 99–107. doi: 10.1007/BF02276237 Hughes, C., Russell, J., and Robbins, T. W. (1994). Evidence for executive
dysfunction in autism. Neuropsychologia 32, 477–492. doi: 10.1016/0028-3932(94)90092-2
Jones, E., Gliga, T., Bedford, R., Charman, T., and Johnson, M. (2014). Developmental pathways to autism: a review of prospective studies of infants at risk.Neurosci. Biobehav. Rev.39, 1–33. doi: 10.1016/j.neubiorev.2013.12.001 Kana, R., Keller, T., Minshew, N., and Just, M. A. (2007). Inhibitory control in high-functioning autism: decreased activation and underconnectivity in inhibition networks.Biol. Psychiatry.62, 198–206. doi: 10.1016/j.biopsych.2006. 08.004
Karasik, L. B., Tamis-LeMonda, C. S., and Adolph, K. E. (2011). Transition from crawling to walking and infants’ actions with objects and people.Child Dev.82, 1199–1209. doi: 10.1111/j.1467-8624.2011.01595.x
Landa, R. J., Gross, A. L., Stuart, E. A., and Bauman, M. (2012). Latent class analysis of early developmental trajectory in baby siblings of children with autism.J. Child Psychol. Psychiatry53, 986–996. doi: 10.1111/j.1469-7610.2012. 02558.x
Livesey, D., Keen, J., Rouse, J., and White, F. (2006). The relationship between measures of executive function, motor performance and externalising behaviour in 5- and 6-year-old children. Hum. Mov. Sci. 25, 50–64. doi: 10.1016/j.humov.2005.10.008
Lord, C., Rutter, M., and Couteur, A. (1994). Autism diagnostic interview-revised: a revised version of a diagnostic interview for caregivers of individuals with possible pervasive developmental disorders.J. Autism Dev. Disord.24, 659–685. doi: 10.1007/BF02172145
Lord, C., Rutter, M., DiLavore, P. C., Risi, S., Gotham, K., and Bishop, S. L. (2012).
Autism Diagnostic Observation Schedule, 2nd Edn. (ADOS-2) Manual (Part I): Modules 1-4. Torrance, CA: Western Psychological Services.
Luna, B., Doll, S. K., Hegedus, S. J., Minshew, N. J., and Sweeney, J. A. (2007). Maturation of executive function in autism.Biol. Psychiatry61, 474–481. doi: 10.1016/j.biopsych.2006.02.030
Marcovitch, S., and Zelazo, P. D. (1999). The A-not-B error: results from a logistic meta-analysis.Child Dev.70, 1297–1313. doi: 10.1111/1467-8624.00095 Maxwell, M. (1992).Manual for the Family Interview for Genetic Studies (FIGS).
Bethesda, MD: National Institute of Mental Health.
McEvoy, R., Rogers, S., and Pennington, B. (1993). Executive function and social communication deficits in young autistic children.J. Child Psychol. Psychiatry
34, 563–578. doi: 10.1111/j.1469-7610.1993.tb01036.x
Messinger, D., Young, G. S., Ozonoff, S., Dobkins, K., Carter, A., Zwaigenbaum, L., et al. (2013). Beyond autism: a baby siblings research consortium study of high-risk children at three years of age.J. Am. Acad. Child Adolesc. Psychiatry
52, 300–308. doi: 10.1016/j.jaac.2012.12.011
Mullen, E. M. (1995).Mullen Scales of Early Learning: AGS edition. Circle Pines, MN: American Guidance Service Publishing.
Ozonoff, S., and Strayer, D. L. (2001). Further evidence of intact working memory in autism.J. Autism Dev. Disord.31, 257–263. doi: 10.1023/A:1010794902139 Ozonoff, S., Young, G. S., Carter, A., Messinger, D., Yirmiya, N., Zwaigenbaum,
L., et al. (2011). Recurrence risk for autism spectrum disorders: a baby siblings research consortium study.Pediatrics128, e488–e495. doi: 10.1542/peds.2010-2825
Ozonoff, S., Young, G. S., Landa, R. J., Brian, J., Bryson, S., Charman, T., et al. (2015). Diagnostic stability in young children at risk for autism spectrum disorder: a baby siblings research consortium study.J. Child Psychol. Psychiatry
56, 988–998. doi: 10.1111/jcpp.12421
Piaget, J. (1954).The Construction of Reality in the Child. New York, NY: Basic. Piek, J., Dawson, L., Smith, L., and Gasson, N. (2008). The role of early fine and
gross motor development on later motor and cognitive ability.Hum. Mov. Sci.
27, 668–681. doi: 10.1016/j.humov.2007.11.002
Pisula, E., and Ziegart-Sadowska, K. (2015). Broader autism phenotype in siblings of children with ASD—a review.Int. J. Mol. Sci. 16, 13217–13258. doi: 10.3390/ijms160613217
Riggs, N. R., Jahromi, L. B., Razza, R. P., Dillworth-Bart, J. E., and Müeller, U. (2006). Executive function and the promotion of social-emotional competence.
J. Appl. Dev. Psychol.27, 300–309. doi: 10.1016/j.appdev.2006.04.002 Rozga, A., Huntman, T., Young, G. S., Rogers, S. J., Ozonoff, S., Dapretto, M., et al.
(2011). Behavioral profiles of affected and unaffected siblings of children with autism: contribution of measures of mother-infant interaction and nonverbal communication.J. Autism Dev. Disord.41, 287–301. doi: 10.1007/s10803-010-1051-6
Rutter, M., Bailey, A., Lord, C., and Berument, S. (2003).Social Communication Questionnaire. Los Angeles, CA: Western Psychological Services.
Smith, L. B., Thelen, E., Titzer, R., and McLin, D. (1999). Knowing in the context of acting: the task dynamics of the A-not-B error.Psychol. Rev.106, 235–260. doi: 10.1037/0033-295X.106.2.235
Solomon, M., Ozonoff, S. J., Cummings, N., and Carter, C. S. (2008). Cognitive control in autism spectrum disorders.Int. J. Dev. Neurosci.26, 239–247. doi: 10.1016/j.ijdevneu.2007.11.001
Warren, Z. E., Foss-Feig, J. H., Malesa, E. E., Lee, E. B., Taylor, J. L., Newsom, C. R., et al. (2012). Neurocognitive and behavioral outcomes of younger siblings of children with autism spectrum disorder at age five.J. Autism Dev. Disord.42, 409–418. doi: 10.1007/s10803-011-1263-4
Wassenberg, R., Kessels, A., Kalff, A., Hurks, P., Jolles, J., Feron, F., et al. (2005). Relation between cognitive and motor performance in 5- to 6-year-old children: results from a large-scale cross-sectional study.Child Dev.76, 1092–1103. doi: 10.1111/j.1467-8624.2005.00899.x
Yerys, B. E., Hepburn, S. L., Pennington, B. F., and Rogers, S. J. (2007). Executive function in preschoolers with autism: evidence consistent with a secondary deficit.J. Autism Dev. Disord.37, 1068–1079. doi: 10.1007/s10803-006-0250-7
Conflict of Interest Statement: The authors declare that the research was conducted in the absence of any commercial or financial relationships that could be construed as a potential conflict of interest.