CHARACTERIZATION OF CHROMATIN DYSREGULATION IN CANCER THROUGH ANALYSIS OF FRESH AND ARCHIVAL HUMAN SAMPLES
JEREMY M. SIMON
A dissertation submitted to the faculty of the University of North Carolina at Chapel Hill in partial fulfillment of the requirements for the degree of Doctor of Philosophy in the Curricu-lum in Bioinformatics and Computational Biology.
Chapel Hill 2013
c
2013
ABSTRACT
Jeremy M. Simon: Characterization of chromatin dysregulation in cancer through analysis of fresh and archival human samples.
(Under the direction of Ian J. Davis.)
ACKNOWLEDGMENTS
This work would not have been possible without the support of my advisors, Ian Davis and Jason Lieb. Their guidance over the last five years has been unrelenting. My development as a scientist, a scientific writer, and my independence are all a direct consequence of your mentorship. You also have each set up an environment in which I could obtain invaluable feedback on my work. Our labs have seen a lot of change over the years, particularly growth, but each member of the Davis and Lieb labs have fostered my development. I would like to specifically acknowledge Paul Giresi, Kohta Ikegami, Dan McKay, Morten Jensen, Colin Lickwar, Mukund Patel, and Nick Gomez for their training and assistance getting my projects started. For their continued support, in combination with that of every other Davis and Lieb lab member, I am truly grateful.
The environment in which I conducted this and other work has also been highly collabo-rative. In my first two years, I worked very closely with Kyle Gaulton, who also contributed greatly to my success. More recently, close collaboration with Kim Rathmell and Kate Hacker, as well as Brian Strahl and Billy Kim, has proven to be not only be highly successful, but also hugely helpful to my development. Jeff Roach also assisted greatly in setting up and main-taining various computational needs through UNC ITS.
I would also like to thank the rest of my thesis committee: Corbin Jones, Chuck Perou, Terry Furey, and Tim Elston. You have each provided incredibly helpful feedback, construc-tive criticism, and guidance both within the confines of official committee meetings or through quick responses by email. Corbin, you have always been like a scientific uncle to me, you have provided endless recommendations and enlightenment, much of which occurring over oft-needed beer.
trivia nights, or the countless other scientific or non-scientific gatherings have been truly helpful in balancing out our otherwise stressful lives. In particular, I’d like to specifically thank Matt Berginski, Stephen Bush, John Didion, Tess Jeffers, Will Jeck, Michael Iglesia, Damien Croteau-Chonka, and Toby Clarke for the many unforgettable and enjoyable times we’ve shared.
TABLE OF CONTENTS
LIST OF FIGURES . . . xi
LIST OF ABBREVIATIONS . . . xiv
1 INTRODUCTION . . . 1
1.1 Initial discoveries from tumor genome sequencing . . . 2
1.2 Chromatin structure, histone modifications, and regulation of gene expression 3 1.3 Epigenetics of cancer . . . 4
1.4 Isolation of active regulatory elements from human chromatin . . . 5
1.5 Epigenetic therapies in cancer . . . 7
1.6 Thesis contributions . . . 7
2 TUMOR-SPECIFIC RETARGETING OF AN ONCOGENIC TRANSCRIPTION FACTOR CHIMERA RESULTS IN DYSREGULATION OF CHROMATIN AND TRANSCRIPTION . . . 9
2.1 Introduction . . . 9
2.2 Results . . . 11
2.2.1 Chimerism and cell lineage influence genomic targeting . . . 11
2.2.2 EWS-FLI and FLI regulate divergent gene programs . . . 16
2.2.3 Differentially targeted regions are marked by DNA sequence and regulatory variation . . . 19
2.2.4 Chimerism retargets EWS-FLI to tandem tetranucleotide repeats . . . 24
2.2.6 Epigenetic factors distinguish microsatellite repeats in Ewing Sarcoma 32 2.2.7 EWS-FLI targets enhancer like elements altering and
maintaining the local chromatin environment . . . 36
2.3 Discussion . . . 38
2.4 Methods . . . 43
2.4.1 Cell culture . . . 43
2.4.2 Lentiviral knockdown-expression . . . 44
2.4.3 Chromatin Immunoprecipitation (ChIP) and Formaldehyde-Assisted Isolation of Regulatory Elements (FAIRE) . . . 44
2.4.4 Quality Control and Reference Genome Alignment . . . 44
2.4.5 Peak calling and permutation . . . 45
2.4.6 Hierarchical Clustering and Motif Identification . . . 45
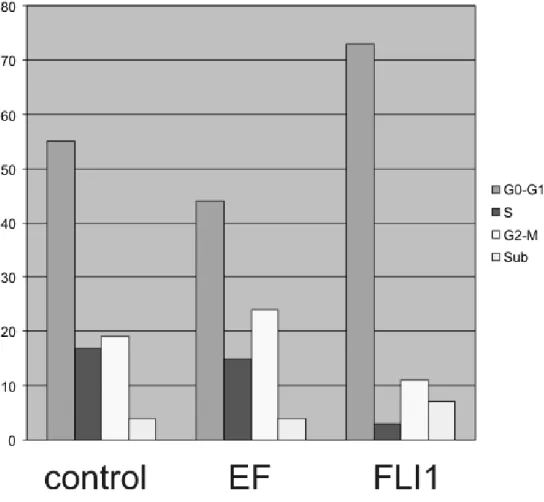
2.4.7 Flow Cytometry . . . 46
3 VARIATION IN CHROMATIN ACCESSIBILITY IN HUMAN KIDNEY CANCER LINKS H3K36 METHYLTRANSFERASE LOSS WITH WIDESPREAD RNA PROCESSING DEFECTS . . . 47
3.1 Introduction . . . 47
3.2 Results . . . 49
3.2.1 Differences in chromatin accessibility between tumors and normal kidney tissue corroborate the underlying role of HIF in ccRCC . . . 49
3.2.2 SETD2mutations link H3K36me3 loss with changes in chromatin accessibility . . . 50
3.2.3 SETD2mutation is associated with DNA hypomethylation proximal to sites of nucleosome depletion . . . 60
3.2.5 Widespread RNA processing defects linked withSETD2 mutations persist in the mature RNA pool and are
marked by altered chromatin accessibility . . . 62
3.3 Discussion . . . 67
3.4 Methods . . . 76
3.4.1 Formaldehyde-Assisted Isolation of Regulatory Elements (FAIRE-seq) and hierarchical clustering of differentially open chromatin . . . 76
3.4.2 Re-processing of HIF1A, HIF2A, and ARNT ChIP-seq data . . . 76
3.4.3 Ontologies associated with differentially open chromatin . . . 77
3.4.4 Motif analysis . . . 77
3.4.5 SureSelect custom capture and mutation calling . . . 77
3.4.6 Histone methylation ChIP-seq and data processing . . . 77
3.4.7 Feature overlap permutations . . . 78
3.4.8 Tissue Microarray Construction and Immunohistochemistry . . . 78
3.4.9 Intron retention estimates by RNA-seq . . . 79
3.4.10 Quantitative RT-PCR . . . 79
3.4.11 Differential splicing analysis . . . 80
4 ISOLATION OF REGULATORY ELEMENTS FROM ARCHIVAL HUMAN SPECIMENS USING FAIRE . . . 81
4.1 Introduction . . . 81
4.2 Results . . . 83
4.2.1 FFPE-FAIRE shows high concordance with frozen tissue and cultured cells in controlled xenograft system . . . 83
4.2.2 FFPE-FAIRE is robust to as few as 1 x 10⁶cells . . . 85
4.2.3 Ongoing work . . . 85
4.3 Discussion . . . 87
4.4.1 Xenograft model and estimation of tumor nuclei density . . . 88 4.4.2 FFPE-FAIRE . . . 88 4.4.3 Reanalysis of EWS-FLI binding sites and GGAA microsatellites . . . 89 4.4.4 ChIN score calculation . . . 89
5 CONCLUSIONS AND FUTURE DIRECTIONS . . . 91
LIST OF FIGURES
1.1 Disproportionate frequency of chromatin regulator mutations
in pediatric and hematological cancers . . . 6
2.1 Experimental schema for lineage-specific transcription factor silencing and expression . . . 13
2.2 Cell cycle profile of Ewing Sarcoma cells . . . 14
2.3 Chimerism alters ETS-mediated targeting . . . 15
2.4 The range of factor- and cell-type-specific binding;NR0B1 . . . 17
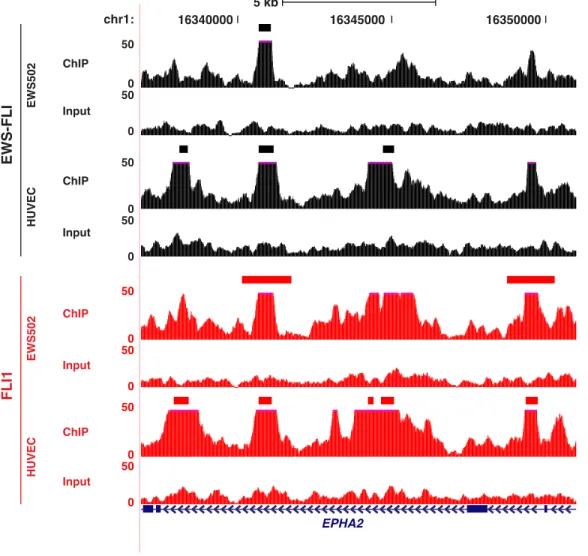
2.5 The range of factor- and cell-type-specific binding;EPHA2 . . . 18
2.6 Differentially expressed genes in endothelial and Ewing cells . . . 20
2.7 EWS-FLI and FLI1 differentially expressed genes have distinct biological functions . . . 21
2.8 Hierarchical clustering identifies cell- and transcription factor-specific variation in genomic targeting . . . 24
2.9 EWS-ETS fusions target GGAA-containing microsatellite repeats . . . 25
2.10 Annotation of clusters of binding sites using GREAT shows biologically relevant associations with ontologies . . . 27
2.11 Upregulated genes are closer to EWS-FLI binding sites . . . 28
2.12 FLI1 binding sites are closer to FLI1 differentially expressed genes . . . 29
2.13 EWS-FLI-bound tetranucleotide repeats demonstrate repeat length polymorphism . . . 31
2.14 EWS-FLI and FLI1 occupied similar sites in a normal cellular context . . . . 33
2.15 Permutation abolished EWS-FLI and FLI1 signal enrichment at all identified sites . . . 34
2.17 UCSC Genome Browser snapshots of epigenetic patterns
in EWS502 (black), HUVEC (orange), and H1hESC (green) . . . 37 2.18 UCSC Genome Browser snapshots of epigenetic patterns
in EWS502 (black), HUVEC (orange), and H1hESC (green) . . . 38 2.19 Epigenetics and chromatin accessibility of GGAA microsatellites . . . 39 2.20 Predicted nucleosome occupancy of EWS-FLI and FLI1 binding sites . . . . 40 2.21 EWS-FLI is capable of epigenetic reprogramming . . . 41
3.1 Schematic representation of dataset integration and genomic site identification 52 3.2 Regions of tumor-specific nucleosome eviction identify the underlying
role of HIF in ccRCC . . . 54 3.3 Gene ontology associations with sites in Clusters 1–3 . . . 55 3.4 SETD2 mutations link H3K36me3 loss with changes in chromatin accessibility 57 3.5 META-gene plot of H3K36me3 ChIP-seq signal from normal kidney . . . 58 3.6 DecreasedSETD2expression inSETD2-normal tumors results in
H3K36me3 deficiency . . . 60 3.7 Nucleosome-depleted regions inSETD2-mutant tumors display
localized DNA hypomethylation . . . 61 3.8 H3K36me3 deficiency is associated with intron retention . . . 63 3.9 H3K36me3-deficient tumors display increased intron retention
compared to H3K36me3-normal tumors . . . 64 3.10 GAPDHexhibits low intron retention in H3K36me3-deficient tumors . . . 65 3.11 Enriched ontologies among genes with increased intron retention . . . 66 3.12 Widespread RNA processing defects linked withSETD2mutations
persist in the mature RNA pool and are marked by altered
chromatin accessibility . . . 69 3.13 Intron retention inSETD2-mutant tumors persists into mature,
3.15 Aberrant splicing is preferentially detected in highly transcribed genes . . . . 72 3.16 Aberrant splicing and intron retention is preferentially detected in
long genes and genes with more exons . . . 73 3.17 Enriched ontologies among misspliced genes . . . 75
4.1 FFPE-FAIRE shows high concordance with frozen tissue and
LIST OF ABBREVIATIONS
ChIN Chromatin Integrity Number
ChIP Chromatin Immunoprecipitation
DNase Deoxyribonuclease
ENCODE Encyclopedia of DNA Elements
FAIRE Formaldehyde-Assisted Isolation of Regulatory Elements
FFPE Formalin-Fixed Paraffin Embedded
HIF Hypoxia Inducible Factors
HUVEC Human Umbilical Vein Endothelial Cells
IHC Immunohistochemistry
IRS Intron Retention Score
MNase Micrococcal nuclease
PCA Principal Components Analysis
RCC Renal Cell Carcinoma
RIN RNA Integrity Number
RPKM Reads Per Kilobase exon per Million mapped reads
TCGA The Cancer Genome Atlas
TF Transcription Factor
TMA Tissue Microarray
TSS Transcriptional Start Sites
CHAPTER 1
INTRODUCTION
1.1 Initial discoveries from tumor genome sequencing
The Cancer Genome Atlas, the International Cancer Genome Consortium, and others have now cataloged the frequencies and types of mutations in many different cancer types and subtypes across thousands of patients [16] [17] [18] [19] [20] [21] [22] [23] [24] [25] [26]. Many of the results have been predictable though nonetheless useful. One such finding is that cancers with a clear link to mutagenic exposure such as melanoma, lung squamous cell carcinoma, and lung adenocarcinoma often have genomes with tens of thousands of mutations in coding and non-coding space, large aberrancies in copy number, and catastrophic large- or small-scale genetic insults such as chromothripsis or kataegis, respectively [25] [26]. This high mutation rate observed is often coupled with DNA replication or repair defects [25] [26]. Another such finding is that there are recurrent activating mutations in well-studied oncogenes (e.g. Ras, Raf, SRC, EGFR, MYC, etc) and inactivating mutations in well-studied tumor suppressors (e.g.TP53,CDKN2A,PTEN,RB1, etc) [25]. These mutations were discovered in the 1970s and 1980s because they are not only prevalent among many cancer types, but also can directly cause oncogenic transformation of normal cells (reviewed in [27]).
The derangement of cellular signaling, for example through oncogene activation, also has prominent effects at the level of transcription (e.g. [28]). Differences in transcript abundance can be exploited to sub-classify tumors into groups that demonstrate differences in patient outcome or therapeutic response. Breast carcinomas, for example, can be subclassified into subtypes based on their transcriptional profiles [29] [18]. Similar analysis of glioblastomas revealed four tumor subtypes, each of which have transcriptional differences likely driven largely by mutations inTP53,PDGFRA,NF1, orPTEN [30]. Together, oncogenic activation and/or tumor suppressor silencing and the observable defects in cell signaling, transcription, and cell proliferation have reinforced the paradigm that cancer is a “disease of the genome”.
remodeling or modification of histones or DNA (e.g. PBRM1,SMARCB1, ARID1A, SETD2, MLL2, DNMT3A, UTX, etc), or encode histone core proteins themselves or their variants (e.g. H3F3A) [31] [32] [33] [34] [35] [36] [37] [38] [39] [40] [41] [42] [43]. The advent of high-throughput sequencing allowed for the discovery of mutations in a tumor genome in two weeks or less, but prior to the studies described here, no comprehensive analysis of the molecular consequences of chromatin regulator mutations has been performed in human tumors.
1.2 Chromatin structure, histone modifications, and regulation of gene expression
The genomes of eukaryotic organisms are packaged into a structure known as chromatin. This packaging allows for the approximately 2 meter long DNA polymer to fit within a 2-micron nucleus. This packaging is achieved by wrapping the DNA double helix approxi-mately twice (147 bp) around an octamer of histone proteins, consisting of two copies each of histone proteins H2A, H2B, H3, and H4 [44]. This repeating functional unit of chromatin, in which DNA is complexed with histone proteins, is known as the nucleosome core particle. Nucleosomes are further coiled and compacted to form the 30 nm fiber, a solenoidal structure that is further compacted to form the mitotic chromosome [45].
Histone modifications and variants are often heritable across generations, therefore are fre-quently classified as “epigenetic” alterations, although this designation is controversial [52]. Each modification and variation alters nucleosome stability or functions to roughly divide the genome into active, recently active, poised, or repressed states (e.g. [53]). Many such regions of the genome are demarcated differentially by histone modifications or exhibit al-tered nucleosome occupancy across cell types in a way that corresponds to cell-type-specific gene expression [53] [14] [15] [54] [55]. Each of these dynamic processes are carefully con-trolled by histone methyltransferases and demethylases, histone acetylases and deacetylases, and chromatin remodelers (reviewed in [55]).
1.3 Epigenetics of cancer
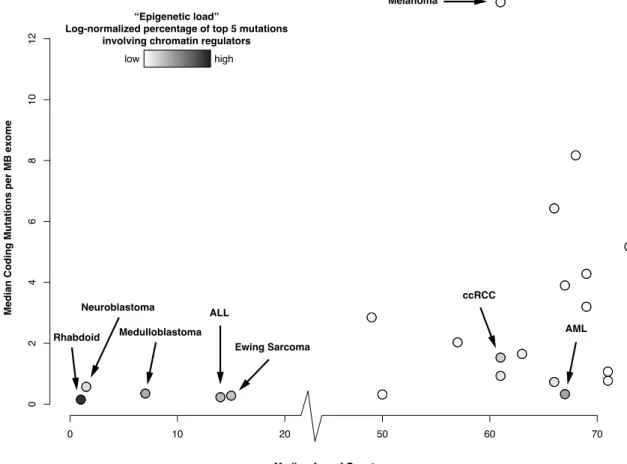
for that cancer. These data illustrate that a new paradigm is emerging: pediatric and hema-tological cancers carry a surprisingly low mutational load, and those mutations that do occur are disproportionately prevalent in chromatin regulators. (Figure 1.1). The presumed effects on chromatin therefore suggest that these tumors can be categorized by being a disease of the genome, and also more specifically a disease of the epigenome. There was one exception to the group of pediatric tumors: Ewing Sarcoma. This is likely due to the unique mechanism of carcinogenesis in that cancer, which is caused by expression of a translocation product (EWS-FLI; discussed in Chapter 2 [57]). Other cancers carrying translocations that form chimeric DNA-binding factors, including prostate cancer and various forms of leukemia, may thus also exhibit alterations in chromatin structure.
Mutations in chromatin regulators, though prevalent in pediatric malignancies, are also present in many if not all of the adult cancers but typically at lower frequency; one notable exception is clear cell Renal Cell Carcinoma. It is not yet well understood which class of mutation occurs first in these contexts. It has been suggested that epigenetic alterations, such as the loss of DNA methylation, may lead to additional mutations due to genomic instability [62] or induced plasticity in cellular differentiation [63]. Therefore, one possible theory may be that mutations in chromatin regulators arise at an early age. Sometimes these mutations re-sult in pediatric malignancy if they occurred in a particularly susceptible cellular niche. Other times, however, these mutations may initially contribute only subtly to changes in cellular processes but create an environment in which many more mutations can accumulate over the course of many years. This theory could offer an explanation for the higher mutational load in adult cancers, particularly those without known associations with mutagenic exposure.
1.4 Isolation of active regulatory elements from human chromatin
0 10 20 50 60 70
0
2
4
6
8
10
12
Median Age of Onset
Median Coding Mutations per MB exome
ccRCC
Rhabdoid Medulloblastoma
Ewing Sarcoma
Neuroblastoma ALL
AML “Epigenetic load”
Log-normalized percentage of top 5 mutations involving chromatin regulators
low high
Melanoma
Figure 1.1: Disproportionate frequency of chromatin regulator mutations in pediatric and hematological cancers. The median age of onset (x-axis) is plotted against the median number of coding mutations per megabase of exome (“mutational load”, y-axis). Points are colored based on their “epigenetic load”, computed as the frequency at which a chromatin regulator mutation appeared in the five most abundant mutation types for a particular cancer, normalized by the total mutational load for that cancer.
[78]. We have now extended the FAIRE technique to permit studies of chromatin accessibil-ity in both primary human tissues and tumors as well as Formalin-Fixed Paraffin-Embedded (FFPE) tissue specimens.
1.5 Epigenetic therapies in cancer
Cancers can be treated by compounds that act through chromatin or DNA-modifying en-zymes such as inhibitors of DNA methylation and histone deacetylases. Trapoxin, and vari-ants thereof, as well as other compounds have been known since 1996 [79] to inhibit histone deacetylase activity [80], and inhibitors of DNA methylation (such as 5-azacytidine) were first synthesized in 1974 [81]. More recently, novel classes of histone deacetylase inhibitors, histone methyltransferase inhibitors (e.g. EPZ-004777 against DOT1L [82] and EPZ-6438 against EZH2 [83]), DNA methyltransferase inhibitors, and bromodomain inhibitors (e.g. JQ1 against BRD4 [84], have proven effective in certain cancer contexts. This exciting new wave of small molecule inhibitors will provide novel therapeutic options, especially when used in conjunction with other vetted compounds, for many forms of cancer. It will be of great im-portance to study the effects of these compounds on the epigenome itself in cancer cells in the development of specific biological therapies that target chromatin.
1.6 Thesis contributions
diagnostic. Moreover, these data have enabled high-throughput screens for compounds that af-fect chromatin accessibility, and contribute generally to a greater understanding of chromatin biology and dysregulation in human cancers (Chapter 5).
This work has been a highly collaborative effort. In Chapter 2, all ChIP experiments, Western blots, gene expression microarrays, viral-mediated knockdown/re-expression exper-iments, and quantitative PCR was performed by Mukund Patel and Andrew McFadden. I performed all computational analyses and interpretation of high-throughput sequencing data as well as all FAIRE experiments.
In Chapter 3, Kate Hacker prepared all RNA for sequencing, analyzed and interpreted data from tissue microarrays, performed all altered splicing validation, functionally annotated all SETD2 mutations, prepared many libraries for high-throughput sequencing, and contributed significantly to biological interpretation of the data. Darshan Singh analyzed TCGA RNA-seq data for altered splicing and Joel Parker analyzed genotyping data from our tumor cohort for mutations. I performed all FAIRE and genotyping experiments, prepared many libraries for high-throughput sequencing, analyzed all FAIRE and RNA data, developed the Intron Retention Score and hierarchical clustering methods, analyzed H3K36me3 ChIP-seq data and TCGA DNA methylation data, and led the integration and biological interpretation of the data.
CHAPTER 2
TUMOR-SPECIFIC RETARGETING OF AN ONCOGENIC TRANSCRIPTION FACTOR CHIMERA RESULTS IN DYSREGULATION OF CHROMATIN AND
TRANSCRIPTION
2.1 Introduction
Recurrent chromosomal translocations have been associated with an increasingly wide range of human cancers. Commonly involving genes encoding transcriptional regulators, translocations can deregulate gene expression and generate structurally novel oncogenic fu-sion proteins [85]. The transforming activity of these chimeric genes typically reveals cell type specificity, suggesting that certain lineages are permissive for transformation. Studies of oncogenic transcription factors have typically focused only on the fusion products or their target genes and often in heterologous cells, limiting insights into the relative influence of chimerism and cell lineage.
evidence that EWS-FLI is necessary for transformation, ectopic expression of EWS-FLI fails to activate similar genetic programs or transform most human cell lines, indicating that cell specificity is a major determinant of EWS-FLI activity [93] [94] [95].
FLI1, a member of the ETS family, is an important developmental transcription factor [96]. FLI1 deletion in mice results in embryonic death from hemorrhage associated with aber-rant hematopoiesis and vasculogenesis, supporting a role in endothelial development [97] [98] [99]. Translocations involving ETS members have been implicated in other cancers, including prostate adenocarcinoma [100]. The function of EWSR1 is less well-understood, however, re-ports suggest participation in transcription or RNA splicing [101]. EWSR1-deficient mice die prior to weaning and show defects in B-cell development and meiosis [102]. Other translo-cations involving EWSR1 have been identified, resulting in chimeras with ATF1 and WT1 in Clear Cell Sarcoma and Desmoplastic Small Round Cell Tumors, respectively [103] [104] [100].
2.2 Results
2.2.1 Chimerism and cell lineage influence genomic targeting
To compare EWS-FLI with its parental protein FLI1, we developed a lentiviral delivery approach that permitted concurrent silencing of endogenous EWS-FLI or FLI1 and expres-sion of an epitope-tagged verexpres-sion of EWS-FLI or FLI1 (Figure 2.1A). Lentiviral knockdown-replacement was performed in a Ewing Sarcoma cell line (EWS502) and primary human en-dothelial cells (HUVEC). HUVEC were selected as they abundantly express FLI1, and FLI1 has been implicated in endothelial development [98] [105] [99]. Genomic localization of each protein was examined by chromatin immunoprecipitation followed by next-generation sequencing (ChIP-seq). Gene expression was also examined using exon microarrays. The lentiviral knockdown-replacement strategy offered a number of experimental benefits to facil-itate comparative genomic analyses. First, viral transduction enabled the titration of protein expression, avoiding overexpression while achieving efficient knockdown (Figure 2.1B). Sec-ond, expression of a shRNA directed to the 30 UTR of FLI1 (able to target both endogenous EWS-FLI and FLI1 but not the transduced genes which do not contain the 30 UTR) in all ex-perimental conditions minimized the possibility for the detection of off-target effects. Finally, the use of a common and robust antibody for chromatin immunoprecipitation circumvented issues of antibody sensitivity, specificity, and antigenic variability, factors that can complicate downstream comparisons, as recently demonstrated [106].
A
B
Knockdown
Express --
-+ + +
EF FLI1
Ewing Sarcoma (EWS502) Endothelial Cells (HUVEC)
--
-+ + +
EF FLI1
C
Time After Infection (days)
0 1 2 3 4
0
2
4
6
8
10 Uninfected
Knockdown only
Knockdown + FLI1 expression Knockdown + EWS-FLI expression
Knockdown, express
one of the following HA EWS FLI HA FLI1
FLI1
EWS FLI
Gene Expression (Exon microarrays) Chromatin Localization
(ChIP-seq)
EWS502 Cell Count (10
5)
FLI1 EWS-FLI
EWS-FLI
FLI1
Ewing Sarcoma (EWS502)
Endothelial Cells (HUVEC)
* *
α-FLI
α-HA
requirement of EWS-FLI for cell proliferation [107] [108] [109] [90]. Inhibition of FLI1 ex-pression or ectopic exex-pression of EWS-FLI did not affect the proliferation of endothelial cells under the conditions tested (data not shown).
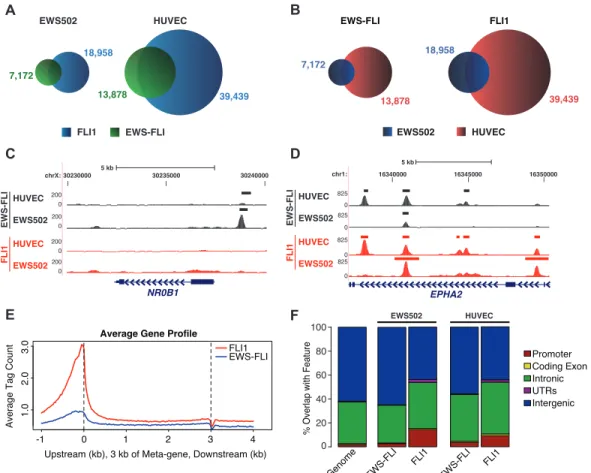
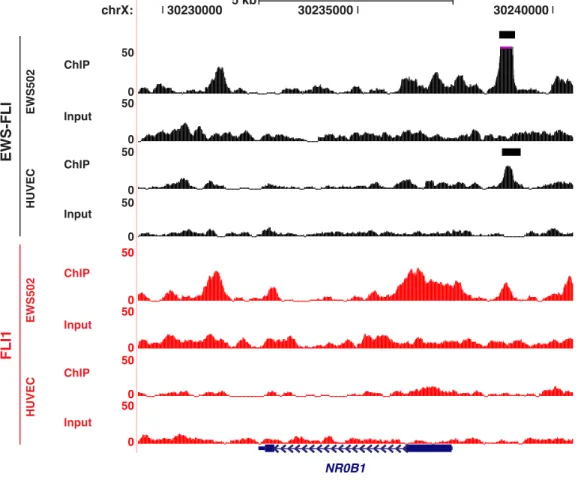
Differential activities of EWS-FLI and FLI1 could result from either of two mechanisms. The transcription factors could target similar genomic sites due to their common DNA binding domain but vary in their ability to modulate gene expression. Alternatively, chimerism could result in genomic retargeting such that differences in transcriptional output would result from variation in the sites of chromatin association. To test these two hypotheses, we performed ChIP-seq for EWS-FLI and FLI1 in both EWS502 and HUVEC. Analyzing only high quality, uniquely aligned reads, sites of genomic enrichment for each factor were determined using the Zero Inflated Negative Binomial Algorithm (ZINBA), a flexible statistical model that adjusts for the effects of GC content, mapability, and copy number variation [110]. We identified 7,172 and 13,878 potential EWS-FLI binding regions in EWS502 and HUVEC, respectively. FLI1 bound 18,958 regions in EWS502 and 39,439 regions in HUVEC (Figure 2.3A). The greater number of EWS-FLI binding sites identified in this study compared to previous ChIP-chip and ChIP-seq approaches [111] [112] [113] likely reflects greater sequencing depth and enhanced antibody sensitivity. Despite the use of different tumor cells, nearly 75% of the sites previously identified by ChIP-seq [112] overlap the regions bound by EWS-FLI in this study. Examination of specific genomic loci demonstrated the contribution of chimerism and cell lineage to targeting (Figure 2.3A–B). For example, a site near NR0B1 previously shown to
FLI1 EWS-FLI EWS502
A
HUVEC
chrX:30230000 5 kb 30235000 30240000
NR0B1 0 200 0 200 0 200 0 200 C chr1: D 0 825 0 825 0 825 0 825
-1 0 1 2 3 4
1.0
2.0
3.0
Average Gene Profile
FLI1 EWS-FLI
E
Average Tag Count
Upstream (kb), 3 kb of Meta-gene, Downstream (kb)
F EWS-FLI FLI1 HUVEC EWS502 HUVEC EWS502 EWS-FLI FLI1 HUVEC EWS502 HUVEC EWS502 Intergenic UTRs Intronic Coding Exon Promoter 0 20 40 60 80 100
% Overlap with Feature
Genome EWS-FLI FLI1
18,958 7,172
39,439 13,878
16340000 16345000 16350000
EPHA2 5 kb EWS502 HUVEC EWS-FLI FLI1 FLI1 EWS-FLI 7,172 13,878 18,958 39,439 B HUVEC EWS502
be occupied by EWS-FLI [89] [114] [111] [115] was bound by EWS-FLI but not FLI1 in both cell types (Figure 2.3C and Figure 2.4). In contrast, sites around the ephrin receptor, EPHA2, revealed a more complex pattern (Figure 2.3D and Figure 2.5). Sites exclusive to one transcription factor or cell type were identified, as were sites common to both transcription factors and cell types. Overall, in the tumor cells, 46% of EWS-FLI sites overlap FLI1 sites, whereas in HUVEC 75% of EWS-FLI sites overlap with FLI1 (Figure 2.3A). Comparing targeting across cell types, 45% of EWS-FLI and 55% of FLI1 sites were shared between EWS502 and HUVEC (Figure 2.3B).
Genomic localization was examined by comparing the raw ChIP-seq signal over all genes (Figure 2.3E). In tumor cells, FLI1 signal was greater at transcriptional start sites (TSS), in the proximal upstream region, and through the gene body compared to EWS-FLI. Given the relative absence of EWS-FLI signal at these genic regions, we compared the overall genomic distribution of binding sites (Figure 2.3F). Again in tumor cells, FLI1 showed greater associa-tion with promoters and 50and 30 UTRs than EWS-FLI. Compared to FLI1, EWS-FLI bound more frequently at distal intergenic regions (>60%). Although EWS-FLI and FLI1 shared occupancy at a high fraction of sites in endothelial cells, EWS-FLI demonstrated slightly less association with introns and more with intergenic regions than FLI1 (Figure 2.3F). These data suggest that in both cancer and normal cells, FLI1 targets genic sites, and chimerism leads to retargeting to intergenic regions. However, chimerism-induced retargeting is significantly mitigated by cell lineage.
2.2.2 EWS-FLI and FLI regulate divergent gene programs
chrX:
EWS-FLI
HUVEC
EWS502
ChIP
Input
ChIP
Input
FLI1
HUVEC
EWS502
ChIP
Input
ChIP
Input
5 kb
30235000 30240000
30230000
NR0B1
50
0 50
0 50
0 50
0 50
0 50
0 50
0 50
0
EPHA2
5 kb
16340000 16345000 16350000
chr1:
50
0 50
0
50
0 50
0
50
0 50
0 50
0 50
0
EWS-FLI
HUVEC
EWS502
ChIP
Input
ChIP
Input
FLI1
HUVEC
EWS502
ChIP
Input
ChIP
Input
factor expression. Although EWS-FLI occupied fewer genomic sites than FLI1, it modulated the expression of more genes in both cell types. This difference was greatest in tumor cells in which EWS-FLI altered the expression of three times as many genes as FLI1 (Figure 2.6A). Genes regulated by FLI1 were mostly distinct from those regulated by EWS-FLI, with 40– 45% shared in either cell type. However, of the genes commonly modulated by either factor in HUVEC, 97% were regulated concordantly, whereas in tumor cells, opposing effects on gene expression were frequently observed (41% of coregulated genes) (Figure 2.6B). Cell-type-specific regulation was also evident. Only 34% of genes differentially expressed by EWS-FLI were shared across the two cell types, whereas only 12% of FLI1 differentially expressed genes were shared.
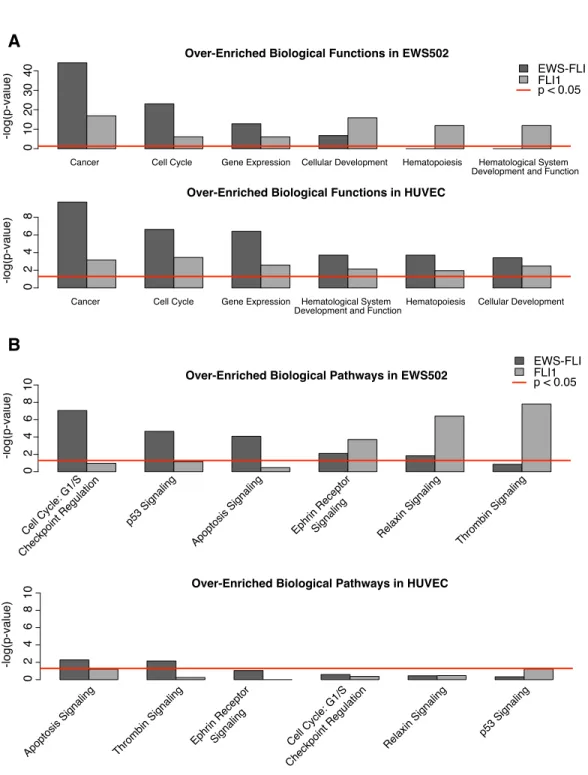
The classes of genes regulated by EWS-FLI and FLI1 also differed significantly (Figure 2.7). Approximately one-third of the genes modulated by EWS-FLI in tumor cells were im-plicated in cancer or cell cycle regulation; the identification of these categories supports of previous studies of gene regulation by EWS-FLI [116] [90] [95] [117]. In contrast, FLI1 ex-pression in tumor cells induced genes associated with hematopoiesis, hematological system development and function, and cellular development, including genes of the ephrin, thrombin, and relaxin signaling pathways. In endothelial cells, similar gene ontologies were modu-lated by both transcription factors. These data suggest that cell type influences the impact of chimerism on transcriptional output.
2.2.3 Differentially targeted regions are marked by DNA sequence and regulatory variation
cell-type-EWS-FLI FLI1 EWS-FLI FLI 1 Downregulated Upregulated Number of Differentially Expressed RefSeq Genes
EWS502 HUVEC
0
500
1000
1500
2000
2500
3000
A
B
Fold-change, EWS-FLI
Fold-change, FLI
-10 -5 -2 0 2 5 10
-5
-2
0
2
5
10
116 128
83 2
119 53 80 3
Number of Genes
EWS502 HUVEC
Fold-change of Common Differentially Expressed RefSeq Genes
Cancer Cell Cycle Gene Expression Cellular Development Hematopoiesis Hematological System Development and Function
Over-Enriched Biological Functions in EWS502
-log(p-value) 0 10 20 30 40
Cancer Cell Cycle Gene Expression Hematological System
Development and Function Hematopoiesis Cellular Development
Over-Enriched Biological Functions in HUVEC
-log(p-value) 02
4 6 8 A EWS-FLI FLI1 p < 0.05
B
Cell Cycle: G1/S Checkpoint Regulation
p53 Signaling
Apoptosis Signa ling
Ephrin Receptor
Signaling Relaxin Signaling Thrombin Signaling Over-Enriched Biological Pathways in EWS502
-log(p-value) 0 2 4 6 8 10
Apoptosis Signaling Thrombin Signaling Ephrin Receptor Signaling Cell Cycle: G1/S Checkpoint Regulation
Relaxin Signaling p53 Signaling Over-Enriched Biological Pathways in HUVEC
-log(p-value) 0 2 4 6 8 10 EWS-FLI FLI1 p < 0.05
dependence, with cell type being the primary determinant for the majority of differentially bound sites. Sites in clusters 1–3 revealed higher signals in tumor cells whereas those in clus-ters 4–6 (representing 74% of the sites) were enriched in endothelial cells. The finding of HUVEC-specific clusters bound by both EWS-FLI and FLI1 further supports that in a normal cellular environment these transcription factors share similar targeting.
Testing for associations between each cluster and gene expression demonstrated that sites in clusters 5 and 6 tended to be located near the union set of differentially expressed genes from both cell types (Figure 2.8B). Approximately 15% of differentially regulated genes con-tained at least one of these sites within 25 kb. Furthermore, genes that concon-tained a TSS flanked by a site in clusters 5 or 6 (within 25 kb) were significantly more likely to be regulated by the expression of either EWS-FLI or FLI1 in HUVEC (Figure 2.8C). Genes harboring cluster 6 sites were frequently upregulated (82% and 88% for EWS-FLI and FLI1, respectively), how-ever, genes proximal to cluster 5 sites lacked this skew toward upregulation. Interestingly, these data suggest that although FLI1 targets both cluster 5 and 6 sites equally, the potential occupancy of EWS-FLI at these sites characterizes functionally distinct elements. Since the sequence composition of clusters 5 and 6 were indistinguishable (see below), it is possible that chromatin differences that permit EWS-FLI binding also favor enhancer activity.
HUVEC EWS-FLI HUVEC FLI1 EWS502 EWS-FLI EWS502 FLI1 3 0 -3 Cluster 1 Cluster 2 Cluster 3 Cluster 4 Cluster 5 Cluster 6
A
B
HUVEC EWS502 FLI1EWS-FLI EWS-FLI FLI1
-1kb +1kb
Fraction of Differenti
ally
Expressed Gene
s
EWS-FLI FLI1
p = 0.0122 Regulated Genes Permuted Genes
0.05
0.15
0.25
250000 500000 750000
Cluster 1 Cluster 2 Cluster 3 Cluster 4 Cluster 5 Cluster 6
Distance from TSS to first site (bp)
C
D
C
T A
GGCACGTATGACCAGTGCTACGAGAAGCTAGTCGA C GTA
C
T
A GCAGTCGAT
C G A A T G
CCTGAATGCAGACGT CTGACAGTGCACTGTCGACGAT GCATGACTCA
T
G CTAGCTAG
G
ACGAGAGTAC
T A
G
A
ACT
CTA
GA
CATGCA
G G
T
CGGA
GCTACA
-1kb +1kb -1kb +1kb -1kb +1kb 0.5
9 0 10 20 30 40 50 60 EWS-FLI FLI1
p = 0.0044 p < 0.0001
Number of Genes W
ith Site
Proximal to TSS (±
25kb)
Cluster 5 Cluster 6
p < 0.0001
ontology influences genomic targeting and corroborate our expression-based gene ontology observations (Figure 2.7).
To identify features of the differentially bound regions, comparativede novomotif detection for each cluster was performed using the 200 bp region surrounding the maximal signal for each region [119]. Identified motifs were matched to known motifs in TRANSFAC using TOMTOM [120]. 94% of sites in clusters 1 and 2, which exhibited an EWS-FLI-specific pattern in the tumor cells, contained a tetranucleotide repeat harboring the core of the ETS binding site (Figure 2.8D and see below). Sequence elements identified in clusters 3–6 were more highly varied commonly containing the canonical ETS motif.
2.2.4 Chimerism retargets EWS-FLI to tandem tetranucleotide repeats
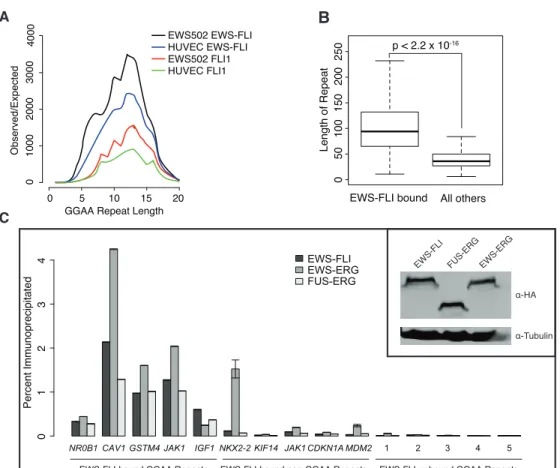
De novomotif detection on the sequences uniquely bound by EWS-FLI in sarcoma cells represented in clusters 1 and 2 identified a GGAA-containing tetranucleotide microsatellite repeat. EWS-FLI binding to these sequences had been observed in recent studies [111] [112] [113]. The number of tandem repeats bound by EWS-FLI was higher than expected by chance in both cell types, although tumor cells demonstrated greater enrichment (Figure 2.9A). Ex-amination of perfect sequential repeats revealed maximum enrichment at approximately 14
Figure 2.8: Hierarchical clustering identifies cell- and transcription factor-specific variation in genomic targeting. A. Hierarchical clustering of 6,525 binding sites that exhibited the widest variation in signal across transcription factors or cell types. Each row was median-centered and colored based on the average read count across the region. B. Distance (bp) from the transcriptional start site of the union set of differentially expressed genes to the closet site from clusters 1–6. C. Number of EWS-FLI or FLI1 differentially expressed genes in HUVEC containing a cluster 5 (left) or cluster 6 (right) site within 25kb of its TSS, compared to 10,000 permutations of all RefSeq genes. D. Normalized log2 ChIP-seq signal around the midpoint
A
Length of Repeat
EWS-FLI bound All others
Observed/Expected B C 0 50 100 150 200
250 p < 2.2 x 10
-16 0 1000 2000 3000 4000
GGAA Repeat Length
0 5 10 15 20
EWS502 EWS-FLI EWS502 FLI1 HUVEC EWS-FLI HUVEC FLI1
NR0B1 CAV1 GSTM4 JAK1 IGF1 NKX2-2 KIF14 JAK1 CDKN1A MDM2 1 2 3 4 5
EWS-FLI EWS-ERG FUS-ERG Percent Immunoprecipitated 0 1 2 3 4 α-HA α-Tubulin EWS-FLI FUS-ERG EWS-ERG
EWS-FLI-bound GGAA Repeats EWS-FLI-bound non-GGAA Repeats EWS-FLI-unbound GGAA Repeats
10 15 20 25 30 MSigDB Perturbation
Mouse Phenotype
MGI expression: Detected
GO Biological Process
-log10(qvalue)
5 0
Cluster 1
Cluster 2
Cluster 3
Cluster 4
Cluster 5
Cluster 6
Genes up-regulated in mesenchymal stem cells (MSC) engineered to express EWS-FLI fusion
Genes up-regulated in rhabdomyosarcoma cells engineered to express EWS-FLI fusion Genes within amplicon 8q12-q22 identified in a CNV study of 191 breast tumors
Genes down-regulated by TSA in at least one of three multiple myeloma cell lines
Genes up-regulated in mesenchymal stem cells (MSC) engineered to express EWS-FLI fusion
Genes up-regulated in rhabdomyosarcoma cells engineered to express EWS-FLI fusion
Abnormal ear morphology
Abnormal neurocranium morphology
TS11_embryo; mesoderm
Genes within amplicon 8q23-q24 identified in a CNV study of 191 breast tumors
Decreased lymphocyte cell number
TS12_embryo; mesenchyme
Decreased T cell number
Genes up-regulated in response to both hypoxia and overexpression of an active form of HIF1A
Vasculature development
Blood vessel development
Blood vessel morphogenesis
Abnormal artery morphology
Genes up-regulated in response to both hypoxia and overexpression of an active form of HIF1A
Vasculature development
Blood vessel development
Blood vessel morphogenesis
tandem elements. Periodicity in the length of enriched repeats was observed with a prefer-ence for 8, 12 and 14 repeat units. GGAA-containing repeats as annotated by RepeatMasker that were bound by EWS-FLI in EWS502 were significantly longer than those not bound, with a median length of 100 bp (Figure 2.9B). The difference in lengths reflects the analysis of either perfect or imperfect repeats. Unexpectedly, FLI1 also bound these repeats, although with much lower frequency in both cell types, suggesting that the ability to target these sites is not exclusive to EWS-FLI but rather reflects the enhancement of a native characteristic.
We directly compared the binding of EWS-FLI and other fusions characteristic of Ewing Sarcoma at the tetranucleotide repeat-containing sites with sites containing the canonical high affinity ETS motif. The TET-ETS fusions EWS-ERG and FUS-ERG [87] [121] were epitope-tagged and expressed at similar levels as endogenous EWS-FLI in conjunction with EWS-FLI silencing (Figure 2.9C, inset). All fusion proteins tested demonstrated a greater enrichment at sites containing tandem repeats than canonical high affinity sites (Figure 2.9C). These data corroborate EWS-ERG ChIP [113] and support the general property of TET-ETS fusions to occupy these elements in a chromatinized genomic context. Moreover, the data suggest that repeat-containing sites are more likely to be bound than the canonical sites.
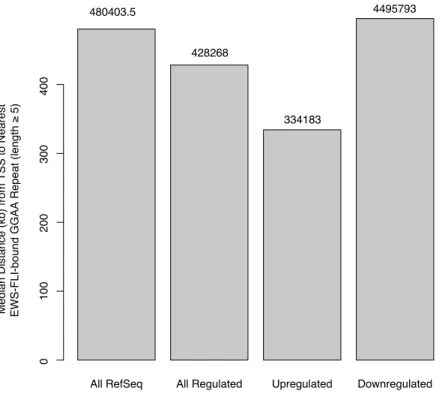
In light of recent studies suggesting a length requirement for microsatellite enhancer func-tion [114] [111], we examined EWS-FLI and FLI1 sites containing five or more repeats. Approximately 30% of regions uniquely bound by EWS-FLI in either cell type contained these long tandem repeats, whereas they were present in only 0.2% and 0.04% of regions unique to FLI1 in EWS502 and HUVEC, respectively. In agreement with the previous stud-ies, we found that these GGAA repeats were more proximally located to genes upregulated
by EWS-FLI (Figure 2.11) with FLI1 exhibiting a similar trend (data not shown). FLI1 bound more proximally to FLI1-modulated genes compared to EWS-FLI around EWS-FLI-regulated genes (Figure 2.12), suggesting that in the context of chromatin, tetranucleotide repeats may function primarily as transcriptional enhancers and can be located distally from genes.
All RefSeq All Regulated Upregulated Downregulated
0
100
200
300
400
Median Distance (kb) from TSS to Nearest EWS-FLI-bound GGAA Repeat (length ≥ 5)
480403.5
428268
334183
4495793
0.0
0.2
0.4
0.6
0.8
1.0
Distance from TSS to nearest peak (kb)
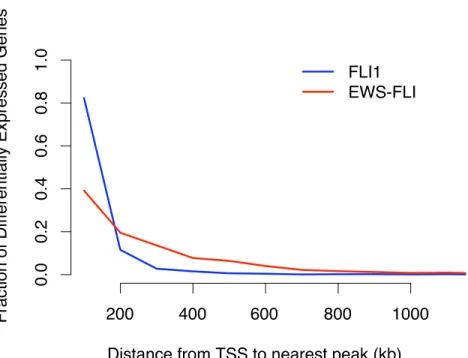
Fraction of Differentially Expressed Genes 200 400 600 800 1000
FLI1 EWS-FLI
Figure 2.12: FLI1 binding sites are closer to FLI1 differentially expressed genes. Distance from the TSS of a gene differentially expressed by FLI1 (blue) or EWS-FLI to the nearest FLI1 or EWS-FLI binding site, respectively. The fraction of genes containing at least one site within the denoted distance is presented.
a small number of randomly selected tetranucleotide repeats failed to demonstrate a differ-ence between tumor cells and the referdiffer-ence genome [111] [112]. We compared the lengths of several tetranucleotide repeats occupied by EWS-FLI in tumor cells with the same regions in HUVEC and the reference genome (hg18). Regions amenable to evaluation were limited due to the challenges inherent in primer design for repetitive regions. However, one region, located in an intron ofIGF1, exhibited mono- or biallelic presence of a sequence longer than that predicted by the reference genome in 4 of 7 Ewing cell lines (Figure 2.13A). Sequencing of this region from EWS502 cells confirmed that the difference resulted from nine additional repeats (Figure 2.13B). Interestingly, we observed an extremely faint band running at approx-imately the same molecular size as the expanded region in the pooled endothelial cells. It is possible that expansion (relative to the reference genome) represents an allelic variant present in the population.
2.2.5 Combinatorial DNA binding motifs distinguish endothelial cell targeted sites
Reference (hg18) EWS502
*********************************************************************************************************** AGAACTAAAGCAAAGGCAAAGACAGAGAGAAGAAGGAAGGAAGGAGGGAGGGAGGGAGGGAAGGAAGGAAGGAAGGAAGGAAGGAAGGAAGGAAGGAAGGAAGGAAG----AGAACTAAAGCAAAGGCAAAGACAGAGAGAAGAAGGAAGGAAGGAGGGAGGGAGGGAGGGAAGGAAGGAAGGAAGGAAGGAAGGAAGGAAGGAAGGAAGGAAGGAAGAAAG
Reference (hg18) EWS502
****************************************************************** ---GAAGGAAAGGGAAGGAAGAACAAAAAGACTTTCTAGTTAAAGAATGCTTAACTAGCAAACTATGTA GAAGGACGGAAGGAAGGAAGGAAGGAAGGAAGGAAGGAAAGGGAAGGAAGAACAAAAAGACTTTCTAGTTAAAGAATGCTTAACTAGCAAACTATGTA chr12:101333393-101333565
A
B
200bp
100bp
HUVEC EWS502 EWS894 A673 MHH-ES-1RD-ES SK-ES SK-N-MC Ladder
Figure 2.13: EWS-FLI-bound tetranucleotide repeats demonstrate repeat length polymor-phism. Length of repeat found within IGF1 across 7 Ewing Sarcoma cell lines (EWS502, EWS894, A673, MHH-ES-1, RD-ES, SK-ES, SK-N-MC) and compared to endothelial cells (HUVEC). Lengths determined by PCR using primers flanking repetitive region and resolved on an 8% acrylamide gel. B. Sequence of repeat region from EWS502 cells compared to refer-ence genomic sequrefer-ence (hg18). Multiple sequrefer-ence alignment was performed using ClustalX with default parameters. Exact sequence matches denoted by “*”, regions of difference high-lighted in yellow.
regions, demonstrated context specific sequence variation. ETS sites in isolation typically contained a C preceding the GGAA core, matching the canonical ETS motif [113]. However, ETS motifs in composite sites with AP1 were preceded by an A. Similar motif variation had been observed in the tandem binding sites of ETS-1 with RUNX1 [123].
by EWS-FLI. In the tumor cells, FLI1 demonstrated a modest ability to interact with some of these sites as previously noted (Figure 2.9A). In endothelial cells, the signal intensities and positions of FLI1 and EWS-FLI were similar around ETS, ETS-AP1, AP1, and GATA motif-containing sites. In the tumor cells, FLI1 bound these sites although with far less signal intensity, again demonstrating the tendency of FLI1 to function normally in tumor cells. Since de novo motif identification may preclude detection of less common motifs, we examined signals from HUVEC around sites containing computationally-predicted motifs for Myc:Max, NFB, STAT, PPAR, HNF4A, and CREB [124]. Although these sites represented less than 1% of those analyzed, similar patterns of EWS-FLI and FLI1 signal were detected (Figure 2.14). All motif associations were lost when the sites were permuted (Figure 2.15). These data suggest a large network of cooperative interactions for FLI1 binding, most frequently AP1 and GATA. Sites selective for EWS-FLI occupancy in sarcoma cells were distinguished in function, location, and composition from those sites that characterize endothelial targeting.
2.2.6 Epigenetic factors distinguish microsatellite repeats in Ewing Sarcoma
Since cell lineage dominated the variation in targeting of both chimeric and parental tran-scription factors, we explored features of epigenetics and chromatin configuration that could underlie these differences. We performed ChIP-seq on Ewing Sarcoma cells for histone marks associated with active (H3K4me1, H3K4me2, and H3K4me3) or repressed (H3K27me3) chromatin. We also performed Formaldehyde Assisted Isolation of Regulatory Elements cou-pled with next-generation sequencing (FAIRE-seq) to identify regions of nucleosome deple-tion that characterize active regulatory elements. Consistent with other cell types, we found that both methylation on H3K4 and FAIRE demonstrated a strong association with gene ex-pression, whereas H3K27me3 was inversely correlated with transcription (Figure 2.16A).
50 100 150 200 250 20 40 60 80 50 100 150 5 10 15 20 25 20 40 10 20 30 5 10 15 20 25 NFkB STAT PPAR HNF4 CREB C G A A G
C
A
GG
A
ATCAGGCTCGAT CGTAGTCGA AGCATGAGTA
C
A
C
G
T
G
ACTCATTETS
Max
GG
AG
GATCAGATCGAT
A
C
T
T
A
C
C
TT
GT
AC G T C C A
GA
G
TG
AA
A A CTAG
T
A
GATGCG
T
A
G
T CCTGAG
A
TGAAGTATGACGTGTCTCGA A GTA
T C G A T C G
T
G
A
C
A
G
ACTCTA
C
T
G ACG
T A G C HUVEC EWS502 FLI1
EWS-FLI EWS-FLI FLI1
-1kb +1kb 0.5
9
-1kb +1kb -1kb +1kb -1kb +1kb
1 T A G 2 T A
G
ATCG34
T
5
A GT CCT
A
67 CT GA 8 C T GA 9 CT
G
10 A CT G 11 G A CT 12 A T GCCTA13
Figure 2.14: EWS-FLI and FLI1 occupied similar sites in a normal cellular context. Heatmap showing normalized ChIP-seq signals of EWS-FLI or FLI1 in both Ewing Sarcoma cells and HUVECs around computationally predicted transcription factor binding sites of ETS, Max, NFkB, STAT, PPAR, HNF4, and CREB. Sequence logos corresponding to the computationally predicted motif are shown on the left. Color was assigned on a log2scale from 0.5 to 9.
0.5 9 HUVEC
EWS502
FLI1 EWS-FLI
GGAA repeat
ETS
ETS-AP-1
AP-1
GATA
FLI1 EWS-FLI
ETS (MotifMap)
Max (MotifMap)
NFkB (MotifMap)
STATx (MotifMap)
PPAR (MotifMap)
HNF4 (MotifMap)
CREB (MotifMap)
-1kb +1kb -1kb +1kb -1kb +1kb -1kb +1kb
Figure 2.15: Permutation abolished EWS-FLI and FLI1 signal enrichment at all identified sites. One permutation of GGAA repeats, ETS, ETS-AP-1, AP-1, GATA, as well as the 7 computationally predicted motifs presented in Figure 2.14 shows the observed pattern is non-random. Color was assigned on a log2 scale from 0.5 to 9.
elements were also enriched by FAIRE, including SINEs, LINEs, and other types of simple and microsatellite repeats (data not shown). Together, these data support the utilization of the microsatellites as transcriptional enhancers. We also observed a striking difference in DNA sequence encoded nucleosome occupancy between EWS-FLI and FLI1-bound sites (Figure 2.20). Whereas FLI-bound sequences demonstrated high nucleosome occupancy, a feature of regulatory elements in higher eukaryotes [128], this pattern was not seen for EWS-FLI-bound regions, further supporting the unique attributes of EWS-FLI targeted domains.
2.2.7 EWS-FLI targets enhancer like elements altering and maintaining the local chromatin
environment
In addition to analyzing microsatellite regions we also assessed the chromatin structure and epigenetic status of each class of regions identified by differential chromatin targeting (Figure 2.8A). These data further support that the Ewing-specific clusters (clusters 1–2) ex-hibit an epigenetic pattern resembling that of an enhancer element only in tumor cells (Fig-ure 2.21A). Conversely, the endothelial-specific clusters (clusters 4–6) show an enhancer-like pattern unique to HUVEC. Distinct from the other clusters, sites in cluster 3, which exhibited binding by FLI1 in both cell types, were marked by H3K4me3. This epigenetic signature
Figure 2.16: Deregulation of repetitive elements in Ewing Sarcoma. A. Heatmap of normal-ized ChIP and FAIRE signal 3 kb around TSS ranked by gene expression in Ewing cells. Color was assigned on a log2 scale of -3 to 3 for ChIP and -6 to 2 for FAIRE. B.
Scale
chr7: 2715000050 kb 27200000 27250000
HOXA1 HOXA1 HOXA2HOXA3 HOXA3 HOXA4HOXA5 HOXA6 HOXA7HOXA9 HOXA10-HOXA9MIR196B HOXA10 HOXA10 HOXA10 HOXA11 HOXA11-AS1 HOXA13 NCRNA00213 EVX1 Scale
chr17: 44000000100 kb44050000 44100000 44150000
HOXB1HOXB2 HOXB3 HOXB4MIR10A LOC404266 LOC404266 HOXB5 LOC404266 LOC404266 HOXB6 LOC404266 HOXB7HOXB8 HOXB9 MIR196A1 PRAC NCRNA00253 MIR3185HOXB13 Scale
chr12: 5265000050 kb 52700000
HOXC13
HOXC12HOTAIRHOXC11HOXC10MIR196A2HOXC9HOXC8HOXC6HOXC5
HOXC4 HOXC6 HOXC5 MIR615 HOXC4 FLJ12825 Scale
chr2: 50 kb 176700000 176750000
EVX2HOXD13HOXD12
HOXD11
HOXD10HOXD9
HOXD8 HOXD8 HOXD8
MIR10BHOXD4HOXD3LOC401022 HOXD1
H3K4me1 H3K4me2 H3K4me3 H3K27me3 H3K4me1 H3K4me2 H3K4me3 H3K27me3 H3K4me1 H3K4me2 H3K4me3 H3K27me3 EWS502 HUVEC H1hESC H3K4me1 H3K4me2 H3K4me3 H3K27me3 H3K4me1 H3K4me2 H3K4me3 H3K27me3 H3K4me1 H3K4me2 H3K4me3 H3K27me3 EWS502 HUVEC H1hESC
Figure 2.17: UCSC Genome Browser snapshots of epigenetic patterns in EWS502 (black), HUVEC (orange), and H1hESC (green). Three of the four HOX clusters show activation and aberrant H3K27me3 patterns relative to normal cell types. Values are presented on a scale of 0 to 50 reads.
50 kb
102500000 102550000 102600000
PAX2 PAX2 PAX2 PAX2 PAX2
20 kb
226300000
WNT3A
H3K4me1 H3K4me2 H3K4me3 H3K27me3 H3K4me1 H3K4me2 H3K4me3 H3K27me3
H3K4me1 H3K4me2 H3K4me3 H3K27me3
EWS502
HUVEC
H1hESC
Figure 2.18: UCSC Genome Browser snapshots of epigenetic patterns in EWS502 (black), HUVEC (orange), and H1hESC (green). Normal H3K27me3 at PAX2 (left) and WNT3A (right), consistent with normal cell types. Values are presented on a scale of 0 to 50 reads.
demethylases.
2.3 Discussion
Lineage-specific outcomes are observed when chimeric transcription factors are expressed in various cell types, suggesting a major cell-specific influence on activity. One cell type may be permissive for transformation whereas other cells may not tolerate expression resulting in growth arrest or apoptosis. Cellular factors that influence activity may not be evident from studies of transcription factor-chromatin targeting limited to a single transcriptional regulator in a single cell type.
EWS502 H1-hESc GM12878 HUVEC K562 NHEK
0
10
20
30
40
50 H3K27me3
Percent of GGAA Repeats Overlapping Site
H3K4me1
0
5
10
15
20
0
2
4
6
8
10
0
1
2
3
4
5 EWS502 H1-hESc GM12878 HUVEC
K562 NHEK
Percent of GGAA Repeats Overlapping Site
EWS502 H1-hESc GM12878 HUVEC K562 NHEK
H3K4me2
Percent of GGAA Repeats Overlapping Site
EWS502 H1-hESc GM12878 HUVEC K562 NHEK EWS502 H1-hESc GM12878 HUVEC K562 NHEK
H3K4me3 FAIRE
0
2
4
6
8
10
12
14
Percent of GGAA Repeats Overlapping Site
-1kb Summit +1kb
0.4
0.5
0.6
0.7
0.8 EWS-FLI
FLI1
Average Predicted Nucleosome Occupancy
Figure 2.20: Predicted nucleosome occupancy of EWS-FLI and FLI1 binding sites. Average nucleosome occupancy predicted on DNA sequence [128] surrounding the summits of EWS-FLI and EWS-FLI1 binding sites in EWS502.
1 2 3 4 5 6 7 8 9 10 11 1 2 3 4
0.2
0.6
1.0
1.4
1 2 3 4 5 6 7 8 9 10 11 1 2 3 4
Fold-change in FAIRE (Relative to mock) 0
1
2
3
4 HUVEC + EWS-FLI Expression
B
EWS502 + EWS-FLI Silencing
Fold-change in FAIRE (Relative to mock)
0.2 0.6 1.0 0.2 0.6 1.0 0 2 4 6 8 10 0.2 0.6 1.0 0.0 0.5 1.0 1.5 2.0 0.0 0.5 1.0 1.5 2.0
Cluster 1 Cluster 2 Cluster 3 Cluster 4 Cluster 5 Cluster 6
Normalized Tag Count
Normalized Tag Count
EWS502
HUVEC
Summit +1kb
-1kb -1kb Summit +1kb -1kb Summit +1kb -1kb Summit +1kb -1kb Summit +1kb -1kb Summit +1kb
Summit +1kb
-1kb -1kb Summit +1kb -1kb Summit +1kb -1kb Summit +1kb -1kb Summit +1kb -1kb Summit +1kb
H3K4me1 H3K4me2 H3K4me3 H3K27me3 FAIRE 0.2 0.6 1.0 0.2 0.6 1.0 0 2 4 6 8 10 0.2 0.6 1.0 0.0 0.5 1.0 1.5 2.0 0.0 0.5 1.0 1.5 2.0 A
EWS-FLI-bound Sites Control EWS-FLI-bound Sites Control
C
of genomic targeting. Although FLI1 can bind the tetranucleotide repeats both in vivo and in vitro, in reporter-based assays it fails to show activity these repeats [111] [129] suggesting that FLI1 requires the cooperation of other sequence specific transcription factors to activate tran-scription. The association of ETS proteins with AP1 had been observed [130] [131] [132], and the functional association of EWS-FLI or FLI1 with AP1 and GATA1 has been demonstrated in cellular transformation and hematopoietic development [132] [133] [134]. However, our data also suggest selectivity in cooperating transcription factors. Although studies of ETS-1 identified cooperative binding with RUNX1 [123] and PAX5 [135], neither relationship was evident in this study.
Differential targeting of EWS-FLI was influenced by epigenetic factors. EWS-FLI bound microsatellite regions in tumor cells that were atypically marked with an enhancer like signa-ture, bound RNA polymerase II and resided in nucleosome depleted regions. Our data sug-gest that EWSR1 chimerism conferred nucleosome modification activity to EWS-FLI and is required for altering the local chromatin landscape resulting in nucleosome depletion or desta-bilization. However, the observation of widespread FAIRE enrichment of repetitive regions suggests that other factors may initially create a favorable chromatin arrangement permitting EWS-FLI targeting, a question currently being explored. The presence of RNA polymerase II suggests that these regions may be transcribed, a feature recently shown to be common among human epithelial cancers [136].
which contains a SET domain and in turn recruits other chromatin remodeling factors such as HDAC1, HDAC2, and mSin3B [146] [147].
This study demonstrates the prospect of translational cancer genomics. The persistent “addiction” of the tumor to aberrant transcription offers a unique therapeutic opportunity. Consequently, genomic dysreguation through EWS-FLI-specific enhancers mediated by novel chromatin modifying activity offers the potential for targeted small molecule design. Also, comparative chromatin immunoprecipitation and the comprehensive identification of regula-tory elements by FAIRE offer strategies to narrow the search space for regions of the genome that might play a role in tumor development. One such example is the repeat near IGF1 that is bound by EWS-FLI in cancer cells and differed in length from the reference genome. This finding suggests that length polymorphisms may influence EWS-FLI targeting and gene reg-ulation as has been found for the GGAA repeat length polymorphism observed nearNR0B1 for which expression correlated with the number of repeats [115]. The identification of an ex-tended tandem repeat proximal toIGF1may be of significance for disease development and treatment, since EWS-FLI-mediated IGF1 expression and signaling has been implicated in Ewing Sarcoma development [148] [149], and inhibition of IGF1 signaling is being studied as a potential therapeutic strategy. Such polymorphisms could arisede novoduring tumor devel-opment or represent an allelic selection in individuals, and the observed selection for longer repeats could represent a mechanism to augment target gene expression. Further work will be necessary to determine the functional significance of polymorphisms or other mutations on disease susceptibility, onset, progression, and treatment.
2.4 Methods
2.4.1 Cell culture
2.4.2 Lentiviral knockdown-expression
A short hairpin region complementary to the 30 untranslated region of FLI1
(50 -TGCCCATCCTGCACACTTACTTCAAGAGAGTAAGTGTGCAGGATGGGCTTTTTTC-30 sense strand) together with PCR-generated HA-tagged EWS-FLI, HA-tagged EWR1, and HA-tagged FLI1 were cloned into pLL5.5 [150]. Lentivirus was produced in HEK293T cells as described [150]. EWS502 or HUVEC cells were infected with lentivirus in the presence of polybrene (6 µg/mL) for 3 h after which media was changed. Chromatin or RNA was isolated at 72 h (see below).
2.4.3 Chromatin Immunoprecipitation (ChIP) and Formaldehyde-Assisted Isolation of
Regu-latory Elements (FAIRE)
Chromatin was isolated and immunoprecipitation was performed as described in [151] using 2 µg of HA antibody (Abcam ab9110), H3K4me1 (Abcam ab8895), anti-H3K4me2 (Abcam ab32356), anti-H3K4me3 (Abcam ab12209), anti-H3K27me3 (Millipore 07-449), anti-RNA Pol II (Abcam ab103968, or H3 (kindly provided by the Strahl lab) . Im-munoprecipitated DNA was prepared for high-throughput sequencing per manufacturer’s rec-ommendations (Illumina) including DNA purification using AMPure XP beads (Agencourt) before PCR amplification. Quantitative PCR was performed as described (Absolute SYBR Green ROX Mix, Thermo Scientific). PCR primers are available upon request. FAIRE was performed on three independent cell harvests as previously described [73], and isolated DNA was prepared for sequencing as above.
2.4.4 Quality Control and Reference Genome Alignment
large-scale repetitive elements were then removed. Reads from FAIRE were allowed to po-tentially map to up to four genomic locations, but the best scoring alignment was chosen. Biological replicates were then merged, cross-replicate correlation was assessed, and reads were extendedin silicoto a final length of 134 bp. Any extended reads that overlapped large-scale repetitive elements were then removed.
2.4.5 Peak calling and permutation
Areas of significant enrichment were identified using the Zero Inflated Negative Binomial Algorithm (ZINBA, [110]). A window size and offset of 250 bp and 50 bp, respectively, were utilized for EWSR1 and FLI1 and 500 bp and 125 bp for EWS-FLI. In all cases, a mixture regression model was created using a combination of the input control, GC content, and a background derived copy number variation model. Windows with q-values exceeding 0.95– 0.99 were considered statistically significant, and peak boundaries were further refined when necessary. Additional parameters were specified to account for the broad nature of H3K27me3 domains. The percentage of peaks and average signal over a meta-gene were calculated using CEAS [153] and plotted in R. For analyses of GGAA repeat length, peak coordinates were permuted 1000 times across the uniquely-mappable genome while maintaining chromoso-mal distribution using BEDTools [154]. The frequency of tandem GGAA/TTCC repeats was computed for lengths 1–25 and compared to that of the test peak coordinates to compute a two-sided p-value.
2.4.6 Hierarchical Clustering and Motif Identification
den-drogram and heatmap were created in Java Treeview [156]. Regions identified by clustering analysis were narrowed to a refined window immediately around the location of binding by intersecting the union set of all 200 bp windows around the site of greatest signal (summit). De novomotif detection was performed using CisFinder [119] using the 200 bp flanking se-quence as background. Motif heatmaps were created by calculating the input-normalized number of sequencing reads for each sample in the 2 kb region surrounding each identified motif location.
2.4.7 Flow Cytometry
CHAPTER 3
VARIATION IN CHROMATIN ACCESSIBILITY IN HUMAN KIDNEY CANCER LINKS H3K36 METHYLTRANSFERASE LOSS WITH WIDESPREAD RNA
PROCESSING DEFECTS
3.1 Introduction
downstream targets, including vascular endothelial growth factor (VEGF) and other genes [164] [165] [163]. Third, besidesVHLand chromatin regulators, mutations in other cancer-associated pathways are generally absent from ccRCC tumors.
Elucidating the functional consequences of mutations in genes encoding chromatin reg-ulatory proteins on chromatin organization and transcription in human tumor specimens re-quires the application of techniques developed for cultured cells to primary human tissues. Formaldehyde-Assisted Isolation of Regulatory Elements (FAIRE) interrogates chromatin ac-cessibility by isolating nucleosome-depleted regions of DNA [166] [72] [73] [10] [74]. These regions harbor regulatory elements such as active transcriptional start sites, transcriptional enhancers, insulators, silencers, and locus control regions [72] [73] [10] [15] [54] [74]. As a component of the ENCODE project, FAIRE has been used to identify regulatory elements across a wide range of cell lines [54] [167]. However, the application of FAIRE to primary human tissue or to explore the association between chromatin and genetic alterations in cancer has yet to be evaluated.
in H3K36me3 deficiency [178]. A similar rate ofSETD2mutation has also been observed in high-grade gliomas [179]. A recent study of intratumor heterogeneity in ccRCC identified distinctSETD2mutations in all subsections of the same tumor suggesting the importance of disrupting SETD2 function for a subset of tumors [178].
We found that SETD2mutation was associated with chromatin accessibility differences preferentially in gene bodies, and these genes frequently exhibited RNA processing defects. Nearly 25% of all expressed genes demonstrated aberrancies in splicing, including exon skip-ping, intron retention, and alternative transcription start and termination sites. We observed that misspliced exons were marked by a striking increase in chromatin accessibility immedi-ately upstream of the aberrant splice and a loss of nucleosome occupancy directly over the exon. This study represents the first investigation of chromatin organization in human tumors to identify the impact of chromatin modifier mutations on the genomic landscape. Under-standing chromatin dysregulation in cancer may ultimately inform the application of emerging classes of chromatin-targeted small molecules in renal cancer.
3.2 Results
3.2.1 Differences in chromatin accessibility between tumors and normal kidney tissue
corrobo-rate the underlying role of HIF in ccRCC
approximately 50% of tumors demonstrated FAIRE enrichment at regions in Cluster 2.
We then examined each cluster for shared biological associations among the loci and ad-jacent genes. Regions in each cluster were associated with genes (GREAT, [118]). For sites in Cluster 1, 2,274 genes were identified, many of which members of several cancer-associated gene sets. Particularly interesting in the setting of ccRCC, where HIF transcription factor family stabilization and activation of hypoxia response genes is a central feature of this tumor type, we found the most significantly associated genes in this cluster were involved in HIF ac-tivation and hypoxia regulation (Figure 3.2C, full list of associations for each cluster in Figure 3.3). This association was not observed for regions in Cluster 2 or 3 (Figure 3.3). Analysis of the sequences in Cluster 1 identified several highly enriched Transcription Factor (TF) motifs [181], including the hypoxia response element consensus binding sequence (Figure 3.2D). We additionally found that previously identified HIF1A and HIF2A (EPAS1) binding sites [180] only significantly overlapped loci in Cluster 1 (p<0.001, Figure 3.2B, E). The detection of features associated with the hypoxia response through variation in chromatin accessibility is consistent with the unique link between HIF activity and ccRCC, and these results demon-strate the ability of FAIRE to detect central biological pathways through the identification variations in chromatin organization in an unbiased fashion.
3.2.2 SETD2mutations link H3K36me3 loss with changes in chromatin accessibility