SMALL RNA TRANSCRIPTOMIC ANALYSIS DURING CHRONIC VIRAL HEPATITIS AND CANCER
Sara R. Selitsky
A dissertation submitted to the faculty at the University of North Carolina at Chapel Hill in partial fulfillment of the requirements for the degree of Doctor of Philosophy in the Curriculum in Bioinformatics and
Computational Biology
Chapel Hill 2015
ABSTRACT
Sara R. Selitsky: Small RNA transcriptomic analysis during chronic viral hepatitis and cancer (Under the direction of Praveen Sethupathy and Stanley M. Lemon)
Hepatitis B virus (HBV) and hepatitis C virus (HCV) are unrelated non-cytopathic viruses
that infect the liver1. Hundreds of millions of people worldwide are chronic carriers of HBV or
HCV, and together these viral infections are responsible for ~80% of hepatocellular carcinoma
(HCC). Numerous reports suggest that certain microRNAs (miRNAs, small non-coding RNAs
that regulate gene expression post-transcriptionally2) are important in the pathogenesis of viral
hepatitis, although very few studies have assessed them comprehensively. Furthermore, no
study of viral hepatitis or HCC has analyzed other classes of small RNAs, such as tRNA-derived
RNAs (tDRs). tDRs have recently been suggested to play a role in human health, although they
have never been previously assessed in primary human tissue.
Our goal was to characterize thoroughly the small RNA transcriptome in chronic viral
hepatitis and HCC. We used high-throughput sequencing to conduct an unbiased profiling of small (14-40 nts) RNAs in liver from Japanese subjects with advanced hepatitis B or C and
paired HCC. We also analyzed gene expression data (microarray) and determined that pathways controlling cholesterol homeostasis were among the most significantly altered in
chronic viral hepatitis and especially in HCC. An integrative analysis of miRNA and gene expression data predicted several candidate master miRNA regulators of each disease state,
including miR-21 and miR-27. We validated in cell culture the roles of miR-21 and miR-27 as regulators of cholesterol synthesis, suggesting that these two miRNAs may be responsible in
RNA-seq, we observed that tDRs were abundant and significantly increased in chronic viral
hepatitis. Remarkably, tDR abundance exceeded that of miRNAs in most infected
non-cancerous tissue. In cancer tissue, the total abundance of tDRs was reduced and the relative
abundance of individual tDRs was altered. Despite the potential relevance of tDRs to human
health and disease, there is no standardized nomenclature, and no method has yet been
developed to quantify tDRs from small RNA-seq datasets. To ameliorate these limitations, I
ACKNOWLEDGEMENTS
My project would not have been possible without the guidance, hard work, and insight of
others. I would like to think the lab members of both the Sethupathy and Lemon labs. I am
especially grateful to my mentors Praveen Sethupathy and Stan Lemon. I would also like to
thank Jeanette Baran-Gale, for her role as my computational mentor. I would like to thank
Daisuke Yamane, Takahiro Masaki, Bailey Peck, Lisa Kurtz, and Emily Fannin for their help with
experiments. Lastly, I would like to thank our collaborators Masao Honda, Tetsuro Shimakami,
TABLE OF CONTENTS
LIST OF TABLES ... ix
LIST OF FIGURES ... x
LIST OF ABBREVIATIONS ... xii
CHAPTER 1 ... 1
Introduction ... 1
1.1 Hepatitis B and C viruses ... 1
1.2 Non-coding RNAs ... 2
1.1a miRNAs ... 2
1.1b tRNA-derived RNAs ... 3
1.3 Assessment of non-coding RNAs in chronic viral hepatitis and cancer ... 4
CHAPTER 2 ... 7
2.1 Overview ... 7
2.2 Introduction ... 8
2.3 Results ... 9
2.3a Pathways mediating cholesterol homeostasis are prominently altered in chronic viral hepatitis and liver cancer ... 9
2.3b Small RNA transcriptome analysis identifies novel differentially expressed microRNAs in chronic viral hepatitis and liver cancer ... 11
of the rate-limiting enzyme, HMG-CoA-Reductase ... 15
2.3e Model of miRNA-mediated regulation of cholesterol metabolism in chronic viral hepatitis and associated HCC ... 16
2.4 Discussion ... 17
2.5 Materials and methods ... 19
CHAPTER 3 ... 34
3.1 Overview ... 34
3.2 Introduction ... 34
3.3 Results ... 36
3.3a tRNA-half abundance is significantly increased in chronic viral hepatitis ... 36
3.3b tRNA-half abundance is altered in viral hepatitis associated cancer ... 38
3.3c tRNA-half abundance correlates with angiogenin levels in HBV-associated cancer ... 38
3.4 Discussion ... 39
3.5 Materials and Methods ... 42
Chapter 4 ... 56
4.1 Overview ... 56
4.2 Introduction ... 56
4.3 Results and Discussion ... 59
4.3a Small RNA-seq datasets from four categories of human cell types / tissues ... 59
4.3b Details of tDRmapper ... 61
4.3c Analysis of different categories of cell types/tissues shows that tDR profiles are specific to tissue, disease and stage of differentiation ... 71
Table 2.1. Results of pathway enrichment analysis of
chronic viral hepatitis and cancer ... 22
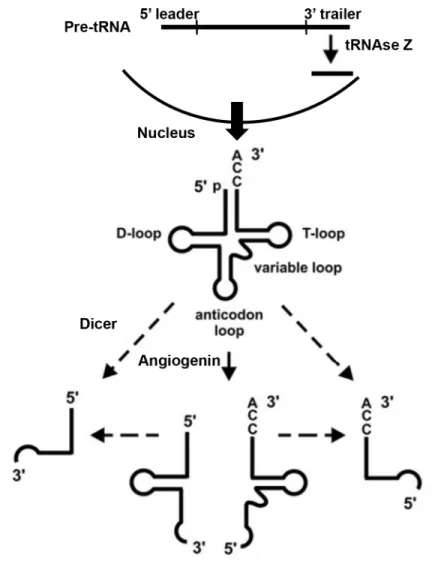
Figure 1.1 tRNA-derived RNA biogenesis schematic. ... 6
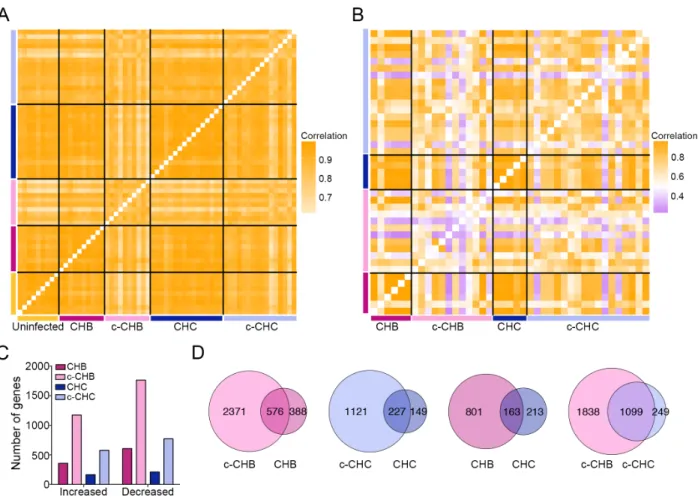
Figure 2.1 Global gene expression in chronic viral hepatitis and cancer ... 25
Figure 2.2 Expression of genes in the cholesterol synthesis pathway in chronic viral hepatitis and cancer ... 26
Figure 2.3 Global miRNA expression in chronic viral hepatitis and cancer ... 27
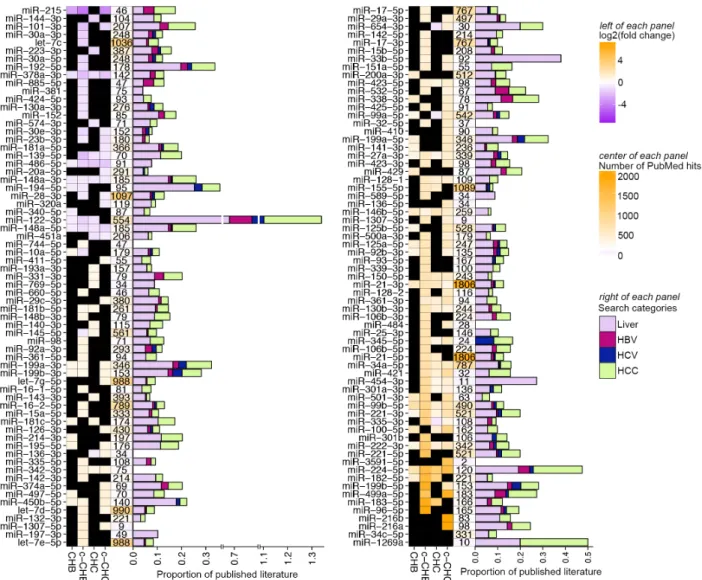
Figure 2.4 Published literature on miRNAs that are differentially expressed in chronic viral hepatitis and liver cancer ... 28
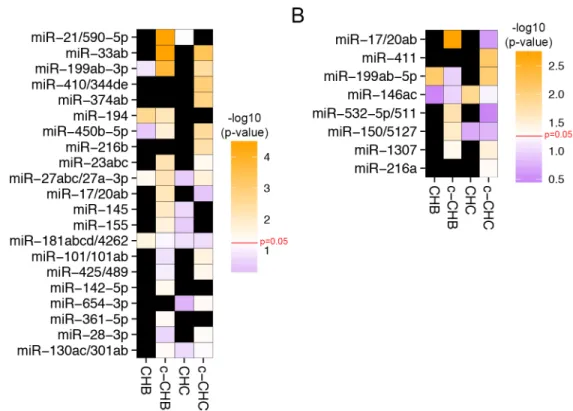
Figure 2.5 Candidate miRNA master regulators of gene expression profiles in chronic viral hepatitis and associated liver cancer ... 29
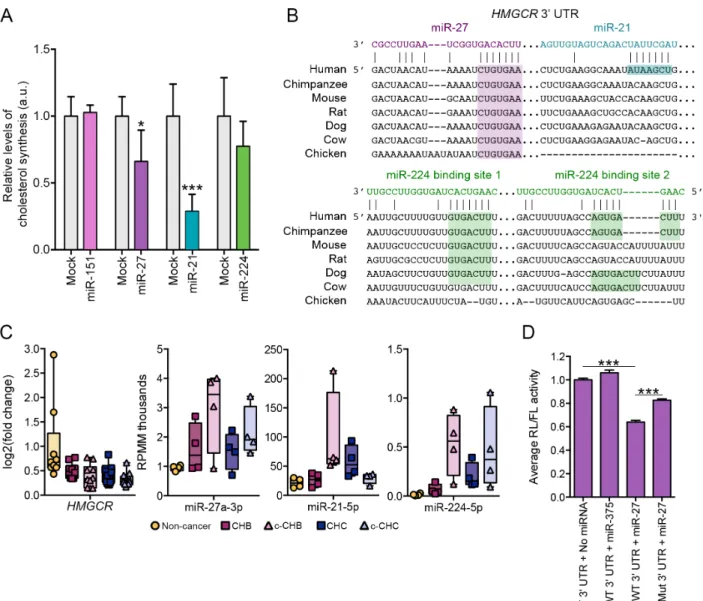
Figure 2.6 Candidate miRNA master regulators miR-27 and miR-21 control cholesterol synthesis in vitro ... 30
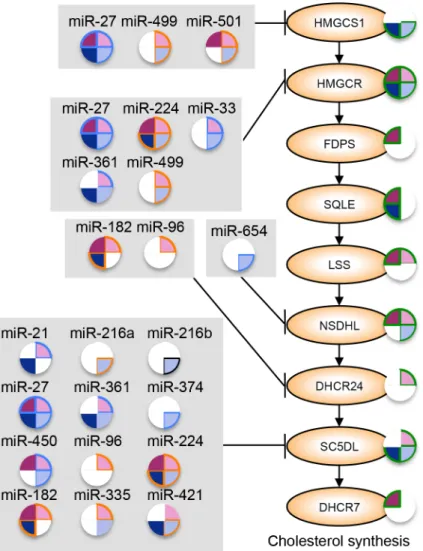
Figure 2.7 Model of miRNA regulation of cholesterol synthesis in chronic viral hepatitis and associated liver cancer ... 31
Figure 2.8 Model of miRNA regulation of cholesterol transport nd efflux in chronic viral hepatitis and associated cancer ... 32
Supplemental Figure 2.1 miR-122-3p and miR-122-5p comparison. ... 33
Figure 3.1 tRH abundance in HBV- and HCV-infected liver ... 45
Figure 3.2 5’ tRH abundance in HBV- and HCV-associated hepatocellular carcinoma ... 46
Figure 3.3 Angiogenin expression in viral hepatitis and hepatocellular carcinoma ... 47
Supplemental Figure 3.1 ... 48
Supplemental Figure 3.2 ... 49
Supplemental Figure 3.3 ... 50
Supplemental Figure 3.4 ... 51
Supplemental Figure 3.5 ... 52
Supplemental Figure 3.8 ... 55
Figure 4.1 Relative abundance of all tRNA-derived RNAs
across four categories of human cell types/tissues ... 74
Figure 4.2 Schematic of tDRmapper ... 75 Figure 4.3 Proportion of “error types” for specific tRNA-derived
RNAs across different tissues and diseases ... 76
Figure 4.4 Diagrammatic representation of the naming
scheme for tRNA-derived RNAs ... 77
Figure 4.5 Examples of mature tRNA coverage maps from
each category of human cell types/tissues ... 79
Figure 4.6 Example of pre-tRNA coverage maps ... 80
Figure 4.7 Comparison of tDR profiles across four categories
c-CHB Chronic hepatitis B associated cancer
c-CHC Chronic hepatitis C associated cancer
CHB Chronic hepatitis B
CHC Chronic hepatitis C
DE Differentially expressed
HBV Hepatitis B virus
HCC Hepatocellular carcinoma
HCV Hepatitis C virus
IPA Ingenuity Pathway Analysis
miRNA microRNA
mRNA Messenger RNA
nt nucleotide
RL Renilla luciferase
TCGA The Cancer Genome Atlas
tDR Transfer RNA-derived RNA
tRF Transfer RNA-fragment
CHAPTER 1
Introduction
1.1 Hepatitis B and C viruses
HBV and HCV are phylogenetically unrelated non-cytopathic viruses that infect the liver1.
HBV is in the family Hepadnaviridae3. HBV’s genome is approximately 3,200 nts long and is a
partially double-stranded circular DNA genome. HCV is in the family Flaviviridae3. HCV’s
genome is approximately 9,600 nts long and is a positive-strand RNA genome. While HBV is a
DNA virus, and HCV is an RNA virus, upon infection both can either be cleared within a few
months4 or become chronic. Hundreds of millions of people worldwide are persistent carriers of
HBV or HCV, 30-50% of whom develop chronic liver disease5. Together, these viral infections
are responsible for ~60% of liver cirrhosis and ~80% of hepatocellular carcinoma (HCC), a
leading cause of cancer-related deaths worldwide.
HBV and HCV related HCC arises from the liver disease associated with these chronic
infections as well as viral specific factors1. Small RNAs have also been shown to play a role in HCC development. For example, carcinogenesis in HCC is promoted by miR-21 targeting
PTEN6, a tumor suppressor, and miR-224 acting as an oncogene, by activating AKT signaling7. The mechanisms by which HBV and HCV cause cancer is an active area of research and our
analysis of small RNAs in these disease states contributes to the overall understanding of disease pathogenesis. Although there is a vaccine for HBV, there is currently no cure;
disease pathogenesis will lead to the development of more effective diagnostic and therapeutic
strategies.
1.2 Non-coding RNAs
Non-coding RNAs are defined as RNAs that are not translated into proteins. This is a broad
category of RNAs that includes transfer RNAs (tRNAs), ribosomal RNAs, long non-coding
RNAs, small nucleolar RNAs, circular RNAs, piwi-interacting RNAs, microRNAs (miRNAs), and
tRNA-derived RNAs (tDRs). Some of these non-coding RNAs have been described and studied
for decades while others have recently been discovered through new advances in sequencing
technology8. In this study, we focused on two classes of small non-coding RNAs, miRNAs and
tDRs.
Numerous studies suggest that miRNAs may be important in the pathogenesis of
chronic viral hepatitis. However, to the best of our knowledge, only one study has attempted to
profile small RNAs using the state-of-the-art technology, small RNA sequencing, in chronic viral
hepatitis and cancer9. Also, no study of viral hepatitis or HCC has included an analysis of tDRs.
1.1a miRNAs
miRNAs are small (~22 nt) non-coding RNAs that regulate gene expression
post-transcriptionally2. miRNAs are loaded onto an Argonaute protein in the RNA-induced silencing complex, which then targets an mRNA through complementary binding of the seed region
(generally nts 2-7) of the miRNA, leading to either inhibition of translation or increased rate of messenger RNA (mRNA) degradation2. In miRBase10, there are currently 2,588 mature known
miRNAs in the human genome, and a single miRNA may be capable of targeting hundreds of
mRNAs11.
The importance of miRNAs in human health is a topic of extensive study. miRNAs are
often associated with disease. Notably, miRNAs have been implicated in various cancers,
function of miRNAs, computational predictions of the altered regulatory interactions between
miRNAs and mRNAs are possible by assessing mRNA and miRNA expression profiles in
different disease states2. In Chapter 2, we described an integrative analysis of mRNA and
miRNA profiles of subjects with chronic viral hepatitis and cancer. We determined the candidate
miRNA master regulators of these disease states and experimentally validated the predicted
functions of two of these miRNAs.
1.1b tRNA-derived RNAs
Transfer RNAs, or tRNAs, are non-coding RNAs that deliver amino acids to ribosomes
during translation. tDRs are small RNAs that are enzymatically processed from either nascent
pre-tRNA transcripts or mature tRNAs12. Multiple “types” of tDRs have been described, such as
tRNA-halves (30-35 nts) and tRNA-fragments (<28 nts). tDR biogenesis differs depending on
the tDR size and location of origin (Figure 1.1). tRNA-halves are created by cleavage in the
anticodon loop by the ribonuclease Angiogenin13, which is a process induced by stress13,14. The
relationship between halves and Angiogenin is further explored in Chapter 3.
tRNA-fragments are processed by a variety of different enzymes, depending on their location of origin.
tDRs derived from the 3’ trailer of the pre-tRNA are produced during tRNA maturation, by
tRNAse Z15. Some of the tDRs that are derived from the 5’ end of mature tRNAs are Dicer
dependent, while others are Dicer independent. tDR biogenesis is still incompletely known. tDR’s regulated biogenesis and well-defined 5’ and 3’ ends indicate that they are not
stochastic products of tRNA degradation16. tDRs are generated in organisms from all domains of life15. They are derived from most tRNA genes, produced in varying abundance, in many
different sizes, and from different regions of the tRNA. Several functions have been attributed to
tDRs such as post-transcriptional gene regulation17, translational repression18, stress granule
formation19, and protection from apoptosis20; however, all of these have been in the context of
The relevance of tDRs in human health is starting to emerge. For example, tDRs may be
important immune regulators. Trypanosoma cruzi, the parasite responsible for Chagas disease, releases extracellular vesicles that contain a high abundance of tDRs, which promote infection
susceptibility of mammalian cells21 by modulating the host’s immune related genes22. Another
possible example of tDRs having an immune modulatory effect is that they are found in high
abundance in mature mouse sperm23 and in human seminal exosomes24 (semen is a known
immune modulator). tDRs may also be associated with neurodegeneration25. Mutations in
angiogenin, the enzyme that cleaves a tRNA to form two tRNA-halves14, are associated with
both amyotrophic lateral sclerosis and Parkinson disease26. Finally, tDR expression may
increase with specific viruses; respiratory syncytial virus in A549 cells induces tDR formation,
but not human metapneumovirus27. We hypothesized that tDRs also play a role in viral hepatitis
pathogenesis and carcinogenesis. However, they have not been studied previously in the
context of viral hepatitis and liver cancer, and, to the best of our knowledge, no studies have
even assessed tDR abundance in primary human tissue. In Chapter 3, we report on the
characterization of the tDR profile in viral hepatitis and cancer.
Despite the potential biomedical significance of tDRs, the field is lagging behind other
small RNA fields in terms of genomic annotation and strategies for quantification from small
RNA-sequencing data. This is due in large part to the unique computational challenges of mapping tDRs from small RNA-seq data and the lack of a standardized nomenclature for tDRs.
We developed a novel method that quantifies and annotates tDRs, tDRmapper, which is discussed in Chapter 4.
1.3 Assessment of non-coding RNAs in chronic viral hepatitis and cancer
This study provides a deeper understanding of how small RNAs contribute to viral
hepatitis pathogenesis and carcinogenesis by use of microarray and small RNA-sequencing of
chronic hepatitis B, chronic hepatitis C, and associated HCC. We defined the small RNA profiles
compared to uninfected controls, and which determined which miRNAs are likely regulating
these pathways (Chapter 2). We performed an in-depth analysis of tDRs and determined which
tDR species are present and how their abundance changes during infection and in cancer
(Chapter 3). Lastly, we developed a publically available bioinformatics tool, tDRmapper, which classifies and quantifies tDRs, and produces an automatic visualization of the tDR profile
CHAPTER 2
Transcriptomic analysis of chronic hepatitis B and C and liver cancer reveals
microRNA-mediated control of cholesterol synthesis programs
2.1 Overview
HBV and HCV are phylogenetically unrelated hepatotropic viruses that persistently infect
hundreds of millions of people world-wide, often leading to chronic liver disease and HCC.
Chronic hepatitis B (CHB), chronic hepatitis C (CHC), and associated HCC are characterized by
cholesterol imbalance and dyslipidemia; however, the key regulatory drivers of these
phenotypes are poorly understood. Using gene expression microarrays as well as
high-throughout sequencing of small RNAs, we performed integrative analysis of miRNA and gene
expression in non-malignant and matched cancer tissue from human subjects with CHB or CHC
and HCC. We also carried out follow-up functional studies of specific miRNAs in a cell-based
system. These studies led to four major findings. Firstly, pathways affecting cholesterol
homeostasis were among the most significantly over-represented among genes dysregulated in
chronic viral hepatitis and especially in tumor tissue. Secondly, for each disease state, specific
miRNA signatures were identified that included miRNAs not previously associated with chronic viral hepatitis, such as 1307 in CHC. Notably, a few miRNAs, including 27 and
miR-224, were components of the miRNA signatures of all four disease states: CHB, CHC, CHB-associated HCC and CHC-CHB-associated HCC. Thirdly, using a statistical simulation method
regulators of pathways controlling cholesterol homeostasis in chronic viral hepatitis and HCC,
including miR-21, miR-27, and miR-33. Lastly, we validated in human hepatoma cells that both
miR-21 and miR-27 significantly repress cholesterol synthesis, and that miR-27 does so in part
through regulation of the gene that codes for the rate-limiting enzyme HMG-CoA-Reductase
(HMGCR).
2.2 Introduction
HBV and HCV are non-cytopathic viruses that both exhibit marked tropism for liver
parenchymal cells and persistently infect hundreds of millions of people world-wide, often
leading to chronic liver disease and cancer1. Together, these viral infections are responsible for
~80% of HCC, which is the third leading cause of cancer-related deaths. Though HBV and
HCV are phylogenetically unrelated viruses, chronic infections with either can lead to
dyslipidemia and cholesterol imbalance28-31. Liver cancer is also associated with aberrant lipid
and lipoprotein metabolism32,33. However, the pathogenic mechanisms underlying the
dysregulation of lipid pathways in CHB, CHC, and HCC are poorly understood.
miRNAs which are small RNAs that post-transcriptionally regulate gene expression,
have emerged as critical modulators of lipid homeostasis34-36. The first miRNA that was
reported to control lipid pathways in the liver was miR-12237, which was also subsequently shown to promote HCV replication38. Since the discovery of miR-122, several other miRNAs
have been implicated in the control of lipid homeostasis. For example, miR-34a contributes to hepatic steatosis via regulation of sirtuins39, miR-33 controls cholesterol flux through regulation
of ATP-binding cassette transporters40-42, miR-30 regulates lipoprotein secretion by repressing
microsomal triglyceride transfer protein43, and miR-29 fine-tunes the FOXA2-controlled gene
network governing lipid homeostasis44. We hypothesize that miRNAs play a key role in the lipid
In this study, we performed an integrative analysis of miRNA and gene expression
profiles in non-malignant and matched cancer tissue from patients with CHB or CHC and
associated HCC. This study represents only the second sequencing-based profiling of miRNAs
in chronic viral hepatitis. We report four major findings. First, we established that cholesterol
synthesis and metabolism pathways are among the most dominantly altered in each of the
disease states, particularly HCC. Second, we defined for each disease state distinct liver
miRNA signatures that included miRNAs not previously associated with viral hepatitis. Third,
we identified by integrative analysis of small RNA and mRNA expression data a suite of
miRNAs that represent candidate drivers of the altered cholesterol pathways in chronic viral
hepatitis. Fourth, we validated through cell-based assays that miR-27, which is prominently
dysregulated in both CHB and CHC as well as in HCC, significantly represses cholesterol
synthesis in part through regulation of the gene that codes for the rate-limiting enzyme
HMG-CoA-Reductase (HMGCR).
2.3 Results
2.3a Pathways mediating cholesterol homeostasis are prominently altered in chronic
viral hepatitis and liver cancer
We interrogated previously described gene expression microarray data sets from
matched cancer and non-cancer liver tissue collected from Japanese adults with chronic
hepatitis B (CHB, n=10) or hepatitis C (CHC, n=16) and HCC (c-CHB, n= 10; c-CHC, n=16) as
well as uninfected controls (n=9) (Supplemental Table S2.1)16,45. Correlation analyses of gene
expression profiles showed that all samples within each disease category were highly correlated
with each other (Fig. 2.1A), although the cancer samples were less strongly correlated (c-CHB
median pairwise r2 = 0.86, c-CHC median pairwise r2 = 0.88) than the non-malignant CHB and
We then repeated this analysis using publically available RNA-sequencing data from
The Cancer Genome Atlas (TCGA, https://tcga-data.nci.nih.gov/tcga/) for 18 c-CHB and 6
matched CHB as well as 18 c-CHC and 5 matched CHC. We again found that the cancer
samples were more poorly correlated (c-CHB median pairwise r2 = 0.58, c-CHC median pairwise
r2 = 0.70) with each other compared to the non-cancer samples (median pairwise r2 = 0.98) (Fig.
2.1B). The weaker pairwise correlations among c-CHB and c-CHC samples in the TCGA cohort
compared to the microarray cohort may be due at least in part to the much higher dynamic
range of expression provided by deep sequencing relative to microarray46, as well as increased
genetic heterogeneity (due to representation from several different ancestries) among
individuals in the TCGA cohort relative to the Japanese cohort.
Next, using the microarray data from the Japanese cohort, we identified genes that were
significantly differentially expressed (DE) in each of the four disease categories compared to the
uninfected controls. We found that CHB and c-CHB had twice as many DE genes than CHC
and c-CHC, respectively (Fig. 2.1C). Also, c-CHB and c-CHC had ~3-fold more DE genes than
their non-malignant counterparts (Fig. 2.1C). For both CHB and CHC, 60% of DE genes were
also significantly altered in the matched cancer samples (Fig. 2.1D). While only 17% of DE
genes in CHC were also shared with CHB, 82% of DE genes in c-CHC were shared with c-CHB
(Fig. 2.1D).
To determine the pathways that are most affected in each disease category, we
performed Ingenuity Pathway Analysis (IPA). We found that the DE genes in CHB and CHC were most significantly over-represented in distinct immune response pathways (Table 2.1A).
For genes uniquely DE in CHB, the most enriched pathway was CD28 signaling, which is critical
for T-cell activation and the production of interleukins47. For genes uniquely DE in CHC, the
most enriched pathway was interferon signaling, which is critical to innate immunity48. For genes
DE in both CHB and CHC, the most enriched pathways were related to lipid metabolism,
Lipid-related pathways were even more prevalent among the DE genes in c-CHB and c-CHC (Table
2.1B). For both CHB and CHC, the top three most significantly affected pathways were related
to the function of RXR, which together with LXR and FXR regulates cholesterol balance. For
genes DE in both c-CHB and c-CHC, another significantly enriched pathway was Aryl
Hydrocarbon Receptor (AHR) signaling, which is involved in the suppression of hepatic
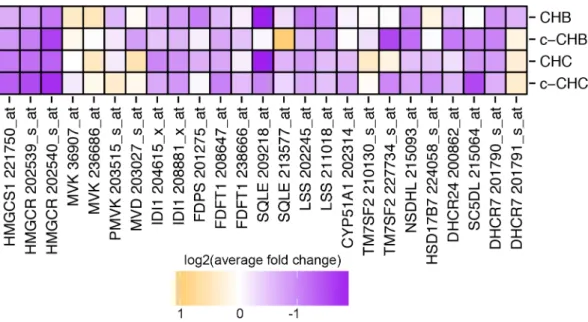
cholesterol synthesis52. Indeed, we found that many of the genes that code for enzymes in the
cholesterol synthesis pathway were down-regulated in all disease categories compared to
uninfected controls (Fig. 2.2).
2.3b Small RNA transcriptome analysis identifies novel differentially expressed
microRNAs in chronic viral hepatitis and liver cancer
Next we performed small RNA-sequencing in four liver samples from each of the
disease categories in the Japanese cohort (uninfected controls, CHB, CHB, CHC, and
c-CHC). Seven out of the 8 c-CHB and c-CHC samples were matched with their corresponding
non-malignant samples. We obtained an average of ~18 million reads from each, of which
~70% mapped to the genome. miRNAs and their isomiRs were annotated and quantified by our
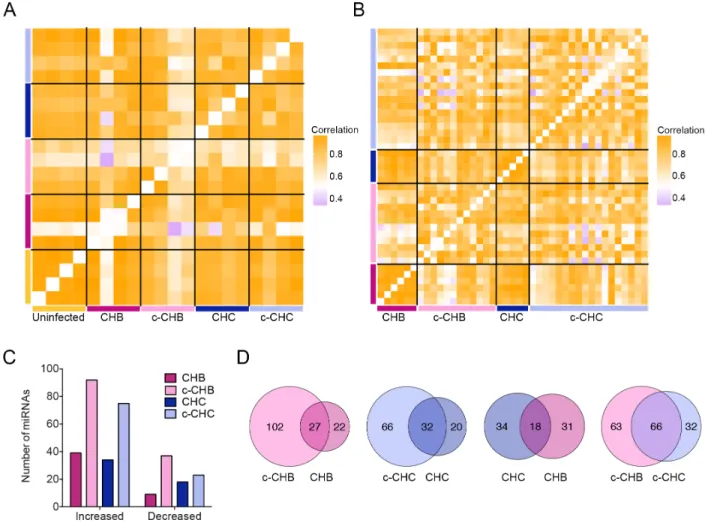
previously described small RNA-seq analysis pipeline (Methods). Within category correlation
analyses of miRNA expression profiles showed that uninfected controls were highly correlated (median pairwise r2 = 0.98), and as in the case of gene expression (Fig. 2.1A, B), the c-CHB
samples were the most poorly correlated (median pairwise r2 = 0.70) (Fig. 2.3A).
We repeated this analysis using publically available small RNA-sequencing data from
TCGA (https://tcga-data.nci.nih.gov/tcga/) for 12 CHB and 6 matched CHB as well as 18
c-CHC and 5 matched c-CHC. These patients represent a subset of the individuals for whom
RNA-seq data was available and analyzed (Fig. 2.1B). We quantified miRNAs according to our
previously described small RNA-seq analysis pipeline53, and confirmed that the cancer samples
0.79) with each other compared to the non-cancer samples (median pairwise r2 > 0.95) (Fig.
2.3B).
Next, using the small RNA-seq data from the Japanese cohort, we identified DE miRNAs
in each of the disease categories compared to the uninfected controls (Methods). The cancer
samples (c-CHB and c-CHC) had a greater number of DE miRNAs than the non-cancer
samples (CHB and CHC) (Fig. 2.3C). Among the cancer samples, c-CHB had the greatest
number of DE miRNAs (Fig. 2.3C). For each of CHB and CHC, ~60% of DE miRNAs were also
significantly altered in the matched cancer samples (Fig. 2.3D). While only 35% of DE miRNAs
in CHC were also shared with CHB, 67% of the DE miRNAs in c-CHC were shared with those in
c-CHB (Fig. 2.3D).
Figure 2.4 shows all 134 miRNAs that were DE in at least one disease category
compared to uninfected controls. Eleven of the 134 (miR-378a-3p, miR-486-5p, miR-148a-3p,
miR-148a-5p, miR-27a-3p, miR-146b-5p, miR-21-3p, miR-99b, miR-221, and miR-224) were DE
in all four disease categories compared to the uninfected controls. Several of these, including
miR-378a-3p and miR-27a-3p, have been associated previously with cholesterol homeostasis34.
Using an automated PubMed literature search (Methods), we determined that among the
miRNAs that were DE in at least one disease category, the one most studied in hepatitis and
associated liver disease is miR-122 (Fig. 2.4), which has also previously been shown to influence lipid metabolism37. Although miR-122-5p, which promotes HCV replication38, did not
satisfy our criteria for differential expression, miR-122-3p was significantly decreased in CHB, c-CHB, and CHC (Fig. 2.4). While miR-122-3p is relatively understudied compared to miR-122-5p,
we found that it was robustly expressed in all of the liver tissue samples (Supplemental Fig.
2.1). We also found that miR-122-3p co-immunopurifies with Argonaute 2 (AGO2) in extracts
from human hepatoma cells (FT3-7)16 and that its abundance in AGO2 immunoprecipitates is
These data suggest that despite the extensive focus in the literature on 5p,
miR-122-3p is likely also a functional miRNA and merits further detailed experimental investigation.
We identified several previously reported DE miRNAs, including miR-2154, miR-2755, and
miR-18156 in CHC; miR-19957, miR-14858, and miR-12559 in CHB; and miR-221/22260,
miR-10161, and miR-22462 in chronic viral hepatitis associated liver cancer. Many of the other DE
miRNAs that we identified, such as miR-215 and miR-340 in CHB; miR-1307 and miR-484 in
CHC; and miR-136-5p and miR-3591-5p in c-CHC, have not been well studied in the liver. All of
these miRNAs represent candidate regulators of the pathways altered in chronic viral hepatitis
and liver cancer, including those governing cholesterol synthesis and metabolism.
2.3c Several microRNAs are identified as candidate master regulators of pathways
mediating cholesterol homeostasis in chronic viral hepatitis and liver cancer
We next sought to identify DE miRNAs that represent potential key control points
(master regulators) in the networks that regulate gene expression in chronic viral hepatitis and
cancer. Using our previously developed tool miRHub (Methods), we identified 21 candidate
master miRNA regulators of genes down-regulated in at least one disease group: CHB, c-CHB,
CHC, or c-CHC (Fig. 2.5A). Among these 21, six were predicted to be master regulators in at
least two different disease categories: miR-33, miR-199-3p, miR-194, miR-450b, miR-23, and miR-27-3p (Fig. 2.5A). miR-33, miR-199-3p, miR-450b, and miR-27-3p were significantly
up-regulated in c-CHB and c-CHC (Fig. 2.4) and identified as potential master regulators of down-regulated genes in the same disease categories (Fig. 2.5A). Although hepatic miR-33 is a
known regulator of cholesterol homeostasis, it has only recently been studied in the context of
chronic viral hepatitis and HCC63. Both miR-199-3p and miR-27-3p are among the few miRNAs
that have been reported as regulators of phenotypes associated with chronic viral hepatitis
(cancer64 and dyslipidemia65,66, respectively). miR-194 and miR-23 were significantly
down-regulated genes. This finding is suggestive of transcriptional co-regulation of
miR-194/miR-23 and their target genes, consistent with the participation of these miRNAs in complex
regulatory motifs67.
We also identified 8 candidate master miRNA regulators of up-regulated genes in at
least one of the disease categories (Fig. 2.5B). Interestingly, all 8 miRNAs were significantly
up-regulated in the same disease categories for which they were predicted to be master regulators
of up-regulated genes. As with miR-194 and miR-23, one possible explanation for this finding is
the widespread use of incoherent feed-forward miRNA loops in liver gene regulatory networks67.
The strongest candidate master miRNA regulators in any disease category were miR-21
and miR-33, which were both up-regulated in c-CHB (Fig. 2.4), and predicted to exert greater
control of down-regulated genes in c-CHB than any other miRNA (Fig. 2.5A). miR-21 has been
reported previously as a critical mediator of c-CHB and suppressor of the host immune system
in CHC54. miR-33 is a key regulator of cholesterol homeostasis and has recently been
associated with hepatic steatosis and fibrosis in patients with CHC and CHB, respectively63.
For each miRNA predicted as a candidate master regulator of up- or down-regulated
genes in each disease category, we identified biological pathways significantly enriched among
its predicted target genes. We found that most candidate master regulator miRNAs were
predicted to target genes over-represented in pathways regulating lipid homeostasis. For example, among down-regulated genes in c-CHB, 12 of the 13 candidate master miRNA
regulators were predicted to target genes significantly over-represented in the PPARα/RXRα
activation pathway. Several of these 12, including miR-21 and miR-33, have been recently
reported as direct modulators of PPARα expression68 and miR-27-3p has been shown to target
and repress both PPARα68 and RXRα69. Transcriptional regulation by PPARα/RXRα contributes
in regulating cholesterol synthesis pathways in chronic viral hepatitis and associated liver
cancer.
2.3d miR-27 suppresses cholesterol synthesis via regulation of the rate-limiting enzyme,
HMG-CoA-Reductase
To evaluate whether the DE miRNAs contribute to the regulation of cholesterol
synthesis, we selected miR-21, miR-27, and miR-224 for functional follow-up analyses.
Specifically, we over-expressed each miRNA separately in human hepatoma cells (Huh7) grown
in lipoprotein-deficient serum and evaluated the effect on de novo cholesterol synthesis
(Methods). We found that all three DE miRNAs, but not a control miRNA (miR-151), suppressed
cholesterol synthesis (Fig. 2.6A). Interestingly, all three of these miRNAs have at least one
predicted seed sequence target site in the 3’ UTR of the HMG-CoA Reductase (HMGCR) gene (Fig. 2.6B), which encodes the rate-limiting enzyme in the cholesterol synthesis pathway. The
predicted target sites for miR-27 and miR-224 are conserved across several mammalian
species, whereas the predicted site for miR-21 is human-specific (Fig. 2.6B).
HMGCR mRNA was significantly decreased in all four disease categories, whereas miR-27 and miR-224 were significantly elevated in all four disease categories, and miR-21 was
increased in c-CHB and CHC (Fig. 2.6C). We have previously shown that miR-27 represses HMGCR expression65. To determine whether miR-27 may regulate HMGCR directly by targeting
its 3’ UTR, we mined a published database (http://ago.rockefeller.edu) of results from a high-throughput assay (AGO cross linking and immunoprecipitation followed by high-high-throughput
sequencing, or AGO-CLIP-seq) that identified miRNA target sites across the transcriptome in
P13 mouse brain, which expresses both miR-27 and HMGCR mRNA. We found evidence for AGO binding at the predicted miR-27 site, but not at the predicted sites for miR-21 (explained by
the fact that this site is human-specific) or miR-224 (confounded by lack of robust miR-224
UTR reporter gene assay. Specifically, the entire HMGCR 3’UTR was PCR-amplified from human genomic DNA and cloned into the PsiCheck2 expression vector, downstream of the
Renilla Luciferase [RL] coding region (Methods). The recombinant PsiCheck2 vector was then transfected into HEK293T cells and relative RL activity was measured in the absence and
presence of oligonucleotide mimics of miR-27 or miR-375 (negative control). The miR-27 mimic
induced significant repression (Fig. 2.6D), whereas miR-375 had no effect. We then introduced
a mutation in the miR-27 target site via site-directed mutagenesis and demonstrated a partial
but still significant (p < 0.01) rescue of relative RL activity.
2.3e Model of miRNA-mediated regulation of cholesterol metabolism in chronic viral
hepatitis and associated HCC
At least nine genes in the cholesterol synthesis pathway were significantly
down-regulated in at least one disease category. Of these nine, four of the genes (HMGCS1,
HMGCR, DHCR24, and SC5DL) have evolutionarily conserved predicted target sites for ≥2
miRNAs that are up-regulated more than 5-fold in at least one disease category and/or identified
as master regulators of gene expression in at least one disease category (Fig. 2.7). Predicted
target sites for miR-499 and miR-224 are shared among two of the genes (HMGCS1/HMGCR and HMGCR/SC5DL, respectively) and three genes (HMGCS1, HMGCR, and SC5DL) harbor putative target sites for miR-27. These three miRNAs represent key direct regulators of the
cholesterol synthesis pathway in chronic viral hepatitis and associated liver cancer.
The LXR/RXR regulatory pathway is significantly enriched among dysregulated genes in
many of the disease groups (Table 2.1). This pathway is involved in the control of several
aspects of cholesterol metabolism, most notably cholesterol efflux (Fig. 2.8). Numerous genes
in the cholesterol efflux and transport pathway are significantly down-regulated in at least one
c-CHC. ABCA1 is predicted to be a target gene of 15 miRNAs that are up-regulated in at least one of c-CHB or c-CHC, including miR-33 and miR-27, which are established regulators of
cholesterol efflux through suppression of ABCA166,72.
2.4 Discussion
Based on gene expression microarray data, we found pathways relating to cholesterol
synthesis and metabolism to be the most significantly enriched among genes dysregulated in
the various disease states we studied, especially c-CHB and c-CHC. Interestingly, in the
non-cancer samples, although immune pathways were the most significantly enriched, the specific
immune pathways were different for CHB and CHC, which is consistent with distinct
inflammatory features and innate immune responses in each disease. The top enriched immune
pathway for CHC is interferon signaling and for CHB the top pathways are associated with both
the innate and the adaptive immune response, although not interferon signaling. Some
pathways, such as those controlling blood flow and coagulation (c-CHB and c-CHC), as well as
amino acid degradation (c-CHB), merit future investigation.
Studies of miRNAs in hepatitis C have been dominated by miR-122-5p, and only a few
other miRNAs have been investigated. miR-122-5p was previously found to be reduced in
patients with chronic hepatitis C, but the reduction was dependent on the IL28B genotype20. In this study, we performed small RNA-seq on two subjects from each IL28B genotype class (T/T
and T/G, based on SNP rs8099917). Similar to what was reported previously20,miR-122 levels were reduced only in the individuals with the T/G genotypes and not the T/T genotype. Because
our criteria for DE stipulated that the levels of a miRNA must change significantly and in the
same direction in 3 out of the 4 samples in a disease group, miR-122-5p was not deemed to be
DE in our study.
Our study points to the potential functional relevance of miR-122-3p, which has received
expression is robust and that it is effectively loaded and abundantly present on AGO2.
miR-122-3p was not a predicted miRNA master regulator of gene expression in any of the disease states,
but it does have several key predicted mRNA targets, including the interferon stimulated gene,
interferon induced protein with tetratricopeptide repeats 3 (IFIT3). We also show that a suite of other miRNAs, including miR-27, miR-33, miR-21, and miR-199, are significantly differentially
expressed in one or more of the disease states and also are predicted to be master regulators
of the disease gene expression profiles.
We showed that several of these “master regulator” miRNAs, notably miR-33, miR-21
and miR-27, are strongly associated with liver programs that control cholesterol homeostasis.
Since miR-33 is already well-established as a modulator of cholesterol metabolism, we focused
our functional studies on miR-27 and miR-21, as well as miR-224, which was among the most
highly up-regulated in all disease states. miR-27 and miR-21 both significantly suppressed de novo cholesterol synthesis in Huh7 cells by ~30% and ~70%, respectively. We demonstrated that the effect of miR-27 is likely mediated in part through direct regulation of the gene HMGCR, which encodes the rate-limiting enzyme in cholesterol biosynthesis. Very few studies have
linked miRNAs to the direct regulation of HMGCR. Both miR-27 and miR-21 may be candidate therapeutic targets for hypercholesterolemia.
We found that the LXR/RXR pathway was prominently dysregulated in all disease states. This nuclear receptor pathway has known functions in the regulation of both lipid
metabolism as well as immune and inflammatory responses. For example, recent in vivo studies have shown that LXR activation promotes cholesterol efflux and inhibits inflammation in part by
suppressing NF-kB signaling73-75. In most of the disease states we studied, well-established
LXR target genes such as CYP7A1 and ABCA1 were down-regulated, whereas genes
promoted by NF-kB signaling were up-regulated (Table 2.1A). More detailed analysis is required
CHB, CHC, and HCC have all been linked to cholesterol and lipid imbalance; however,
the mechanisms have been poorly understood. Through integrative analysis of small RNA-seq
and mRNA-seq data, and follow-up functional experiments in a cell-based system, our study
provides important clues about the candidate miRNA drivers of this phenotype. Future
investigations should focus on more detailed functional characterization of specific miRNAs of
interest and their roles in regulating cholesterol homeostasis, particularly in the background of
cirrhosis and the chronic inflammation present in viral hepatitis. As the use of locked nucleic
acid (LNA) inhibitors expand, such studies may lead to the development of novel and effective
miRNA-based therapeutic strategies.
2.5 Materials and methods
Human subjects. Written informed consent was obtained from all human subjects.
Ethics approval was obtained from the Ethics Committee for Human Genome/Gene Analysis
Research at Kanazawa University Graduate School of Medical Science.
Gene expression analysis. Gene expression microarray data16,45 for CHB, CHB-c,
CHC, and CHC-c were contrasted to the uninfected samples to determine differentially
expressed (DE) genes (p-value < 0.05 after Benjamini-Hochberg step-up multiple testing
correction and fold change > 2 compared to the uninfected samples) using Partek (Partek Inc.; St. Louis, MO). Pathway enrichment was determined with Ingenuity Pathway Analysis software
(Qiagen; Hilden, Germany).
Small RNA-sequencing. RNA was isolated as described previously16. RNA purity was
assessed with Nanodrop 2000 (Thermo Scientific; Rockford, IL) and integrity was determined
with an Agilent 2100 Bioanalyzer (Agilent; Santa Clara, CA). RNA integrity and sequencing
quality were comparable for all specimens. Small RNA libraries were generated using Illumina
TruSeq Small RNA Sample Preparation Kit (Illumina; San Diego, CA). Sequencing was
Cutadapt (parameters O -10 e 0.1). Trimmed reads were mapped to genomic regions spanning
annotated miRNAs (+/- 20 nts) using Bowtie 0.12.7 allowing for no mismatches. Next, reads that
did not map without mismatches were aligned to the same regions using SHRiMP2.2.2.
SHRiMP2.2.2 seeds were set based on the length of the read allowing 1 mismatch anywhere in
the body and up to 3 mismatches at the 3' end of the read (based on the length of the read).
Small RNA-sequencing data was deposited in GEO (GSE57381). TCGA liver cancer small
RNA-seq BAM files annotated as having a risk factor of either “hepatitis B” or “hepatitis C” and
no other annotated risk were downloaded and processed using the bioinformatics method
described above.
Automated PubMed searches. Automated search of PubMed using a Ruby program
with the HTML parser Nokogiri on December 5, 2014. Search terms for the miRNAs:
(“miRNA-X” or “miR-(“miRNA-X” or “microRNA-(“miRNA-X”) with or without the miRNA family letter (e.g., miR-148a:
(“miRNA-148a” or “miR-148a” or 148a” or “miRNA-148” or “miR-148” or
“microRNA-148”)). Other search terms (search term: “liver”), HBV (search terms: “hepatitis B” or “HBV”),
HCV (search terms: “hepatitis C” or “HCV”), or hepatocellular carcinoma (search terms: “HCC”
or “hepatocellular” or “liver cancer”).
Identification of miRNA candidate master regulators using miRHub. To identify
miRNA candidate master regulators, we used the tool miRHub as described previously53. We predicted the miRNA master regulators for 8 different gene lists (significantly DE up-regulated
genes in each disease group as well as significantly DE down-regulated genes in each), using 4 different miRNA lists (DE miRNAs in each disease category irrespective of their fold change
direction).
Measuring cholesterol synthesis. Human hepatoma cells (Huh7) were seeded into
6-well plates at a density of 1x10⁵ cells/mL. After overnight growth, cells were transfected with
miR-151 mimic or miR-21 mimic or miR-27 mimic or miR-224 mimic at 10nM each (Exiqon;
Island, NY). Forty-eight hours after transfection, media was removed and replaced with DMEM
low glucose lipoprotein deficient serum (LPDS) media. Seventeen hours later, low glucose
media was removed and replaced with fresh serum-free low glucose media (cholesterol free)
with 1uCi3H-acetic acid per well (0.5uCi/ml media) and incubated for 6 hours. Cells were
washed twice with 1X Phosphate Buffered Saline. Two mL 3:2 hexane:isopropanol were added
to each well; the cells were allowed to sit for 2 hours then placed in glass vials. Samples were
dried down under nitrogen and 30µl of cold 0.1µg cholesterol:cholesteryloleate was added.
Thirty µl of resuspended lipids were placed onto a plate and thin layer chromatography was
performed (petroleum ether:diethyl ether:acetic acid). Spots were resolved with iodine, and
cholesteryl ester, cholesterol and triglyceride spots were cut out and placed in 10mL scintillation
fluid. Total protein for each well was quantified using the BCA assay.
miRNA over-expression and reporter gene assays. HEK293T cells were maintained
in 25mM glucose DMEM (Sigma-Aldrich; St. Louis, MO) supplemented with 10% FBS and 2mM
L-glutamine (Invitrogen; Grand Island, NY), and cultured in a humidified incubator at 37oC and
5% CO2. HEK293T cells were seeded into 24 well plates and allowed to grow overnight. Once
the cells were approximately 70% confluent, they were transfected with 200ng of pEZX-MT01
empty vector, vector containing the 3’UTR of HMGCR (GeneCopoeia; Rockville, MD) and 10nM miRIDIAN microRNA hsa-miR-27b mimic (5’ UAGCACCAUCUGAAAUCGGUUA 3’,
Dharmacon; Lafayette, CO) or 10 nM miRIDIAN microRNA hsa-miR-375 mimic (5’
UUUGUUCGUUCGGCUCGCGUGA 3’). Transfection was performed using Lipofectamine 2000 (Life Technologies; Grand Island, NY). After 48 hours, the cells were lysed and luciferase
activity was measured using the Luc-Pair luciferase assay kit (Agilent; Santa Clara, CA) on a
GloMax® 96 Microplate Luminometer (Promega; Madison, WI). Site-directed mutagenesis was
performed with the QuikChange II XL Site-Directed Mutagenesis Kit (Agilent; Santa Clara, CA).
Statistics and graphics. P-values were calculated and plots were generated using R
Table 2.1. Results of pathway enrichment analysis of chronic viral hepatitis and cancer. (A & B) Top ten most significantly enriched pathways from Ingenuity Pathway Analysis using either all differentially expressed (DE) genes of a disease group (“all”), DE genes of a disease group with no overlap with any other group (“only”), or DE genes shared between two disease groups (“overlap”). (A) Pathway analysis for CHB and CHC. (B) Pathway analysis for c-CHB and c-CHC.
Table 2.1A
CHB all CHB only CHB and CHC overlap CHC all CHC only
Signaling by Rho Family GTPases
(3.55E04)
CD28 Signaling in T Helper Cells
(1.05E-04) Phosphatidylchol ine Biosynthesis (1.02E-03) Phosphatidylchol ine Biosynthesis (1.86E-06) Interferon Signaling (4.68E-07) Natural Killer Cell Signaling (3.63E-04) Tec Kinase Signaling (1.7E-04) Choline Biosynthesis (3.72E-03) Interferon Signaling (1.66E-05) Pathogenesis of Multiple Sclerosis (4.57E-05)
Role of PRRs (4.47E-04)
Signaling by Rho Family GTPases (2.00E-04) Polyamine Regulation in Colon Cell prolif/cancer (1.05E-02) Pathogenesis of Multiple Sclerosis (2.82E-04) iNOS Signaling (4.79E-04) CD28 Signaling in T Helper Cells
(7.08E-04) Natural Killer Cell Signaling (2.09E-04) Epoxysqualene Biosynthesis (1.41E-02) Choline Biosynthesis (9.2E04) Phosphatidylchol ine Biosynthesis (1.41E-03) CXCR4 Signaling (9.12E-04) CTLA4 Signaling in Cytotoxic T
Lymphocytes (5.0E-04) Toll-like Receptor Signaling (1.58E-02)
Type I Diabetes Mellitus Signaling (1.58E03)
Type I Diabetes Mellitus Signaling (2.24E-03) Integrin Signaling (1.00E-03) MSP-RON Signaling Pathway (6.04E-04) TREM1 Signaling (1.62E-02) iNOS Signaling (4.57E03) Phosphatidyleth anolamine Biosynthesis (2.34E-03) NF-κB
Signaling (1.26E-03) Renin-Angiotensin Signaling (7.41E-04) PRPP Biosynthesis (2.14E-02) Phosphatidyleth anolamine Biosynthesis (7.94E03) Prolactin Signaling (3.16E-03) Tec Kinase Signaling (1.35E-03) PRRs of Bacteria and Viruses (7.76E-04) Arsenate Detoxification (2.82E-02) LXR/RXR Activation (1.12E02)
Table 2.1B
c-CHB all c-CHB only CHB and
c-CHC overlap c-CHC all c-CHC only
FXR/RXR Activation (1.00E-23) FXR/RXR Activation (2.00 E-14) LXR/RXR Activation (1.1E-08) LXR/RXR Activation (4.27E-09) Pathogenesis of Multiple Sclerosis (7.94 E-05) LPS/IL-1 Mediated Inhibition of RXR
Function (2.51 E-18)
LPS/IL-1 Mediated Inhibition of RXR
Function (2.95 E-10) FXR/RXR Activation (2.88E-08) LPS/IL-1 Mediated Inhibition of RXR
Function (1.20E-07)
Cell Cycle: G1/S Checkpoint Regulation (3.89E-03) LXR/RXR Activation (2.51 E-16) Acute Phase Response Signaling (3.72 E-10) LPS/IL-1 Mediated Inhibition of RXR
Function (5.25E-08)
FXR/RXR Activation
(8.71E-07)
Protein Kinase A Signaling (5.50 E-03) Acute Phase Response Signaling (1.58 E-12) LXR/RXR Activation (1.02 E-07) Chemokine Signaling (1.17E-04) Complement System (7.41E-05)
Small Cell Lung Cancer Signaling (5.62 E-03) Blood flow/coagulation System (3.31E-09) Intrinsic Prothrombin Activation Pathway (6.17
E-07) Aryl Hydrocarbon Receptor Signaling (3.55E-04) Phosphatidylcholine Biosynthesis (3.31 E-04)
Cyclins and Cell Cycle Regulation (7.76 E-03) Intrinsic Prothrombin Activation Pathway (4.27E-08) Extrinsic Prothrombin Activation Pathway (6.46
E-07)
Fatty Acid α
-oxidation (6.76E-04) Hepatic Cholestasis (4.07 E-04) RAR Activation (8.71 E-03) Complement System (6.31E-08) Phenylalanine Degradation (2.34 E-06) Dopamine Degradation (7.24 E-04) Aryl Hydrocarbon Receptor Signaling (4.27 E-04) Granulocyte Adhesion and Diapedesis (8.91 E-03) Estrogen Biosynthesis (7.94E-08) Blood flow/coagulation System (6.46 E-06) Atherosclerosis Signaling (7.41E-04) Bile Acid Biosynthesis, Neutral Pathway (5.50 E-04) Glioma Signaling (1.55 E-02) Xenobiotic Metabolism Signaling (1.02E-07) Xenobiotic Metabolism Signaling (2.29 E-05) Complement System (7.76E-04) Chemokine Signaling (6.76
E-04)
Type I Diabetes Mellitus Signaling (2.45 E-02) Valine Degradation (1.2E-07) Valine Degradation (2.63 E-05) Blood flow/coagulation System (1.12E-03) Blood flow/coagulation System (6.92 E-04) IL-17A Signaling in Gastric Cells
Table S2.1 Clinical information of subjects assessed Clinical Information
Subject ID Age Sex *METAVIR Tumor
HBV 1 61 M F4A1 mHCC
HBV 2 46 M F4A2 mHCC
HBV 3 45 M F4A1 mHCC
HBV 4 60 M F2A1 pHCC
HBV 5 71 F F2A1 pHCC
HBV 6 59 M F3A1 mHCC
HBV 7 54 M F4A1 mHCC
HBV 8 42 M F4A1 mHCC
HBV 9 58 M F2A2 mHCC
HBV 10 47 M F3A2 pHCC
HCV 1 72 F F3A1 mHCC
HCV 2 78 F F4A1 mHCC
HCV 3 47 M F3A2 mHCC
HCV 5 68 M F4A2 wHCC
HCV 6 67 F F4A2 w-mHCC
HCV 7 63 M F4A1 mHCC
HCV 8 71 M F4A2 wHCC
HCV 9 64 M F4A2 mHCC
HCV 10 75 F F4A2 m-pHCC
HCV 11 59 M F4A2 mHCC
HCV 12 74 M F3A1 W-mHCC
HCV 15 71 F F4A1 mHCC
HCV 16 60 M F4A1 m-pHCC
HCV 17 74 M F2A1 mHCC
HCV 18 59 M F3A1 mHCC
HCV 20 63 M F1A1 mHCC
Uninfected 1 60 F N/A N/A
Uninfected 2 51 F N/A N/A
Uninfected 3 53 M N/A N/A
Uninfected 4 34 M N/A N/A
Uninfected 5 78 F N/A N/A
Uninfected 6 78 M N/A N/A
Uninfected 7 64 M N/A N/A
Uninfected 8 75 M N/A N/A
Figure 2.2 Expression of genes in the cholesterol synthesis pathway in chronic viral
hepatitis and cancer. Log2 of average fold change in each disease group (CHB, c-CHB, CHC,
Figure 2.3 Global miRNA expression in chronic viral hepatitis and cancer. (A & B) Pearson correlation coefficient heat maps. Each cell in the map represents the correlation in expression profiles between two samples. Cells along the diagonal represent identical samples and are colored in white. Black lines divide each disease group. Midpoint for color bar r2 = 0.5.
(A) miRNAs included are those from small RNA-sequencing with average reads per million mapped (RPMM) >100 (n=208) in uninfected controls (n=4), CHB (n=4), matched c-CHB (n=4), CHC (n=4), and matched c-CHC (n=4) samples. (B) miRNAs from The Cancer Genome Atlas small RNA-seq with an overall average RPMM > 100 (n=180) in each disease category: CHB (n=6), c-CHB (n=12), CHC (n=5), and c-CHC (n=15). (C & D) Analysis of differentially
expressed (DE) miRNAs in each disease category compared to the uninfected controls
Figure 2.4 Published literature on miRNAs that are differentially expressed in chronic viral hepatitis and liver cancer. (Left of each panel shown) Heat map of significantly differentially expressed miRNAs in each disease group (CHB, c-CHB, CHC, and c-CHC) compared to the uninfected controls that have: (i) an average fold change > 1.5 in one disease state, (ii) a change in the same direction in at least 3 out of 4 samples within each disease group, and (iii) reads per million mapped reads (RPMM) > 50 in at least one disease group. Color represents log2 (average fold change) compared to the uninfected controls. Black boxes
Figure 2.5 Candidate miRNA master regulators of gene expression profiles in chronic
viral hepatitis and associated liver cancer. (A & B) Heat map of the –log10(p-value) of the
Figure 2.6 Candidate miRNA master regulators miR-27 and miR-21 control cholesterol
synthesis in vitro. (A) Human hepatoma (Huh7) cells transfected with either 10 nM of miRNA
Figure 2.8 Model of miRNA regulation of cholesterol transport and efflux in chronic viral hepatitis and associated cancer. Significantly altered cholesterol transport and efflux genes in at least one disease state are shown. Pie shading to the right of each gene indicates the
CHAPTER 3
Small tRNA-derived RNAs are increased and more abundant than microRNAs in chronic
hepatitis B and C1
3.1 Overview
Persistent infections with HBV or HCV account for the majority of cases of hepatic
cirrhosis and HCC worldwide. Small, non-coding RNAs play important roles in virus-host
interactions. We used high throughput sequencing to conduct an unbiased profiling of small
(14-40 nts) RNAs in liver from Japanese subjects with advanced hepatitis B or C and HCC. Small
RNAs derived from tRNAs, specifically 30-35 nucleotide-long 5’ tRNA-halves (5’ tRHs), were
abundant in non-malignant liver and significantly increased in humans and chimpanzees with chronic viral hepatitis. 5’ tRH abundance exceeded microRNA abundance in most infected
non-cancerous tissues. In contrast, in matched cancer tissue, 5’ tRH abundance was reduced, and relative abundance of individual 5’ tRHs was altered. In hepatitis B-associated HCC, 5’ tRH
abundance correlated with expression of the tRNA-cleaving ribonuclease, angiogenin. These results demonstrate that tRHs are the most abundant small RNAs in chronically infected liver
and that their abundance is altered in liver cancer.
3.2 Introduction
HBV and HCV are phylogenetically unrelated non-cytopathic viruses that infect the liver1.
While HBV is a DNA virus, and HCV is a positive-strand RNA virus, both have the capacity to
persist for years in some infected individuals. Hundreds of millions of people worldwide are
chronic carriers of HBV or HCV, 30-50% of whom have chronic liver disease2. Together, these
viral infections are responsible for ~60% of liver cirrhosis and ~80% of HCC, a leading cause of
cancer-related deaths worldwide. Numerous studies suggest that miRNAs, small 21-23 nt
non-coding RNAs are important in the pathogenesis of these infections, modulating viral replication
as well as host responses and possibly influencing the risk of carcinogenesis3. For example the
HBV X protein represses expression of miR-148a, potentially enhancing tumorigenesis4. In
contrast, HCV infection is associated with higher expression of miR-21, which targets key
components of Toll-like receptor signaling pathways, possibly facilitating viral evasion of innate
immune responses5. miR-122 stabilizes HCV RNA and promotes its replication6,7, and the
importance of this interaction is reflected in the clinical development of an anti-miR-122
antagomir (miravirsen) as an antiviral therapeutic8.
Somewhat larger, 30-35 nt RNAs derived from the 5’ half of tRNA (5’ tRHs) represent a
second major class of small noncoding RNA9. Increased expression of 5’ tRHs has been
associated with viral and rickettsial infections in animals10,11, and may serve to prevent
apoptosis and promote cell survival12. However, they have not been studied previously in the
context of viral hepatitis. To our knowledge, only one study has described unbiased profiling of
small RNAs in the liver during chronic viral hepatitis13, but the analysis was restricted to miRNAs. We sequenced small (14-40 nts) RNAs in liver biopsies from subjects with chronic
hepatitis and HCC, examining both non-tumor and matched cancer tissue, and found a
surprisingly high proportion of reads representing 5’ tRHs9. Our results document their presence
in human tissue, demonstrate that they are the most highly abundant small RNAs in
virus-infected liver, and show that their abundance is altered in various disease states including
3.3 Results
3.3a tRNA-half abundance is significantly increased in chronic viral hepatitis
We employed high-throughput sequencing to characterize the small RNA transcriptome
in liver tissue from Japanese adults with advanced hepatitis B or hepatitis C and concomitant
HCC (Table S2.1). Initial studies focused on non-malignant tissue from 4 subjects with hepatitis
B (mean age 53 ± 4 yrs s.e.m.), 4 with hepatitis C (63 ± 2 yrs), and 4 uninfected individuals
undergoing resection of metastatic tumors (60 ± 10 yrs)14. A large proportion of the sequencing reads were 19-25 nts in length (median 38%, range 10-73%), as expected for miRNAs15 (Figure
3.1A, left). However, we detected an equal or greater abundance of 30-35 nt reads in HBV- and HCV-infected liver (median 54%, range 14-80%). These larger RNAs were less abundant in
uninfected tissue (median 21%, range 14-84%) and in human hepatoma (FT3-7) cells (median
9%, range 8.7-9.3%).
Most (~65%) of the 30-35 nt reads in infected samples aligned perfectly to the region 5’
of the anticodon triplet in annotated tRNA genes16 (Figure 3.1B, Supplemental Figure 3.1). We
refer to these as “5’ tRNA-halves” (5’ tRHs)9. Many of the remaining 30-35 nt reads also aligned
to the 5’ end of tRNAs, particularly tRNAGly, but with one or more nucleotide deletions. Also
present were 3’ tRHs (~36-39 nts) mapping to the region 3’ of the anticodon, including the 3’
terminal CCA (Figure 3.1B, Supplemental Figure 3.1). Additionally, we identified shorter reads
derived from 3’ or 5’ tRNA termini, referred to previously as “tRNA fragments”9 (tRFs), or the
region immediately 5’ or 3’ of the anticodon loop, but these were much less frequent. In 6 of 8
infected livers, more reads mapped to tRNA loci16 than to known miRNAs17 (see Methods),
while the opposite was true in 3 of 4 uninfected tissues as well as FT3-7 cells (Figure 3.1A,
right).
There are 625 annotated tRNA genes in the human genome (hg19) encoding 458 unique tRNA sequences. We identified reads mapping to 348 of these 458 sequences. Notably,
(Supplemental Figure 3.2A). The two most abundant 5’ tRHs were Gly[C/G]CC (“5’ tRHGly”),
which could be derived from any of 10 tRNAGly genes with identical 5’ sequence, and
Val[A/C]AC (“5’ tRHVal”), which could originate from any of 15 tRNAVal genes (Figure 3.1B and C,
Supplemental Figure 3.1 and 3.3)16. 5’ tRHGly accounted for 54 ± 9% (s.d.) and 5’ tRHVal 17 ± 9%
of all tRNA-derived RNA reads (Supplemental Figure 3.2A). Remarkably, 5’ tRHGly abundance
exceeded that of miR-122, one of the most abundant liver miRNAs13, in 7 of 8 virus-infected
tissues.
We used real-time reverse transcription quantitative PCR (RT-qPCR) to validate these
results and compare 5’ tRHGly, 5’ tRHVal and miR-122 abundance in liver tissue from 22
additional subjects14. These analyses confirmed that 5’ tRHGly abundance was increased in
HBV- and HCV-infected liver compared with uninfected tissues (P<0.01 and P<0.05,
respectively) (Figure 3.1D, left). A similar trend was observed for 5’ tRHVal (HBV P=0.07; HCV
P=0.7). 5’ tRHGly and 5’ tRHVal were more abundant than miR-122 in HBV- and HCV-infected
liver (5’ tRHGly, P<0.005 for both HBV and HCV; 5’ tRHVal, P<0.005 for HBV and P<0.01 for
HCV) (Figure 3.1D left). Notably, 5’ tRHVal abundance was higher in HBV- than in HCV-infected
tissues (P<0.005).
Chimpanzees (Pan troglodytes) recapitulate many aspects of HBV and HCV infections in humans18,19, and are free of potential confounding variables (e.g., alcohol intake, smoking) that are difficult to control in human cohorts. Similar to humans, we found that intrahepatic 5’ tRHGly
and 5’ tRHVal abundance was increased in archived liver tissue from chimpanzees chronically infected with HBV compared to uninfected animals (P<0.005 and P<0.05, respectively) (Figure
3.1D, right). However, 5’ tRH abundance was not increased in chronically HCV-infected
chimpanzee liver.
In human tissues, the relative abundance of specific tRNA-derived RNAs correlated with
codon usage (codon frequency in DNA sequence) (Spearman’s rho=0.32, P=0.01) and the
(Supplemental Figure 3.2B). However, tRNAs representing potential sources of the five most
abundant tRHs were not the most highly ranked by gene number or codon usage, suggesting
that additional factors likely determine tRH biogenesis (Supplemental Figure 3.4). Interestingly,
those tRNAs from which 5’ tRHGly and 5’ tRHVal are potentially derived share a unique sequence
motif in the stem-loop region (Figure 3.1E) not present in other tRNAs (Supplemental Figure
3.3).
3.3b tRNA-half abundance is altered in viral hepatitis associated cancer
In HCC tissue from HBV-infected subjects, RT-qPCR analysis showed that 5’ tRHGly and
5’ tRHVal abundance was significantly reduced (P<0.005 for both) (Figure 3.2A). Similar
reductions were evident in HCV-associated cancer tissue, but significant only for 5’ tRHVal (P<0.05). We then sequenced small RNAs in cancer tissue from 4 HBV- and 4 HCV-infected
subjects. The proportion of reads mapping to tRNA genes was reduced in 4 of 7 samples for which a paired analysis with non-malignant liver was possible, and relatively unchanged in the
other 3 (Figure 3.2B). Although tRNA-derived RNA expression profiles were similar across
non-malignant tissues from different subjects, there was substantial variation when compared to
cancer tissues (Figure 3.2C). This suggests that the relative abundance of specific
tRNA-derived RNAs is altered in HCC. Notably, the relative abundance of 5’ tRHGly was reduced by
~50-60% in both HBV- and HCV-associated cancer (Figure 3.2D).
3.3c tRNA-half abundance correlates with angiogenin levels in HBV-associated cancer
Angiogenin (encoded by the gene ANG) is best known for its role in angiogenesis, but several studies suggest its RNase activity contributes to tRH biogenesis20,21. Consistent with
tissue (P<0.01 and P<0.005, respectively) or uninfected liver (P<0.005 and P=0.01) (Figure
3.3A). Analysis of data from The Cancer Genome Atlas (https://tcga-data.nci.nih.gov/tcga/) also
indicates that ANG expression is reduced in HCC compared to non-malignant tissue, although the difference is significant only for HBV-associated cancer (HBV P<0.005, HCV P=0.12)
(Supplemental Figure 3.5). ANG mRNA abundance correlated strongly with 5’ tRH expression in the HBV-infected subjects we studied (5’ tRHGly: Spearman’s rho=0.67, P<0.01; 5’ tRHVal:
rho=0.74, P<0.005) (Figure 3.3B). Quantitative immunoblot analyses (Supplemental Figure 3.6)
confirmed a correlation between ANG protein abundance and 5’ tRH expression in
HBV-associated cancer (5’ tRHGly: rho=0.83, P<0.005; 5’ tRHVal: rho=0.87, P<0.005) (Figure 3.3C).
ANG was expressed within the cytoplasm of hepatocytes (Figure 3.3D), and although its
expression varied substantially in different tumors (Figure 3.3E), reductions in ANG expression
likely explain the reduced tRH abundance we observed in most HBV-associated cancers.
Unfortunately, however, the available tissue sections from these subjects were insufficient to
power a formal analysis of the correlation between cytoplasmic versus nuclear expression of
ANG and tRH abundance. ANG expression correlated poorly with tRH abundance in
HCV-infected livers, suggesting that other factors determine tRH biogenesis.
3.4 Discussion
Recent advances in high-throughput sequencing technology have unveiled the
complexity and diversity of functional small RNAs. We found that small RNAs derived from
tRNAs, specifically 5’ tRNA-halves9 (5’ tRHs, ~30-35 nts), are abundant in liver, significantly
increased during chronic viral infection, and altered in abundance in liver cancer associated with
these infections. We do not believe that these tRNA-halves are products of stochastic
endonuclease cleavage of tRNAs for several reasons. First, the same tRNA-halves were found
to be increased in chronic viral hepatitis across all individuals. Second, each tRNA-half family