Article
Imaging Extracellular Matrix Remodeling In Vitro by
Diffusion-Sensitive Optical Coherence Tomography
Richard L. Blackmon,1Rupninder Sandhu,2Brian S. Chapman,3Patricia Casbas-Hernandez,4Joseph B. Tracy,3 Melissa A. Troester,5and Amy L. Oldenburg1,5,6,*
1
Physics and Astronomy and2Lineberger Comprehensive Cancer Center, University of North Carolina at Chapel Hill, Chapel Hill, North Carolina;3Materials Science and Engineering, North Carolina State University, Raleigh, North Carolina;4Epidemiology and Biochemistry, Ponce Health Sciences University, Ponce, Puerto Rico; and5Department of Epidemiology and6Biomedical Research Imaging Center, University of North Carolina at Chapel Hill, Chapel Hill, North Carolina
ABSTRACT The mammary gland extracellular matrix (ECM) is comprised of biopolymers, primarily collagen I, that are created and maintained by stromal fibroblasts. ECM remodeling by fibroblasts results in changes in ECM fiber spacing (pores) that have been shown to play a critical role in the aggressiveness of breast cancer. However, minimally invasive methods to measure the spatial distribution of ECM pore areas within tissues and in vitro 3D culture models are currently lacking. We introduce diffusion-sensitive optical coherence tomography (DS-OCT) to image the nanoscale porosity of ECM by sensing weakly constrained diffu-sion of gold nanorods (GNRs). DS-OCT combines the principles of low-coherence interferometry and heterodyne dynamic light scattering. By collecting co- and cross-polarized light backscattered from GNRs within tissue culture, the ensemble-averaged translational self-diffusion rate,DT, of GNRs is resolved within ~3 coherence volumes (105mm,xz). As GNRs are slowed by intermittent collisions with ECM fibers,DTis sensitive to ECM porosity on the size scale of their hydrodynamic diameter (~46 nm). Here, we validate the utility of DS-OCT using pure collagen I gels and 3D mammary fibroblast cultures seeded in collagen/Matrigel, and associate differences in artificial ECM pore areas with gel concentration and cell seed density. Across all samples,DTwas highly correlated with pore area obtained by scanning electron microscopy (R2¼0.968). We also demon-strate that DS-OCT can accurately map the spatial heterogeneity of layered samples. Importantly, DS-OCT of 3D mammary fibroblast cultures revealed the impact of fibroblast remodeling, where the spatial heterogeneity of matrix porosity was found to increase with cell density. This provides an unprecedented view into nanoscale changes in artificial ECM porosity over effec-tive pore diameters ranging from ~43 to 360 nm using a micron-scale optical imaging technique. In combination with the topical deposition of GNRs, the minimally invasive nature of DS-OCT makes this a promising technology for studying tissue remodeling processes.
INTRODUCTION
The extracellular matrix (ECM) is made up of a connective fibrous network of macromolecules, including collagen, secreted primarily by fibroblasts. It is a porous mesh that provides structural support for cells while allowing for the diffusion of nutrients from blood to cells within the tis-sue (1). The architecture of the ECM can be described by its fibers (diameter, composition, tortuosity, cross-linking, and density) and by its pores (size, anisotropy, and perme-ability), properties that are interrelated and ultimately dictate its micromechanical properties. Importantly, the ECM interacts dynamically with the growth and prolifera-tion of cells, where homeostasis is vital for maintaining
healthy cellular behavior, with implications ranging from wound healing to organ function (2). This homeostasis breaks down during tumorigenesis, where ECM remodeling within the microenvironment results in mechanical sig-naling to cells that further drives cancer progression (2,3). At the same time, changes in ECM architecture are strongly associated with breast carcinoma (4,5). Thus, methods are critically needed for rapid and minimally invasive assess-ment of ECM remodeling processes, both for fundaassess-mental studies and for translational technologies to improve cancer diagnosis and therapy.
Here, we report a minimally invasive imaging method, which we apply to study artificial ECM remodeling in 3D tissue cultures based on an optical coherence tomogra-phy (OCT) platform. We demonstrate the technique in a model of mammary fibroblast remodeling, a mechanism that is known to play a critical role in breast cancer Submitted November 10, 2015, and accepted for publication March 7, 2016.
*Correspondence:[email protected]
Editor: David Piston.
http://dx.doi.org/10.1016/j.bpj.2016.03.014
progression (4). Fibroblasts create the structural collagen comprising the ECM, are a source of proteases necessary to break down the ECM, promote ECM remodeling in wound healing (4,6), and play a critical role in maintaining ECM homeostasis. In malignant breast tissue, fibroblasts display an altered phenotype, characterized by secretory profiles (7) that promote cancer aggressiveness (8). The phenotype of mammary fibroblasts is well preserved in arti-ficial tissue, making mammary fibroblasts ideal for studying ECM remodeling as it relates to tumorigenesis in breast can-cer (9). Furthermore, mammary fibroblasts grown in 3D matrices, compared to 2D cultures, better recapitulate many features of the in vivo microenvironment (10). How-ever, it is important to note that artificial ECM lacks the necessary components and structure to fully emulate in vivo tissue, and that the work presented here provides an initial validation of this new imaging technique in models that may be relevant to studying breast cancer.
There are several currently available methods for study-ing the micromechanical properties and architecture of the ECM. Immunofluorescence techniques are available to im-age ECM fibers of specific composition (11), whereas multiphoton microscopy is invaluable for imaging fibrillar collagen (11–13). Nanoindentation via an atomic force mi-croscope has been used to measure micromechanical
prop-erties of tissue with high spatial resolution (~15mm) (14).
Particle-tracking microrheology has been used to measure ECM rigidity (15). Although the above techniques have greatly advanced our knowledge of tissue micromechanical properties, they either cannot assess live samples or are limited in imaging speed and penetration depth. Here, we propose a method that uses gold nanorods (GNRs) conju-gated with polyethylene glycol (PEG) as diffusion probes (16) to sense the nanoporosity of the ECM combined with
depth-resolved imaging via OCT to ~600 mm in depth in
3D cultures. OCT uses the principle of coherence gating to reject multiply scattered light (17), offering greater imag-ing depth in optically turbid samples compared to scannimag-ing confocal microscopy.
Our proposed method incorporates the principles of het-erodyne dynamic light scattering (DLS) with OCT. Previ-ously, coherence-gated DLS has been used to spatially resolve the Brownian diffusion coefficient of particle en-sembles (18). Spectral-domain OCT, which offers an imag-ing-speed advantage over the traditional time-domain OCT method, has been shown to rapidly measure Brownian mo-tion to provide 2D imaging of particle diffusion (19). More recently, we showed that GNRs are particularly favorable as diffusion probes in OCT based on their longitudinal plas-mon resonance mode tuned to the central wavelength of the OCT system (20); the combination of their small size and large optical cross section results in more rapid and intense speckle fluctuations in OCT. We have also
demon-strated that the translational diffusion rate (DT) of GNRs
of the dimensions used here (~8424 nm) is sensitive to
the effective pore size of semidilute polymer solutions (16). When GNRs are put into solution with polymers that have an entanglement length approximately equal to the hy-drodynamic diameter of the GNRs, the GNR self-diffusion
is weakly constrained (0.1 DT,solvent <DT<DT,solvent)
via intermittent collisions with macromolecules. For the first time, to our knowledge, we employ here the principle of weakly constrained diffusion to reveal the heterogeneity in artificial ECM in 3D cultures by resolving the particle-aver-aged GNR diffusion in two dimensions. We developed an ensemble imaging mode with OCT, dubbed
diffusion-sensi-tive OCT (DS-OCT), to collect M-mode (depth,z, versus
time) scans in a sequence of transverse steps (inx) to
recon-struct a cross-sectional image (x-z) ofDT. Furthermore, we
use polarization-sensitive OCT measurements to distinguish between speckle fluctuations from optically anisotropic scatterers (GNRs) and isotropic scatterers (cells). In this way, freely diffusing GNRs, weakly constrained by the matrix pore size, are detected via the unique polarization-dependent scattering signal that is recognizable against light scattered from tissue.
We hypothesized that DS-OCT can quantify artificial ECM nanoporosity in 3D tissue culture by restricting GNR Brownian motion; this has a basis in previous observa-tions of restricted diffusion of macromolecules in collagen gels (21). In our previous work, we showed a negative
cor-relation between GNRDTand collagen concentration (16).
Here, we validate the dependence ofDTon collagen pore
area using scanning electron microscopy (SEM). We then demonstrate the ability of our proposed method to spatially resolve nanopore heterogeneity in layered collagen samples and artificial ECM subjected to fibroblast cell remodeling. Importantly, GNRs are topically applied to 3D cultures, al-lowing for cells to continue to grow and interact with their mechanical environment with no evidence of disturbance by the nanoprobes; PEGylated GNRs have been shown to lack cellular uptake (22). Furthermore, DS-OCT employs low-power, near-infrared light to monitor GNRs, mini-mizing effects such as localized heating or photobleaching that could impact measurements. By eliminating the need to alter or deform the gel, we avoid potential external me-chanical stimuli to cells. Thus, DS-OCT represents a way to measure matrix porosity, independent of cellular compliance.
Other studies have shown porosity to be an indirect measure of matrix elasticity (which is known to influence migration) (26), whereas still others have shown little correlation be-tween porosity and migration (27). By elucidating the het-erogeneity of porosity during artificial ECM remodeling, DS-OCT may complement current methods of mechanical measurement and provide a future tool for addressing dis-parities in recent reports on the role of porosity in tumor in-vasion. By first validating measurements in controllable collagen matrices and then demonstrating the ability of DS-OCT to sense artificial matrix remodeling by mammary fibroblasts, this work takes the first steps toward establishing DS-OCT as a tool for studying porosity.
MATERIALS AND METHODS
Preparation of GNRs
GNRs were prepared using previously published methods for large-scale synthesis (28). Conjugation with PEG (0.8–1 kDa molecular weight; Sigma Aldrich, St. Louis, MO) is known to improve the biocompatibility of GNRs (29). GNR size distributions, found using transmission electron mi-croscopy, measured 84.359.5 nm23.954.8 nm, with estimated PEG thickness of ~0.48 nm (16) and a hydrodynamic diameter of 48.857.6 nm. To minimize the incidence of GNR-GNR collisions during measurements, GNR concentrations in all studies were 6.8–11107GNRs/mL, corre-sponding to ~15–24 GNRs per coherence volume.
Preparation of collagen samples
Collagen samples were prepared using high-concentration rat tail collagen I (BD Biosciences, Bedford, MA). Samples were diluted to final concentra-tions of 2, 5, and 8 mg/mL by mixing with a neutralizing alkaline saline so-lution at different ratios, according to the protocol provided by the manufacturer. GNRs were premixed into this solution before the final addi-tion of liquid-phase collagen, resulting in a final number density of 6.8 107 GNRs/mL. A volume of 300mL of each sample was then pipetted into 1-cm-diameter 48-well plates and incubated at 37C in a high-humidity atmosphere containing 5% CO2for 30 min. Samples were maintained at 40C in normal atmosphere for an additional 2 h before imaging to ensure complete gelation. Layered samples were prepared by pipetting a small vol-ume (<100mL) of either 2 or 8 mg/mL liquid-phase collagen with pre-mixed GNRs into a tilted well plate. After gelation, the second layer of collagen, at either 8 or 2 mg/mL concentration, respectively, was deposited such that the top layer was level with (or slightly below) the tallest point on the rising edge of the bottom layer. This was allowed to incubate for an additional 30 min and then was maintained at 40C in normal atmosphere for an additional 2 h.
Preparation of reduction mammoplasty fibroblast 3D cultures
First, hTERT-immortalized reduction mammoplasty fibroblast (RMF) three-dimensional (3D) cell cultures were prepared in artificial ECM with varying seed densities to quantify fibroblast-induced matrix remodeling and the corresponding changes in GNR diffusion. Before seeding into a 3D matrix, RMF cells were grown to confluence on a 2D culture that was incubated as described above. RMFs were seeded into artificial ECM comprised of a 1:1 ratio of collagen (1.0 mg/mL final concentration; Corn-ing, CornCorn-ing, NY) and Matrigel (Fisher Scientific, Pittsburg, PA), with seed densities of 0, 100, 300, and 500 cells/mL, to a total volume of 360mL using
a protocol described previously (16). The cultures were incubated for 48 h. Then, GNRs were suspended in 180mL RPMI culture media to a concen-tration of 3.4108GNRs/mL before being topically applied to each culture (replacing the existing media). Cultures were incubated overnight to allow for GNRs to evenly distribute throughout each culture, reaching an average target concentration of 1.1108GNRs/mL (~24 GNRs per coherence vol-ume) before imaging.
A second set of RMF 3D cultures was prepared to study spatial hetero-geneity in artificial ECM remodeling using DS-OCT. In comparison to the method above, lower seed densities (0, 50, and 100 cells/mL) with a longer culture time (11 days) were used in an effort to enhance artificial ECM heterogeneity while avoiding overpopulation. Otherwise, samples were prepared for DS-OCT imaging as described above. It is important to note that the total volume of gel in culture was observed to remain constant for all RMF conditions; this was ensured by gentle handling to prevent gels from separating from culture-well walls under internal tensional forces applied by RMFs. This ensures that pore area measurements offer a direct comparison of changes due to ECM remodeling rather than contraction of the gel.
DS-OCT imaging
A custom polarization-sensitive, spectral-domain OCT system was used to provide DS imaging. The system consists of an 800 nm Ti:Sapphire laser source with a bandwidth of 120 nm, and details of the system are described in (20). Briefly, linearly polarized light (H) was directed into a free-space Michelson interferometer, and the co- and cross-polarized output light was directed into a custom spectrometer, where it was imaged onto the first and second halves of a 4096 pixel line-scan camera sampled at an A-line rate of 25 kHz. Co- and cross-polarized signals are defined as light scat-tered from the sample with either the same (HH) or orthogonal (HV) po-larization states, respectively, as that of the input signal. The spectral interferograms were converted into depth-dependent complex analytic sig-nals,~SHHðzÞand~SHVðzÞ, using a previously described dispersion
compen-sation method (30). The imaging depth of the OCT system was 2.08 mm in air, resulting in a maximum physical imaging depth of 1.55 mm in the water-based cultures used in this study. The axial and lateral in-water res-olutions of the system were measured to be 3.0 and 10mm, respectively. B-mode (i.e., cross-sectional,xversus z) HV-OCT images were created from the magnitude of~SHVðzÞand collected into 1000 1024 pixels
(21.55 mm inx andz) by scanning the beam laterally. Since GNRs were the only optically anisotropic scatterers in the examined samples, HV-OCT images predominantly contrast GNRs, providing context for the relative GNR distribution, in comparison to DS-OCT images collected in the same sample.
We introduce DS-OCT, a new method of ensemble (MþB modes) im-aging to spatially resolve the GNR diffusion rate in 2D,DT(x,z). DS-OCT employs a previously established technique for depth-resolving DT(z) from a single M-scan (zversust) (16), and implements successive lateral stepping (inx) to construct a cross-sectional view ofDT. Each DS-OCT im-age was constructed from an ensemble of 100 M-scans collected at incre-ments of 20mm inx, where each M-scan was comprised of 4000 A-lines collected at 25 kHz and 38ms exposure time. The total DS-OCT imaging time was as little as 28 s.DTwas subsequently calculated from rows (inten-sity fluctuations int) of each M-scan, as described previously (16). Briefly, the complex analytic signals,~SHHðzÞand~SHVðzÞ, were obtained from each
A-line as above, and the normalized, temporal autocorrelation within each M-scan (gHHðt;zÞandgHVðt;zÞ) was computed. The isotropic
autocorrela-tion,gISOðt;x;zÞ;was calculated from a linear combination ofgHHðt;zÞand
gHVðt;zÞ; according to standard DLS methods (31), for each M-scan
collected at each positionx. An average ofgISO over 3 pixel depths (z)
was computed to suppress noise. Finally, each DS-OCT image pixel was represented byDTcomputed fromgISOaccording to
whereq¼4pn/l0(withnbeing the refractive index of the medium andl0 the central wavelength of the system). The model of Eq. 1 was fitted togISO
fort%t1=e;which was then used to computeDT(x,z).
We devised two tests to ensure that diffusion measurements represented diffusion of GNR ensembles, and to avoid potential image artifacts (i.e., motions from cells).DT(x,z) values were rejected if the signal failed either of the following conditions:
3:25
f <tISO< nA
10:75f (2)
and
tISO
tHV
>5; (3)
wherefis the A-line sampling rate,nA is the number of A-lines in the M-mode image, andtISO andtHV are the isotropic and cross-polarized
normalized autocorrelation 1/edecay constants, respectively. Equation 2 ensures that the fitted decay time,tISO, is within the dynamic range of
the OCT system by ensuring that tISO is sufficiently long compared to
the sampling rate but short compared to the total image acquisition time. The multipliers of 3.25 and 10.75 were estimated from Monte Carlo simulations of the OCT measurements to ensure <5% error in the resultantDTvalue. This corresponds to an effectiveDTdynamic range of
0.1314.88mm2/s, which we find is sufficient to describe the pore areas used in this study. The second test, represented by Eq. 3, ensures sufficient difference in the isotropic and cross-polarized decay constants to indicate that the signal arises from the GNRs. This can be understood by the fact that the wavelengths used in our study are at the longitudinal plasmon reso-nance of the GNRs, such that the polarizability components areajj>>at.
In this approximation,tISO=tHV¼6DR=q2DT;whereDRis the rotational diffusion rate. According to Stokes-Einstein models of diffusion, this term scales asðl=LÞ2;whereLis the length of the GNR. Given the small size of GNRs compared to the wavelengthðL < <lÞ;we find that theDR term is dominant and thattISO=tHVz9(16). In comparison, more isotropic
scatterers, like cells and collagen (ajjzat), will tend to be weighted
by their larger light-scattering componentsðLzlÞ. This causes the DT decay mode to be more dominant; in the limit whereq2DT> >6DRand
ajj¼at,tISO=tHV¼1:Thus, anisotropic optical scatterers (GNRs) give
rise to large decay-constant anisotropy, whereas isotropic scatterers exhibit similar values oftISOandtHV:These predictions are consistent with our
experimental observations that samples without GNRs exhibittISO=tHV
values of ~1, in comparison to>5 for samples with GNRs, as shown in
Fig. S1in theSupporting Material. It is also important to recognize that as GNRs become constrained by the polymer mesh, their diffusion may become nonhydrodynamic, and thetISO=tHVratio may change (32); thus,
we chose our cutoff value of 5 primarily to exclude the background medium of cells and collagen without placing specific constraints on the value from GNRs.
For comparison across different experimental conditions and sample types (collagen versus ECM), spatially averaged GNR diffusion values, DT,avg, were found. For these measurements, M-scans comprising 12,000 A-lines were collected at 25 kHz (38ms exposure time) at random locations across each sample. The larger number of A-lines allowed for a longer mea-surement time to determine the experimental range oftISOfor these
sam-ples, which allowed us to minimize the number of A-lines (nAin Eq. 1) without data loss for the subsequent DS-OCT measurements.
SEM
Field emission SEM was performed to study matrix porosity on the artificial ECM and collagen samples after GNR diffusion measurements. Gels were briefly washed in phosphate-buffered saline, followed by in a solution of 2% paraformaldehyde, 2.5% glutaraldehyde, and 0.15 M sodium phosphate
buffer with a pH of 7.4. The samples were stored in the fixative for several days at 4C before processing for SEM. The gels were sliced vertically and washed gently three times with 0.15 M sodium phosphate buffer, pH 7.4, to remove surface debris. To stabilize the collagen fibrils and decrease shrinkage, the gel slices were postfixed in 1% osmium tetroxide in phos-phate buffer for 30 min, followed by subsequent treatment with 1% tannic acid for 20 min and 1% osmium tetroxide in water for 10 min (33). The samples were then dehydrated in ethanol (30%, 50%, 75%, 90%, 100%, and 100%), transferred to a Samdri-795 critical point dryer, and dried using carbon dioxide as the transitional solvent (Tousimis Research Corporation, Rockville, MD). Slices were mounted on aluminum planchets with double-sided carbon adhesive and coated with 10 nm of gold-palladium alloy (60 Au:40 Pd, Hummer X Sputter Coater, Anatech USA, Union City, CA). Im-ages (nR2 for each condition) were acquired using a Zeiss Supra 25 FESEM operating at 5 kV, with working distance of ~5 mm, a 20mm aper-ture (Carl Zeiss Microscopy, Peabody, MA) at 10K magnification. Each im-age used for analysis is an en face 2D view of the matrix cross section.
SEM image processing
A custom Matlab (version R2015a) script was used to autosegment nano-pores from SEM images and to quantify the distribution of pore areas. Because SEM images captured fibers at multiple planes, in and out of focus, the pixel intensity histograms varied across samples. We noted that there was a consistent high-pixel-intensity mode representing pixels comprising the in-focus fibers, with the high-intensity edge of this mode following a normal distribution (see Fig. S2). The half-width of this distribution was defined as the pixel intensity for which the mode decayed to peak counts/e2on the high-intensity edge. This was then used to extrapolate the location of the low-intensity edge, defining the pixel intensity threshold used to separate the in-focus fibers from the pores. Although each SEM im-age captured fibers at multiple depths, this allowed us to consistently define the 2D plane of interest at the depth of focus. Connected pore regions within each image were found and pore areas were tabulated from the number of pixels in each region, with each pixel size corresponding to 31.25 nm. His-tograms of the resulting pore-area distributions were constructed with 50 bins, equally spaced, for pore areas within the range 978362,500 nm2. Pore areas>362,500 nm2were rejected from analysis due to a population size at these areas that was inadequate for rigorous statistical analysis. Normalized pore-area probability distributions were calculated using the equation
Pi ¼ niAi P50
i¼1ni; (4)
whereiis the bin index,Pis the normalized probability,niis the number of pores within the bin, andAis the central pore area of the bin. For the collagen data, histogram scatter plots were plotted against smoothed curves generated using a locally weighted second-order polynomial regression model via the ‘‘loess’’ Matlab function. Because GNRs move via a random diffusion process, on average, the amount of time spent within each pore is expected to be proportional to the pore area. Thus, the pore-area centroid, C, represents the time-averaged pore area encountered by diffusing GNRs, which was calculated according toC¼P50i¼1PiAi:The standard deviation
(SD) was calculated using SD¼
ffiffiffiffiffiffiffiffiffiffiffiffiffiffiffiffiffiffiffiffiffiffiffiffiffiffiffiffiffiffiffiffiffiffiffiffiffiffiffiffiffiffiffiffiffiffiffiffiffiffiffiffiffi
ðn=n1ÞP50
i¼1PiðAiCÞ2 q
;wheren is the number of bins used in constructing the histogram distributions. A Welch’st-test usingCand SD was used to determine the statistical signif-icance between the pore areas measured for each condition.
swept across 360 in 1 increments. The resulting histogram reports the number of linearly connected pixels at all angles. The angular histograms shown (seeFig. 3) have been smoothed for visualization.
RESULTS AND DISCUSSION
The GNR diffusion rate in collagen decreases as collagen pore area decreases
Although we previously reported the decrease of the GNR
translational diffusion rate,DT, with collagen concentration
(16), in this article, we quantify, for the first time (to our
knowledge), the relationship betweenDTand the
nanoporos-ity of the medium. Homogenous collagen gels of varying density were imaged with HV-OCT, DS-OCT, and SEM.
First, HV-OCT images in Fig. 1 A indicate that there are
no discernible differences in the intensity of cross-polarized, backscattered light across the three densities of collagen, confirming that the GNR density is the same within each sample. The HV-OCT signal declines with depth due to the attenuation of incident light by the GNRs. The corre-sponding DS-OCT images in the same cross section show
spatially resolved DTmeasurements represented by a heat
map, with regions lacking a GNR signature (i.e., pixels failing the tests of Eqs. 2 and 3, as described in Materials and Methods) represented by blue. These images
demon-strate the relative homogeneity inDTthroughout each
sam-ple and exhibit an overall decrease in DT across each
condition with increasing collagen density. Interestingly,
theDTvalues are more stable in depth than the
cross-polar-ized signal in the HV-OCT images, as shown in Fig. S3,
demonstrating that the diffusion measurements are robust against changes in the signal intensity. The images did,
how-ever, exhibit a slight layer (1455mm in thickness) of lower
DTnear the top of each of the samples, which we attribute to
evaporation of interstitial fluid at the air-gel interface. The corresponding SEM images qualitatively show the decrease in collagen pore size with concentration in these samples.
To quantify the SEM data,Fig. 1Bshows the probability
distribution of pore areas for each collagen concentration. The trend lines show that the percentage of smaller pores is greater at the highest collagen density (8 mg/mL) compared to the lower-density gels, and the highest-density gel shows a more rapidly declining trend, indicating fewer, compara-tively larger pores. The pore-area distribution measured for the 5 mg/mL collagen predictably fell between those for the higher and lower concentrations. From these probability density functions, the centroid of each pore-area distribution
was found and is plotted inFig. 1C. The centroids,
represent-ing the time-averaged pore area encountered by a GNR, exhibit a significant decrease in size as the density of collagen increases. Considering the wide distribution of pore areas, our pore-area centroid measurements are reason-ably consistent with previously reported estimated pore areas
in collagen I based on an effective medium model; a pore width of ~500 nm is reported for 2 mg/mL collagen (21),
cor-responding to a circular area of 0.2mm2, compared to our
measured pore area of 0.14mm2at the same concentration.
Thus, the SEM pore-area analysis shows thatDTis directly
proportional to measured areas, with diffusion decreasing as pores become smaller. Furthermore, we estimate that GNRs free in solution would travel between 43 and 260 nm over the time it takes for OCT signal fluctuations
in collagen to decorrelate ðt¼t1=eÞ. It is interesting to
note that the centroid pore areas in collagen correspond to an effective diameter of ~400 nm, which is consistent with the picture that GNRs are weakly constrained by the collagen fibers while remaining sensitive to changes in pore width.
Sensing heterogeneity in collagen nanoporosity using DS-OCT
Multilayered samples comprised of varying concentrations of collagen were prepared (as shown in the top row of Fig. 2) to demonstrate the ability of DS-OCT to spatially resolve the heterogeneous nanoporosity of a 3D matrix.
HV-OCT images (Fig. 2,middle row) confirm that there is
a constant distribution of GNRs across high-density (HD, 8 mg/mL) and low-density (LD, 2 mg/mL) layers, but they do not provide information on the changing collagen concentration within the images. In comparison, the
corre-sponding DS-OCT images (Fig. 2, bottom row) clearly
discriminate between the different densities, as represented by the transition from dark red to yellow pixels, representing low to high GNR diffusion rates, corresponding to the
changes in nanoporosity established inFig. 1. Interestingly,
HD layered over LD collagen did not yield results exactly as predicted. A valley or gap region is apparent between the
two layers (blue arrow) that exhibits a DT value higher
than what would be found in either HD or LD collagen;
the value ofDTin this region is similar to that in cell media,
i.e., ~951mm2/s compared to 8.8851.02mm2/s in cell
media. We attribute this finding to the existence of a liquid
region void of collagen gel that is caused by the high surface tension of HD collagen in its liquid phase as it was topically deposited onto the LD collagen layer below. This resulted in the denser HD collagen settling to the bottom left of the sample, leaving a void consisting only of liquid.
Another anomaly in the DS-OCT images can be seen in
the lower-right image in Fig. 2, where a region with DT
lower than that expected is observed where the layer of
LD collagen thins near the top of the sample (yellow arrow).
This is attributed to osmotic forces, where the finite volume of fluid available for transfer from the LD to the HD layer may locally dehydrate the LD collagen. Overall, the LD-over-HD condition exhibits a slower GNR diffusion rate in the LD layer and a faster GNR diffusion rate in the HD layer compared to those found in the homogenous samples of the same concentration. Similarly, in the HD-over-LD
condition, HD collagen exhibitsDTvalues higher than those
in homogeneous samples, with values in LD collagen similar to those for the homogenous counterpart. These observations lend further credence to the suggestion that os-motic forces act to equilibrate interstitial fluid concentration across the LD-HD boundary, thus reducing the contrast be-tween nanoporosity measurements across the boundary. If the sources of these image anomalies are indeed due to os-motic or other effects that modify the pore size, it suggests that they are not artifacts of the OCT method; the DS-OCT artifact that we would have expected to observe would
be an increase in apparent DTwith imaging depth due to
increased multiple light scattering (34), which was not observed here. Other authors have described the osmotic forces contributing to collagen swelling (35); similar os-motic forces may have dynamically changed the porosity throughout these samples.
Associating pore area with GNR diffusion rate in 3D culture undergoing ECM remodeling
We previously reported that the GNR diffusion rate is sensi-tive to changes in artificial ECM mechanics under varying
RMF seed densities (16). However, directly connectingDT
to measurements of the pore area was beyond the scope of that study. To validate that GNR diffusion measurements are sensitive to changing nanoporosity in artificial ECM, as they are in collagen, SEM was performed on RMF cul-tures prepared in artificial ECM (collagen/Matrigel) over a range of cell seed densities. Representative SEM images
inFig. 3A show the varying porosity and collagen
align-ment as a function of RMF seed density, with inset angular histograms showing the degree to which collagen was
aligned for each image. The graph in Fig. 3Breports the
pore areas measured for these conditions. These results show that for increasing cell seed density, ECM pores become smaller and ECM fibers become more aligned, sug-gesting that this model exhibits the effects of remodeling by RMF cells.
It has been shown that as fibroblasts grow and migrate, collagen coaligns with external forces from fixed points (i.e., tethering of collagen to a well wall in a 3D matrix) (36). It has been shown that this alignment is a direct response to fibroblasts straining the matrix as they grow and migrate (37). Thus, we attribute our observations of collagen fiber alignment to strain applied by RMF cells. This is also consistent with our observations that artificial ECM gels remained attached to culture well walls throughout the timescale of our experiments; others have shown that wall detachment results in collapse of the matrix and no collagen alignment (38). Interestingly, computer modeling has shown that strain-associated collagen fiber alignment results in increased fiber spacing (39). In contrast, our observations show a decrease of pore size with align-ment, whereas the cultures do not change in volume (no wall detachment). We thus explain our findings by the secre-tion of new ECM by RMFs to fill the voids left between bundled collagen fibers, as seen during wound healing (6). We also note that gels were palpably stiffer for increasing cell seed densities, as seen by previous investigators (40).
Gel stiffness is determined by a combination of strain, fiber density, and cellular compliance, whereas the increased stiffness in our experiments may be attributed to both increasing strain and fiber density. Importantly, fibroblast-induced mechanical changes are implicated in stromal-epithelial cell signaling that leads to increased stromal-epithelial cell malignancy (41,42). In terms of real ECM structure, it has been shown that collagen aligns around tumors, providing a pathway through which cancer cells can travel, potentially increasing malignancy (43). Although our results show that DS-OCT is sensitive to changing porosity in aligned artificial ECM, further studies need to be conducted to determine the influence of cancer-associated ECM align-ment on DS-OCT measurealign-ments. In this study, we show that weakly constrained GNR diffusion measurements are pre-dominantly sensitive to artificial ECM pore areas, comple-menting current techniques used to disentangle ECM properties associated with cancer progression.
The translational GNR diffusion rate, DT,avg, was
measured at each RMF culture condition before assessment
by SEM, as described above. DT,avg represents a spatial
average of GNR diffusion measurements across random lo-cations void of cells (with lolo-cations containing cells rejected according to the conditions described by Eqs. 2 and 3, as
described in Materials and Methods).Fig. 4 shows a plot
of DT,avg, both in artificial ECM with RMF and in pure
collagen, versus measured pore-area centroids. These com-bined data show a consistently increasing trend in GNR diffusion for increasing pore areas across two different types of matrix. The apparent continuity between data in pure collagen and those in 3D RMF culture suggests that GNR diffusion is sensitive primarily to pore size related to matrix composition, with little to no interaction with cells. How-ever, spatially averaged measurements provide limited in-formation on heterogeneity in the ECM structure, which is revealed by DS-OCT imaging, as desribed in the next section.
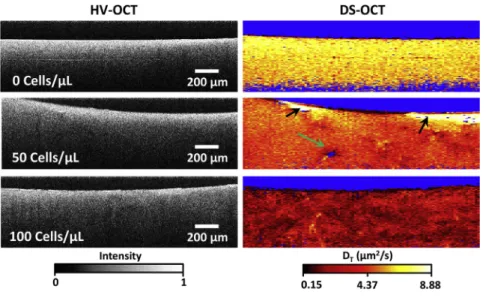
Visualizing ECM remodeling with DS-OCT
Although the above measurements showed that increasing RMF seed densities resulted in lower pore areas on average, DS-OCT is capable of capturing the spatial heterogeneity of artificial ECM remodeling by fibroblasts. Here, we show the spatial pattern of that remodeling as a function of RMF seed density, as revealed by DS-OCT (Fig. 5). First, HV-OCT im-ages provide little information on ECM heterogeneity throughout the tissue, although they confirm a relatively constant distribution of GNRs within the 3D culture. Our previous findings demonstrate that PEGylated GNRs do not enter cells (22) and that 3D RMF cultures exhibit re-gions of low intensity in HV-OCT images that are attributed to locations of the cells that are void of GNRs (16). In this study, we did not observe morphological changes to
fibro-blasts that would indicate disturbance of the cells by the GNRs. Also, we observed minimal voids in HV-OCT and only occasional evidence of cells in the DS-OCT images
(e.g., Fig. 5,green arrow). We attribute this difference to
lower cell densities, which was confirmed by histology of replicate 3D cultures cut along the same cross-sectional plane as in OCT (Fig. S4). Despite the lower RMF densities, the effects of remodeling by RMF cells extend sufficiently throughout the culture volume to be observed within any random cross section sampled by DS-OCT.
DS-OCT of 3D RMF cultures, shown in the right column
inFig. 5, provides a spatially resolved picture of ECM
nano-porosity throughout the sample. To demonstrate the repro-ducibility of these results, we present the results of additional trials using RMF cells with the seed densities
shown here in Fig. S5. The color-map scale of DT was
extended to include the larger range ofDTobserved in these
samples, and we note that the low end of the range is now close to the low end of our system dynamic range
(0.1314.88mm2/s). Interestingly, we observe thatDT
dis-plays increasing heterogeneity with RMF seed density, sug-gesting that we are observing a pattern of remodeling within the 2D DS-OCT cross section by RMFs, throughout the 3D matrix, that act locally on their microenvironment. Anoma-lous regions with high GNR diffusion rates near the top of
one of the samples (Fig. 5,black arrows) are taken to be
liquid areas lacking ECM. In addition to providing insight into the heterogeneity of ECM nanoporosity, DS-OCT shows an overall decrease in GNR diffusion rate for the
100 cell/mL condition (~2.4 mm2/s) as compared to the
50 cell/mL condition (~4.5 mm2/s) and the control
(~6.4 mm2/s), suggesting that the entire network of ECM
is affected by localized strain caused by RMFs and
increased collagen secretion. Interestingly,DT,avgin the
con-trol here was markedly higher than in the concon-trol in the
study above (~3.7mm2/s). We attribute this to swelling of
FIGURE 4 Spatially averaged GNR diffusion measurements in artificial ECM remodeled by fibroblasts and in collagen of varying concentrations show thatDT,avgis positively correlated with nanopore area across all sam-ples, withR2¼0.968 of a linear regression. Error bars represent the stan-dard deviation ofDT,avg,withnR125 measurements obtained for each data point. To see this figure in color, go online.
the gel over the increased 9 day incubation period. We also
note thatDT,avgin the 100 cell/mL condition was similar to
that seen in the study above. Both of these trends over the increased incubation period correspond to previously observed results in RMF cultures with the same seed den-sities (16).
Fibroblasts remodel the ECM by applying tension to the fibers, increasing the ECM density through protein fiber secretion, and/or degrading ECM fibers via protease secre-tion. The effects of tension propagate throughout the culture and have been reportedly seen at distances up to 10 times the
length of the cell (~100mm) (44), which is within the
detec-tible range of DS-OCT. In this study, the heterogeneity in
DT, and thus measured porosity, may be evidence of RMF
cells straining the ECM as they apply tension on the fibers (45,46). The heterogeneity can also partially be attributed
to collagen secretion (as seen in Fig. 3 C), which may
decrease pore size in the vicinity of the cells. Thus, DS-OCT provides a minimally invasive tool with which to study ECM remodeling with little to no impact on cell behavior.
CONCLUSIONS
In this article, we present a novel approach (to our knowl-edge) for quantitative imaging of artificial ECM nanoporos-ity in a 3D in vitro tissue model of fibroblast-associated remodeling in the mammary gland. DS-OCT allows for sensing nanoporosity of a fibrous protein matrix,
demon-strated here over a pore-area range of 1,400–100,000 nm2,
based on measured decorrelation times, within a cross-sectional view up to a penetration depth of ~0.6 mm in 3D
tissue cultures. DS-OCT uses a fundamentallymicroscopic
-resolution imaging modality (OCT) to elucidatenanoscopic
features via weakly constrained diffusion of GNRs. The fact that DS-OCT measures pore areas may have relevance not only to the migration of cancer cells and tumorigenesis (24,25), but to the motion of macromolecules and drug vec-tors as well (47). Interestingly, DS-OCT is complementary to existing multiphoton or confocal microscopy techniques, where ECM fibers are quantified instead of pores. We also note that ECM fibers observed via light microscopy appear coarser than with SEM, likely due to differences in resolution between the two techniques; thus, DS-OCT has the potential to provide new information on a smaller size scale com-pared to that of traditional microscopies. For the first time,
we established a direct link between DT measurements
and pore areas obtained by SEM, showing a consistent posi-tive correlation across both pure collagen I and RMF-remod-eled collagen/Matrigel samples. Measurements in layered collagen samples validate that DS-OCT can accurately quan-tify the spatial heterogeneity of nanoporosity, distinguishing clearly between layered densities.
RMF cells seeded into a 3D matrix of artificial ECM were used here to recapitulate cell forces and secretions that are seen in the ECM of breast tissue as it relates to tissue
remod-eling during tumorigenesis. Decreasing GNR diffusion throughout the artificial ECM of RMFs for increasing seed densities demonstrates the ability of GNRs to sense stromal cell-induced pore area changes with minimal invasiveness, providing a tool with which to quantify nanoporosity throughout artificial tissue without disturbing cells. This minimally invasive method of sensing nanoporosity in re-modeled ECM provides a unique opportunity to directly monitor nanoscale pore-area changes when studying cell cultures. Further improvement in DS-OCT imaging time may be accomplished by high-frame-rate parallel OCT im-aging (48) to obviate the need for lateral scanning. One great appeal of DS-OCT is that additional cellular imaging can be conducted in parallel with nanoporosity analysis, for example, by combining DS-OCT with previous methods us-ing OCT to monitor mammary organoids in vitro (22,49). Employment of this method in tumor organoid models may lead to new connections between cellular function, growth, and migration, in direct relation to artificial ECM nanostructure. Now that we have established a quantitative
relationship betweenDTand artificial ECM pore size, future
studies can apply DS-OCT to reveal remodeling processes in real ECM ex vivo.
SUPPORTING MATERIAL
Five figures are available at http://www.biophysj.org/biophysj/ supplemental/S0006-3495(16)30063-7.
AUTHOR CONTRIBUTIONS
R.L.B. conducted the experiments and processed the data; R.L.B. and A.L.O. developed algorithms used in the data processing; R.L.B., P.C.-H., and R.S. created the samples used in experiments; B.S.C. fabri-cated the GNRs used in this study; R.L.B., P.C.-H., R.S., J.B.T., M.A.T, and A.L.O. participated in the design of the research; and R.L.B and A.L.O. wrote the article, with comments from all authors.
ACKNOWLEDGMENTS
We acknowledge the assistance of Timothy O’Brien and the use of facilities in the Computer Integrated Systems for Microscopy and Manipulation at the University of North Carolina at Chapel Hill, which is funded by the Na-tional Institute of Biomedical Imaging and Bioengineering (P41-EB002025). We also acknowledge use of the Analytical Instrumentation Facility at North Carolina State University, which is supported by the State of North Carolina and the National Science Foundation. Lastly, we acknowledge the use of the Electron Microscopy Division of the Micro-scopy Services Laboratory in the UNC School of Medicine.
REFERENCES
1. Alberts, B., A. Johnson,., P. Walter. 2002. The extracellular matrix of animals. In Molecular Biology of the Cell. Garland Science, New York.
2. Cox, T. R., and J. T. Erler. 2011. Remodeling and homeostasis of the extracellular matrix: implications for fibrotic diseases and cancer. Dis. Model. Mech.4:165–178.
3. Barcus, C. E., P. J. Keely,., L. A. Schuler. 2013. Stiff collagen matrices increase tumorigenic prolactin signaling in breast cancer cells. J. Biol. Chem.288:12722–12732.
4. Kalluri, R., and M. Zeisberg. 2006. Fibroblasts in cancer.Nat. Rev. Cancer.6:392–401.
5. Falzon, G., S. Pearson, and R. Murison. 2008. Analysis of collagen fibre shape changes in breast cancer.Phys. Med. Biol.53:6641–6652.
6. Tomasek, J. J., G. Gabbiani,., R. A. Brown. 2002. Myofibroblasts and mechano-regulation of connective tissue remodelling.Nat. Rev. Mol. Cell Biol.3:349–363.
7. Bhowmick, N. A., E. G. Neilson, and H. L. Moses. 2004. Stromal fibro-blasts in cancer initiation and progression.Nature.432:332–337.
8. Sappino, A. P., O. Skalli,., G. Gabbiani. 1988. Smooth-muscle differ-entiation in stromal cells of malignant and non-malignant breast tis-sues.Int. J. Cancer.41:707–712.
9. Rønnov-Jessen, L., O. W. Petersen, and M. J. Bissell. 1996. Cellular changes involved in conversion of normal to malignant breast: impor-tance of the stromal reaction.Physiol. Rev.76:69–125.
10. Johnson, K. R., J. L. Leight, and V. M. Weaver. 2007. Demystifying the effects of a three-dimensional microenvironment in tissue morphogen-esis.Methods Cell Biol.83:547–583.
11. Levental, K. R., H. Yu,., V. M. Weaver. 2009. Matrix crosslinking forces tumor progression by enhancing integrin signaling. Cell. 139:891–906.
12. Raub, C. B., V. Suresh,., S. C. George. 2007. Noninvasive assessment of collagen gel microstructure and mechanics using multiphoton mi-croscopy.Biophys. J.92:2212–2222.
13. Campagnola, P. 2011. Second harmonic generation imaging micro-scopy: applications to diseases diagnostics. Anal. Chem. 83:3224– 3231.
14. Akhtar, R., N. Schwarzer,., B. Derby. 2009. Nanoindentation of his-tological specimens: mapping the elastic properties of soft tissues. J. Mater. Res.24:638–646.
15. Jones, D. P., W. Hanna,., J. P. Celli. 2014. Longitudinal measurement of extracellular matrix rigidity in 3D tumor models using particle-tracking microrheology.J. Vis. Exp.June 10 (88)
16. Chhetri, R. K., R. L. Blackmon,., A. L. Oldenburg. 2014. Probing biological nanotopology via diffusion of weakly constrained plasmonic nanorods with optical coherence tomography.Proc. Natl. Acad. Sci. USA.111:E4289–E4297.
17. Huang, D., E. A. Swanson,., J. G. Fujimoto. 1991. Optical coherence tomography.Science.254:1178–1181.
18. Boas, D. A., K. K. Bizheva, and A. M. Siegel. 1998. Using dynamic low-coherence interferometry to image Brownian motion within highly scattering media.Opt. Lett.23:319–321.
19. Kalkman, J., R. Sprik, and T. G. van Leeuwen. 2010. Path-length-resolved diffusive particle dynamics in spectral-domain optical coher-ence tomography.Phys. Rev. Lett.105:198302.
20. Chhetri, R. K., K. A. Kozek,., A. L. Oldenburg. 2011. Imaging three-dimensional rotational diffusion of plasmon resonant gold nanorods us-ing polarization-sensitive optical coherence tomography.Phys. Rev. E Stat. Nonlin. Soft Matter Phys.83:040903.
21. Erikson, A., H. N. Andersen,., Cde. L. Davies. 2008. Physical and chemical modifications of collagen gels: impact on diffusion. Biopoly-mers.89:135–143.
22. Oldenburg, A. L., R. K. Chhetri,., J. B. Tracy. 2013. Motility-, auto-correlation-, and polarization-sensitive optical coherence tomography
discriminates cells and gold nanorods within 3D tissue cultures.Opt. Lett.38:2923–2926.
23. Luo, H., G. Tu,., M. Liu. 2015. Cancer-associated fibroblasts: a multifaceted driver of breast cancer progression. Cancer Lett. 361:155–163.
24. Guzman, A., M. J. Ziperstein, and L. J. Kaufman. 2014. The effect of fibrillar matrix architecture on tumor cell invasion of physically chal-lenging environments.Biomaterials.35:6954–6963.
25. Wolf, K., M. Te Lindert,., P. Friedl. 2013. Physical limits of cell migration: control by ECM space and nuclear deformation and tuning by proteolysis and traction force.J. Cell Biol.201:1069–1084.
26. Sapudom, J., S. Rubner,., T. Pompe. 2015. The phenotype of cancer cell invasion controlled by fibril diameter and pore size of 3D collagen networks.Biomaterials.52:367–375.
27. Zaman, M. H., L. M. Trapani,., P. Matsudaira. 2006. Migration of tu-mor cells in 3D matrices is governed by matrix stiffness along with cell-matrix adhesion and proteolysis. Proc. Natl. Acad. Sci. USA. 103:10889–10894.
28. Kozek, K. A., K. M. Kozek,., J. B. Tracy. 2013. Large-scale synthesis of gold nanorods through continuous secondary growth.Chem. Mater. 25:4537–4544.
29. Alkilany, A. M., and C. J. Murphy. 2010. Toxicity and cellular uptake of gold nanoparticles: what we have learned so far?J. Nanopart. Res. 12:2313–2333.
30. Oldenburg, A. L., and R. K. Chhetri. 2011. Digital dispersion compen-sation for ultrabroad-bandwidth single-camera spectral-domain polari-zation-sensitive OCT.Proc. SPIE.7889:78891V1–78891V6.
31. Berne, B. J., and R. Pecora. 2000. Dynamic Light Scattering: With Ap-plications to Chemistry, Biology, and Physics. Dover, New York.
32. Cush, R., P. S. Russo,., H. Ricks. 1997. Rotational and translational diffusion of a rodlike virus in random coil polymer solutions. Macro-molecules.30:4920–4926.
33. Katsumoto, T., T. Naguro,., A. Takagi. 1981. The effect of tannic acid on the preservation of tissue culture cells for scanning electron mi-croscopy.J. Electron Microsc. (Tokyo).30:177–182.
34. Wax, A., C. Yang,., M. S. Feld. 2001. Path-length-resolved dynamic light scattering: modeling the transition from single to diffusive scat-tering.Appl. Opt.40:4222–4227.
35. Elden, H. R. 1958. Rate of swelling of collagen.Science.128:1624– 1625.
36. Stopak, D., and A. K. Harris. 1982. Connective tissue morphogenesis by fibroblast traction. I. Tissue culture observations. Dev. Biol. 90:383–398.
37. Bessea, L., B. Coulomb,., M. M. Giraud-Guille. 2002. Production of ordered collagen matrices for three-dimensional cell culture. Biomate-rials.23:27–36.
38. Ehrlich, H. P., and T. Rittenberg. 2000. Differences in the mechanism for high- versus moderate-density fibroblast-populated collagen lattice contraction.J. Cell. Physiol.185:432–439.
39. Licup, A. J., S. Mu¨nster,., F. C. MacKintosh. 2015. Stress controls the mechanics of collagen networks. Proc. Natl. Acad. Sci. USA. 112:9573–9578.
40. Marquez, J. P., E. L. Elson, and G. M. Genin. 2010. Whole cell me-chanics of contractile fibroblasts: relations between effective cellular and extracellular matrix moduli. Philos Trans A Math. Phys. Eng. Sci.368:635–654.
41. Paszek, M. J., N. Zahir,., V. M. Weaver. 2005. Tensional homeostasis and the malignant phenotype.Cancer Cell.8:241–254.
42. Camp, J. T., F. Elloumi,., M. A. Troester. 2011. Interactions with fi-broblasts are distinct in Basal-like and luminal breast cancers.Mol. Cancer Res.9:3–13.
44. Ma, X., M. E. Schickel,., R. T. Hart. 2013. Fibers in the extracellular matrix enable long-range stress transmission between cells.Biophys. J. 104:1410–1418.
45. Abhilash, A. S., B. M. Baker,., V. B. Shenoy. 2014. Remodeling of fibrous extracellular matrices by contractile cells: predictions from discrete fiber network simulations. Biophys. J. 107:1829– 1840.
46. Sawhney, R. K., and J. Howard. 2002. Slow local movements of collagen fibers by fibroblasts drive the rapid global self-organization of collagen gels.J. Cell Biol.157:1083–1091.
47. Lai, S. K., D. E. O’Hanlon,., J. Hanes. 2007. Rapid transport of large polymeric nanoparticles in fresh undiluted human mucus.Proc. Natl. Acad. Sci. USA.104:1482–1487.
48. Grajciar, B., M. Pircher,., R. Leitgeb. 2005. Parallel Fourier domain optical coherence tomography for in vivo measurement of the human eye.Opt. Express.13:1131–1137.