ORIGINAL INVESTIGATION
Antiretroviral Therapy and the Prevalence
and Incidence of Diabetes Mellitus
in the Multicenter AIDS Cohort Study
Todd T. Brown, MD; Stephen R. Cole, PhD; Xiuhong Li, MAS; Lawrence A. Kingsley, DrPH; Frank J. Palella, MD; Sharon A. Riddler, MD, MPH; Barbara R. Visscher, MD, DrPH; Joseph B. Margolick, MD, PhD; Adrian S. Dobs, MD, MHS
Background:The risk of diabetes mellitus (DM) in hu-man immunodeficiency virus (HIV)–infected patients re-ceiving highly active antiretroviral therapy (HAART) has not been well defined.
Methods:We conducted an analysis in the Multicenter AIDS Cohort Study to determine the prevalence and incidence of DM in this cohort of infected and HIV-seronegative men. Prevalence analysis included 1278 men (710 HIV seronegative and 568 HIV infected, 411 receiving HAART) with fasting glucose concentration determinations at baseline. Incidence analysis included 680 of these 1278 men who at the baseline visit had a fasting glucose concentration of 98 mg/dL (5.4 mmol/L) or less, no reported history of DM, and no self-reported use of antidiabetic medication. Diabetes melli-tus was defined as a fasting glucose concentration of 126 mg/dL (7 mmol/L) or higher, self-reported diagnosis of DM, or self-reported use of antidiabetic medication.
Results:Fifty-seven (14%) of the 411 HIV-infected men using HAART at the baseline visit had prevalent DM com-pared with 33 (5%) of the 711 HIV-seronegative men (prevalence ratio = 4.6; 95% confidence interval, 3.0-7.1, adjusted for age and body mass index[calculated as weight in kilograms divided by the square of height in meters]). The rate of incident DM was 4.7 cases per 100 person-years among HIV-infected men using HAART compared with 1.4 cases per 100 person-years among HIV-seronegative men (rate ratio = 4.11; 95% confidence terval, 1.85-9.16, adjusted for age and body mass in-dex), during the 4-year observation period, based on a median follow-up of 2.3 years.
Conclusion:The incidence of DM in HIV-infected men with HAART exposure was greater than 4 times that of HIV-seronegative men, representing a risk that is higher than previous estimates.
Arch Intern Med. 2005;165:1179-1184
S
INCE THE ADVENT OF HIGHLYactive antiretroviral therapy (HAART) in the mid-1990s, abnormalities in glucose ho-meostasis have been reported with increasing frequency in persons in-fected with human immunodeficiency vi-rus (HIV).1-4Insulin resistance has been described in 41 (61%) of 67 protease in-hibitor (PI)–treated, HIV-infected pa-tients,5and impaired glucose tolerance was observed in 25 (35%) of 71 HIV-infected patients using HAART.6Prevalence esti-mates of diabetes mellitus (DM) are lower. In a cross-sectional study, 28 (6%) of 493 HIV-infected patients had DM.7
Prospective data estimating the inci-dence of DM are beginning to emerge.2,3In the Women’s Interagency HIV Study, 20 (3% or 2.8 cases per 100 person-years) of the 609 HIV-infected women receiving a PI-containing HAART regimen were diag-nosed as having DM during 2.9-year me-dian follow-up period.8In that study, case
ascertainment was determined by self-reports at semiannual visits. Without the use of fasting glucose (FG) concentration de-terminations, however, the true incidence of DM is likely to be underestimated.
Estimates of the incidence of DM and fasting hyperglycemia based on active sur-veillance using recommended diagnostic techniques are needed. In this prospec-tive study, we sought to determine the prevalence and incidence of DM in a well-characterized cohort of HIV-seronega-tive and HIV-infected men with heterog-eneous exposure to antiretroviral therapies.
METHODS
STUDY PARTICIPANTS
The Multicenter AIDS Cohort Study (MACS) en-rolled 5622 homosexual and bisexual men be-tween 1984 and 1991. These men have been seen at semiannual study visits at sites located in Pitts-burgh, Pa; Baltimore, Md; Chicago, Ill; and Los Author Affiliationsare listed at
the end of this article.
Angeles, Calif.9Institutional review boards at each site
ap-proved the MACS protocol and forms, and each participant gave written informed consent. The semiannual study visits consist of a detailed interview, physical examination, and collection of biological specimens, including serologic HIV antibody tests on HIV-seronegative men. Beginning in April 1, 1999, the biologi-cal specimens obtained included a fasting serum sample.
Of the 5622 men enrolled in MACS, 1857 HIV-seroneg-ative men were administrHIV-seroneg-atively censored in 1996, and 1750 had died by April 1, 1999, leaving 2015 men. Of these 1773 (88%) were observed between April 1, 1999, and March 31, 2003, and 1627 had at least 1 blood specimen drawn includ-ing 1278 fastinclud-ing (ⱖ8 hours) serum samples on which the glu-cose concentration was determined. The visit at which a par-ticipant had an initial FG concentration determination was defined as the index visit. At the index visit, the prevalence of DM was determined, defined as an FG concentration of 126 mg/dL (7 mmol/L) or higher, reported DM, or self-reported use of an antidiabetic medication (ie, insulin, sulfo-nylureas, thiazolidinediones, biguanides, meglitinides, or␣ -glu-cosidase inhibitors). Age, body mass index (BMI) (calculated as weight in kilograms divided by the square of height in me-ters), waist-hip ratio, educational attainment, and total cho-lesterol level, all measured at the index visit, and race (ie, white vs nonwhite) were ascertained for all participants.
The study population for incident analysis was composed of 680 of 1278 men. Of the 1278 men, 970 had an FG concen-tration of 98 mg/dL (5.4 mmol/L) or less at the index visit. Of these 970, seven hundred five had follow-up data. The exclu-sion of those with self-reported DM (n=22) or self-reported use of an antidiabetic medication at the index visit (n = 3) yielded the 680 men used in the analysis. The FG concentration cutoff point of 98 mg/dL (which is the lower boundary of the defini-tion of fasting hyperglycemia [ie, 100 mg/dL]10minus about 1
SD for the glucose assay [ie,1.8 mg/dL {0.09 mmol/L}]) was chosen to ensure that the incident study population excluded men with prevalent hyperglycemia.
END POINT ASCERTAINMENT
Two end points were examined in the incident study popula-tion. First, the date of incident DM was defined as the mid-point between the date of the last visit seen free of DM and the date of the first visit seen with DM. Incident DM was defined as an FG concentration of 126 mg/dL (7 mmol/L) or higher, self-reported DM, or current self-reported use of antidiabetic medication, each of which was ascertained at each semiannual study visit beyond the index visit. All FG concentrations were measured by the combined hexokinase/glucose-6-phosphate de-hydrogenase method11using serum samples that had been stored
at −80°C and shipped to a central laboratory (Heinz Labora-tory, Pittsburgh). Self-reported DM was ascertained using the following questions: “Have you seen a doctor or other medical practitioner for any condition since your last visit? If yes, was there a diagnosis for your condition?” Current antidiabetic medi-cation use was determined from a report of all medimedi-cations used since the previous visit. The definition of DM as an FG con-centration of 126 mg/dL or higher is consistent with the guide-lines of the American Diabetes Association.12
The second end point was a combination of incident DM and incident hyperglycemia and was used in the exploratory analyses of the effects of specific antiretroviral medications and disease stage. The date of incident hyperglycemia was defined as the midpoint of the date of the last visit seen with an FG concentration of 100 mg/dL (5.5 mmol/L) or less and the date of the first visit seen with an FG concentration between 100 and 125 mg/dL (5.5 and 6.9 mmol/L). The date of the
com-bined end point was the first of incident DM or incident hy-perglycemia. This combined end point, which included both clinically significant hyperglycemia and DM,10was
con-structed to improve the precision of these analyses by increas-ing the number of events.
ASSESSMENT OF EXPOSURE TO ANTIRETROVIRAL THERAPY
The detailed interview given at each semiannual study visit in-cludes extensive questions about the use of specific antiretro-viral therapies. The definition of HAART followed the Depart-ment of Health and Human Services/Kaiser Panel guidelines13
and has been previously described.14Adherence to
antiretro-viral therapy was assessed by response to interviewer query, “On average, how often did you take your medication as pre-scribed?” recorded in categories of 100%, 95% to 99%, 75% to 94%, or less than 75%, and stratified herein as 95% or higher or less than 95%.
The primary exposures of interest were HIV infection and antiretroviral therapy use. We classified men into the follow-ing 3 groups: (1) HIV seronegative, (2) HIV infected not usfollow-ing HAART, and (3) HIV infected using HAART. We combined HIV-infected men not using HAART (ie, 103 who were antiretro-viral free, 5 using monotherapy, and 49 using combination therapy at the index visit) because of the small number of men and similar event rates. To create time-varying exposure cat-egories, men were classified at each semiannual visit accord-ing to HIV serostatus and self-reported use of antiretroviral therapy in the prior 6 months.
Based on the results of prior studies,5,8we explored the effect
of the individual PIs most frequently used at the index visit on the rate of the combined end point by stratifying the HIV-infected HAART group by exposure to ritonavir, nelfinavir me-sylate, saquinavir meme-sylate, and indinavir sulfate. Self-reported exposure to PIs was classified as time varying (ie, updated at each semiannual visit). To explore the effect of dis-ease severity on the rate of the combined end point among men exposed to HAART at the index visit, we compared men with a nadir CD4 cell count greater than 300 cells/mm3to men with
nadir CD4 cell counts of 300 cells/mm3or less. Nadir CD4 cell
counts greater than 300 cells/mm3represented approximately
the upper quartile of values. This cutoff point was chosen af-ter noting similar rates of the combined end point in the low-est 3 nadir CD4 count quartiles.
STATISTICAL ANALYSIS
The Fisher exact and Wilcoxon nonparametric tests, as appro-priate, were used to test differences in proportions and distri-butions between groups. The prevalence ratio (PR) and 2-sided 95% confidence intervals (CIs) for DM was calculated using a modified Poisson regression15that allowed adjustment for age
and BMI measured at the index visit. Age and BMI were mod-eled as restricted cubic splines with knots at the 5th, 50th, and 95th percentiles, thereby creating a smoothly joined piecewise polynomial that allowed for a flexible association between each covariate and the end point.16Further adjustment for
ratios (RR) and 2-sided 95% CIs were estimated by hazard ra-tios obtained from the Cox proportional hazards regression model,17adjusting for age and BMI as restricted cubic splines.
The assumption of proportional hazards was deemed to hold based on visual inspection of plots of the log[−log S(t)] vs time.
Owing to the scarcity of end points among HIV-infected sub-jects not receiving HAART, this group was excluded from all but descriptive analysis. Men with a missing BMI at study en-rollment (n = 113) had values carried forward from the most recent prior value within 2 years (n = 55) or, if these data were unavailable, were excluded (n = 58) from the multivariable re-gression models. Men with absent self-reports of antiretrovi-ral therapy use (ie, 104 [6%] of 1824 of the expected data points contributed by HIV-infected men) were considered not to be using antiretroviral therapy. Intermittently missing glucose val-ues (ie, 1047 [29%] of 3605 of the expected data points) were carried forward from the most recent prior value. With a 2-sided
␣=.05, an observed sample of 229 HIV-infected HAART-exposed men and 361 HIV-seronegative men, of whom 93 (26%) de-veloped the combined end point in our data, we had 80% sta-tistical power to detect a risk ratio of about 1.5. All stasta-tistical analyses were performed using SAS software, version 8 (SAS Institute Inc, Cary, NC).
RESULTS
PREVALENCE OF DM
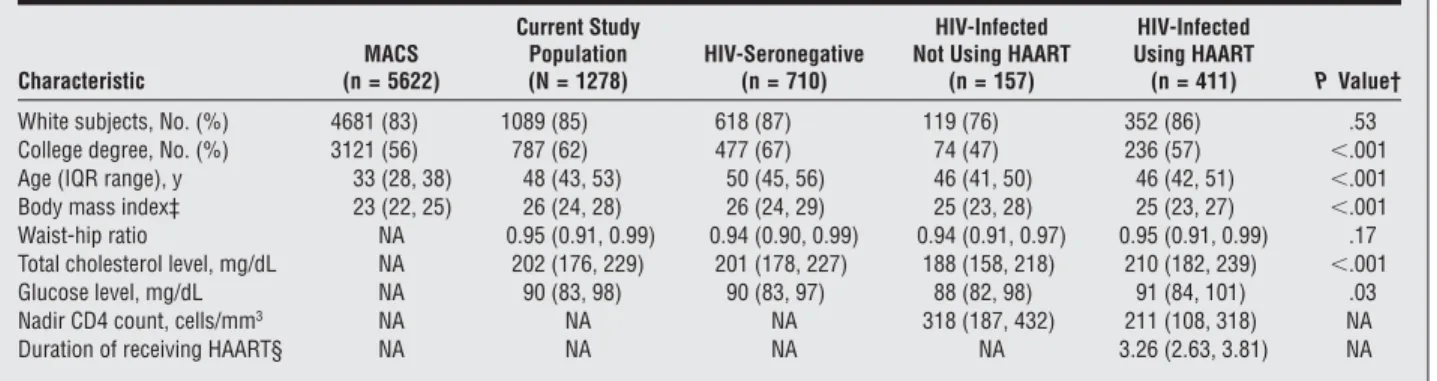
The 1278 men who were alive and under follow-up and had at least 1 FG concentration determination between April 1, 1999, and March 31, 2003, had similar race and educational level but were 15 years older (as expected) and had a slightly higher BMI than the entire 5622 men enrolled in MACS in 1984 (Table 1). Compared with the 411 infected men receiving HAART, the 710 HIV-seronegative men were older, had a slightly higher BMI, and a lower total cholesterol level and were more likely to have a college degree but were otherwise similar. Of the 411 HIV-infected men receiving HAART at the in-dex visit, 110 were receiving more than 1 PI (including 13 who were receiving lopinavir therapy), 207 were re-ceiving 1 PI (105 were rere-ceiving indinavir; 68,
nelfina-vir; 15, saquinanelfina-vir; 13, amprenanelfina-vir; and 6, ritonavir), and 94 were not receiving a PI (40 of 94 had never reported use of a PI). Of the same 411 HIV-infected men receiv-ing HAART, 6 were receivreceiv-ing more than 1 nonnucleo-side reverse transcriptase inhibitor (NNRTI), 178 were receiving 1 NNRTI (92 were receiving efavirenz; 73, nevirapine; and 13, delavirdine mesylate), and 227 were not receiving any NNRTI (187 of 227 had never re-ported NNRTI use).
Prevalent DM was more common among the infected group receiving HAART compared with the HIV-seronegative group (14% vs 5%) (Table 2). Because the HIV-infected group receiving HAART were younger and had a lower BMI than the HIV-seronegative group, the PRs of DM increased after adjustment for these factors (PR for DM = 4.64; 95% CI, 3.03-7.10). The HIV-infected men not using HAART had an increased risk of prevalent DM relative to the HIV-seronegative group af-ter adjustment for age and BMI (Table 2).
Table 1. Characteristics of 1278 Men at the Index Visit Between April and October 1999*
Characteristic
MACS (n = 5622)
Current Study Population (N = 1278)
HIV-Seronegative (n = 710)
HIV-Infected Not Using HAART
(n = 157)
HIV-Infected Using HAART
(n = 411) PValue†
White subjects, No. (%) 4681 (83) 1089 (85) 618 (87) 119 (76) 352 (86) .53
College degree, No. (%) 3121 (56) 787 (62) 477 (67) 74 (47) 236 (57) ⬍.001
Age (IQR range), y 33 (28, 38) 48 (43, 53) 50 (45, 56) 46 (41, 50) 46 (42, 51) ⬍.001
Body mass index‡ 23 (22, 25) 26 (24, 28) 26 (24, 29) 25 (23, 28) 25 (23, 27) ⬍.001
Waist-hip ratio NA 0.95 (0.91, 0.99) 0.94 (0.90, 0.99) 0.94 (0.91, 0.97) 0.95 (0.91, 0.99) .17
Total cholesterol level, mg/dL NA 202 (176, 229) 201 (178, 227) 188 (158, 218) 210 (182, 239) ⬍.001
Glucose level, mg/dL NA 90 (83, 98) 90 (83, 97) 88 (82, 98) 91 (84, 101) .03
Nadir CD4 count, cells/mm3 NA NA NA 318 (187, 432) 211 (108, 318) NA
Duration of receiving HAART§ NA NA NA NA 3.26 (2.63, 3.81) NA
Abbreviations: HAART, highly active antiretroviral therapy; HIV, human immunodeficiency virus; IQR, interquartile range; MACS, Multicenter AIDS Cohort Study. SI conversion factors: To convert total cholesterol to millimoles per liter, multiply by 0.0259; glucose to millimoles per liter, multiply by 0.0555.
*Data are given as medians (interquartile range), unless otherwise indicated.
†Compared HIV-infected receiving HAART group with the HIV-infected group, by the Fisher exact test or the Wilcoxon nonparametric test, as appropriate. ‡Calculated as weight in kilograms divided by the square of height in meters.
§Years from initiation of HAART to the date of index visit.
Table 2. Prevalence of Diabetes Mellitus Among 1278 Men at the Index Visit Between April and October 1999
Patient Group
Diabetes Mellitus*
No. (%) of Patients
PR (95% CI)†
Overall(N= 1278) 101(8) NA
HIV seronegative (n = 710) 33 (5) 1
HIV infected not using HAART (n = 157)
11 (7) 2.21 (1.12-4.38)
HIV infected using HAART (n = 411)
57 (14) 4.64 (3.03-7.10)
Abbreviations: CI, confidence interval; HAART, highly active antiretroviral therapy; HIV, human immunodeficiency virus; NA, not applicable; PR, prevalence ratio.
*Fasting glucose level of 126 mg/dL (7.0 mmol/L) or higher, self-report of
INCIDENCE OF DM
The 680 men in the incidence analysis had characteris-tics similar to the overall study group of 1278 men shown in Table 1 (data not shown). Of these 680, thirty-eight developed DM, 458 completed follow-up without DM, and 184 (27%) were lost to follow-up. The median fol-low-up was 2.3 years (quartiles: 1.1, 3.0). Nineteen in-cident cases were due to an elevated FG concentration, 11 were due to a self-reported diagnosis of DM, and 8 were due to self-reported use of antidiabetic medica-tion. At the index visit, 261 of 319 HIV-infected men were receiving antiretroviral therapy. Of these 261, 255 pro-vided adherence data and 222 (87%) reported regimen adherence of 95% or more of the time.
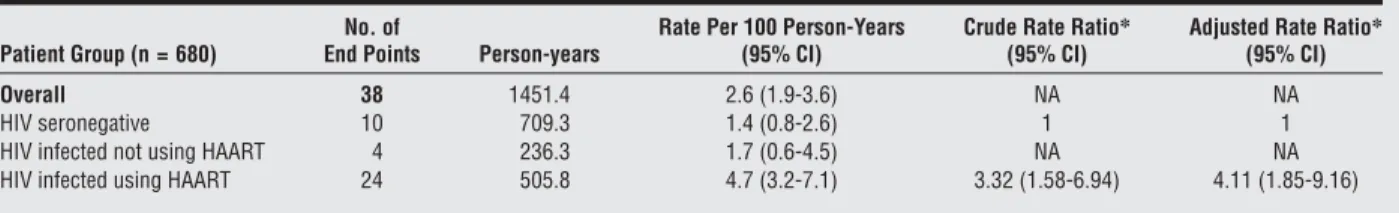
The 229 HIV-infected men using HAART at the in-dex visit had a higher rate of incident DM than the 361 HIV-seronegative men (RR = 4.11; 95% CI, 1.85-9.16; Table 3) after adjustment for age and BMI (Table 3 and Figure). The associations of a 5-unit increase in BMI and age on the rate of incident DM were 1.34 (95% CI, 0.91-1.96) and 1.31 (95% CI, 1.04-1.64), respectively.
EFFECT OF SPECIFIC PI USE AND NADIR CD4 CELL COUNT
Of the 680 men in the incidence analysis, 209 devel-oped the combined end point of DM or hyperglycemia (Table 4), yielding an adjusted RR of 1.64 (95% CI,
1.21-2.33) in the HIV-infected group using HAART com-pared with the HIV-seronegative group. The incidence of the combined end point of DM or hyperglycemia based on the use of specific PIs is given inTable 5. Only rito-navir was significantly associated with an increased rate of the combined end point (RR = 1.70; 95% CI, 1.08-2.68) relative to men not using ritonavir, adjusting for age, BMI, nadir CD4 cell count, and cumulative use of nucleoside reverse transcriptase inhibitors (NRTIs) and NNRTIs. Classification of exposure to the PIs as “ever or never” use did not change our inferences (data not shown).
Among the 229 HIV-infected men using HAART, the 157 with a nadir CD4 cell count of 300 cells/mm3or less at the index visit developed the combined end point at a significantly increased rate compared with the 72 with a nadir CD4 cell count greater than 300 cells/mm3 (RR=1.67; 95% CI, 1.00-2.80, adjusted for age, BMI, and duration of HAART (⬍2 years vs⬎2 years).
COMMENT
We report that during a 4-year follow-up period in the MACS, 24 (10%) of 229 HIV-infected subjects receiving HAART developed DM compared with 10 (3%) of 361 HIV-seronegative men. After adjustment for BMI and age, this difference represents a greater than 4-fold increase in the risk of incident DM among HIV-infected subjects receiving HAART.
These findings support and extend previously ob-served increases in both prevalent and incident fasting hyperglycemia and DM among HIV-infected patients re-ceiving HAART. Initial reports estimated a 5% to 7% cu-mulative incidence of DM in HIV-infected patients re-ceiving HAART,2,3,18but these studies were relatively small, were based on retrospective record review, and used less rigorous ascertainment techniques, such as random blood glucose values.3,18In addition, the lack of an internal com-parison group in many of the initial studies precluded accurate estimates of relative risk. Justman et al1 re-cently reported a relative risk of incident self-reported DM of 2.0 (95% CI, 1.0- 4.1) when HIV-infected women receiving a PI were compared with an HIV-seronegative subgroup prospectively followed in the Women’s Inter-agency HIV Study. The higher crude rate of incident DM in the HIV-infected, HAART-exposed group in the MACS compared with the Women’s Interagency HIV Study (4.7 vs 2.8 [95% CI, 1.6-4.1] cases per 100 person-years) may Table 3. Incidence of Diabetes Mellitus Among 680 Men Between April 1999 and March 2003
Patient Group (n = 680)
No. of
End Points Person-years
Rate Per 100 Person-Years (95% CI)
Crude Rate Ratio* (95% CI)
Adjusted Rate Ratio* (95% CI)
Overall 38 1451.4 2.6 (1.9-3.6) NA NA
HIV seronegative 10 709.3 1.4 (0.8-2.6) 1 1
HIV infected not using HAART 4 236.3 1.7 (0.6-4.5) NA NA
HIV infected using HAART 24 505.8 4.7 (3.2-7.1) 3.32 (1.58-6.94) 4.11 (1.85-9.16)
Abbreviations: CI, confidence interval; HAART, highly active antiretroviral therapy; HIV, human immunodeficiency virus; NA, not applicable.
*Rate ratio and 95% CI estimated by Cox regression; adjusted for age and body mass index (calculated as weight in kilograms divided by the square of height
in meters) at the index visit.
100
80
60
40
20 0
No. of Patients HIV Seronegative HIV Infected Using HAART
361 229
265 204
177 145
89 62
1 2 3
Study Time, y
Patients Free of Diabetes Mellitus, %
HIV Seronegative HIV Infected Using HAART
reflect a more sensitive case ascertainment method in our study. However, other differences between the cohorts, such as sex, race, medication adherence, or severity of HIV disease may also have contributed to the different DM incidence rates. Because fasting serum samples were obtained in the MACS only after mid-1999, many men who were susceptible to the effect of HAART on glucose control could have incurred DM by mid-1999 and, thus, may have been classified as prevalent in this study. There-fore, the relative incidence rates of DM due to HAART that we observed may be conservative estimates.
Antiretroviral medications likely play a causative or permissive role in the pathogenesis of hyperglycemia in HIV-infected patients.1,2,8In our study, we explored the association of several specific PIs with the risk of inci-dent hyperglycemia and DM. Only ritonavir use was sig-nificantly associated with an increased risk of a com-bined end point of DM or hyperglycemia. In vitro evidence suggests that ritonavir is associated with both the devel-opment of insulin resistance19and impaired-cell func-tion.20In clinical studies and in healthy volunteers, ad-ministration of ritonavir-containing regimens has been linked to worse glucose homeostasis.21,22Because 94% of men in our study who were receiving ritonavir therapy were also receiving at least 1 other PI, it is unclear if the effect is due to ritonavir per se or the combination of PIs. Given the few end points, however, these results re-quire independent replication.
Human immunodeficiency virus–related factors may be important in the development of metabolic abnormali-ties in HIV-infected patients. Severity of HIV disease, as estimated by the nadir CD4 cell count, has been associ-ated with increased risk of lipoatrophy,23combined lipo-dystrophy,24and cardiovascular disease.25In the present study, HIV-infected men with lower nadir CD4 cell counts had an increased risk of incident glucose abnormalities compared with those with higher nadir CD4 cell counts. The possibility that confounding factors, such as more dia-betogenic antiretroviral regimens in the more severely ill patients, contributed to this finding cannot be excluded. To assess the contribution of disease-related factors in the pathogenesis of hyperglycemia and DM in the setting of HAART, HIV-infected patients not exposed to HAART are an essential comparison group. In our study, the small size of this group precluded a thorough analysis.
The present study had several additional limitations. First, owing to the semiannual visit schedule, our end
points were based on a single FG concentration surement and were not confirmed by a duplicate mea-surement on a subsequent day as suggested by the Ameri-can Diabetes Association.12 Second, our end point definition included the self-reported diagnosis of DM as one of the criteria, which may have compromised speci-ficity, although in other populations false-positive self-reported diagnoses are infrequent.26Also, since 1278 of the original 5622 MACS participants were included in the study, it is possible that selection biases may have in-fluenced our results. In addition, incident rates may have been slightly underestimated because of the intermit-tently missing FG concentration data. Finally, we did not examine the effect of hepatitis C infection on inci-dent or prevalent DM2; we are investigating this impor-tant issue.
CONCLUSIONS
We found greater than a 4-fold increase in the rate of in-cident DM in HIV-infected participants receiving HAART compared with HIV-seronegative participants. The 4-year risk of 10% is higher than previous estimates and sup-ports the importance of regular screening for hypergly-cemia among HIV-infected persons.
Table 4. Incidence of Combined End Point of Diabetes Mellitus or Fasting Hyperglycemia Among 680 Men Between April 1999 and March 2003
Patient Group (n = 680)
No. of
End Points Person-years
Rate per 100 Person-Years (95% CI)
Crude Rate Ratio* (95% CI)
Adjusted Rate Ratio* (95% CI)
Overall 209 1251.7 16.7 (14.6-19.1) NA NA
HIV seronegative 93 609.2 15.3 (12.5-18.7) 1 1
HIV infected not using HAART 23 207.3 11.1 (7.4-16.7) NA NA
HIV infected using HAART 93 435.2 21.4 (17.4-26.2) 1.38 (1.03-1.84) 1.64 (1.21-2.33)
Abbreviations: CI, confidence interval; HAART, highly active antiretroviral therapy; HIV, human immunodeficiency virus; NA, not applicable.
*Rate ratio and 95% confidence interval estimated by Cox regression; adjusted for age and body mass index (calculated as weight in kilograms divided by the
square of height in meters) at the index visit.
Table 5. Exploratory Analysis of the Risk
of the Combined End Point of Incident Diabetes Mellitus or Fasting Hyperglycemia Based on Exposure to the Protease Inhibitors Used Most Often at the Index Visit in 229 Men Receiving HAART
Type of Protease Inhibitor
Use at Index Visit, No. of Patients
Rate Ratio (95% CI)* Yes No
Any protease inhibitor 178 51 1.06 (0.65-1.75)
Ritonavir 56 173 1.70 (1.08-2.68)
Saquinavir 47 182 1.17 (0.67-2.03)
Indinavir 81 148 0.89 (0.54-1.45)
Nelfinavir 44 185 0.97 (0.51-1.84)
Abbreviation: CI, confidence interval.
*Rate ratio and 95% CI estimated by Cox regression adjusted for age,
Accepted for Publication:December 8, 2004.
Author Affiliations:Department of Medicine, School of Medicine (Drs Brown and Dobs) and Department of Epi-demiology, Bloomberg School of Public Health (Drs Cole and Margolick and Ms Li), The Johns Hopkins Univer-sity, Baltimore, Md; Department of Epidemiology, School of Public Health (Dr Kingsley) and Department of Medi-cine, School of MediMedi-cine, University of Pittsburgh, Pitts-burgh, Pa (Dr Riddler); Department of Medicine, Fein-berg School of Medicine, Northwestern University, Chicago, Ill (Dr Palella); and the Department of Epide-miology, School of Public Health, University of California– Los Angeles (Dr Visscher).
Correspondence:Todd T. Brown, MD, 1830 E Monu-ment St, Suite 333, Baltimore, MD 21287 (tbrown27@jhmi .edu).
Funding/Support:This study was supported by the Na-tional Institute of Allergy and Infectious Diseases, with ad-ditional supplemental funding from the National Cancer Institute: U01-AI-35042, 5-M01-RR-00052 (General Clini-cal Research Center), AI-35043, AI-37984, U01-AI-35039, U01-AI-35040, U01-AI-37613, U01-AI-35041. Role of the Sponsor:The National Institute of Allergy and Infectious Diseases and the National Cancer Institute had representatives on the MACS Executive Committee that
oversaw the management of the study and the data col-lection. The sponsors had no role in the analyses, manu-script preparation, or authorization for publication. Previous Presentation:This study was presented in part at the 11th Conference on Retroviruses and Opportu-nistic Infections; February 10, 2004; San Francisco, Calif.
REFERENCES
1. Justman JE, Benning L, Danoff A, et al. Protease inhibitor use and the incidence of diabetes mellitus in a large cohort of HIV-infected women.J Acquir Immune Defic Syndr. 2003;32:298-302.
2. Mehta SH, Moore RD, Thomas DL, Chaisson RE, Sulkowski MS. The effect of HAART and HCV infection on the development of hyperglycemia among HIV-infected persons.J Acquir Immune Defic Syndr. 2003;33:577-584. 3. Nightingale SL. From the Food and Drug Administration.JAMA. 1997;278:379. 4. Carr A, Samaras K, Thorisdottir A, Kaufmann GR, Chisholm DJ, Cooper DA. Diagnosis, prediction, and natural course of HIV-1 protease-inhibitor-associated lipodystrophy, hyperlipidaemia, and diabetes mellitus: a cohort study. Lancet. 1999;353:2093-2099.
5. Tsiodras S, Mantzoros C, Hammer S, Samore M. Effects of protease inhibitors on hyperglycemia, hyperlipidemia, and lipodystrophy: a 5-year cohort study.Arch Intern Med. 2000;160:2050-2056.
6. Walli R, Goebel FD, Demant T. Impaired glucose tolerance and protease inhibitors. Ann Intern Med. 1998;129:837-838.
7. Walli R, Herfort O, Michl GM, et al. Treatment with protease inhibitors associ-ated with peripheral insulin resistance and impaired oral glucose tolerance in HIV-1-infected patientsAIDS. 2001;12:F167-F173.
8. Hadigan C, Meigs JB, Corcoran C, et al. Metabolic abnormalities and cardiovas-cular disease risk factors in adults with human immunodeficiency virus infec-tion and lipodystrophy.Clin Infect Dis. 2001;32:130-139.
9. Saves M, Raffi F, Capeau J, et al. Factors related to lipodystrophy and metabolic alterations in patients with human immunodeficiency virus infection receiving highly active antiretroviral therapy.Clin Infect Dis. 2002;34:1396-1405. 10. Kaslow RA, Ostrow DG, Detels R, Phair JP, Polk BF, Rinaldo CR Jr. The
Multi-center AIDS Cohort Study: rationale, organization, and selected characteristics of the participants.Am J Epidemiol. 1987;126:310-318.
11. Genuth S, Alberti KG, Bennett P, et al. Follow-up report on the diagnosis of dia-betes mellitus.Diabetes Care. 2003;26:3160-3167.
12. Bondar RJ, Mead DC. Evaluation of glucose-6-phosphate dehydrogenase from Leuconostoc mesenteroidesin the hexokinase method for determining glucose in serum.Clin Chem. 1974;20:586-590.
13. American Diabetes Association. Clinical Practice Recommendations 2004. Dia-betes Care. 2004;27:1-150.
14. Dybul M, Fauci AS, Bartlett JG, Kaplan JE, Pau AK. Guidelines for using antiret-roviral agents among HIV-infected adults and adolescents.Ann Intern Med. 2002; 137:381-433.
15. Riddler SA, Smit E, Cole SR, et al. Impact of HIV infection and HAART on serum lipids in men.JAMA. 2003;289:2978-2982.
16. Zou G. A modified Poisson regression approach to prospective studies with bi-nary data.Am J Epidemiol. 2004;159:702-706.
17. Harrell FE.Regression Model Strategies: With Applications to Linear Models, Lo-gistic Regression, and Survival Analysis. New York, NY: Springer Publishing Co Inc; 2001.
18. Cox DR, Oakes D.Analysis of Survival Data. New York, NY: Chapman & Hall; 1984. 19. Dever LL, Oruwari PA, Figueroa WE, O’Donovan CA, Eng RH. Hyperglycemia as-sociated with protease inhibitors in an urban HIV-infected minority patient population.Ann Pharmacother. 2000;34:580-584.
20. Murata H, Hruz PW, Mueckler M. The mechanism of insulin resistance caused by HIV protease inhibitor therapy.J Biol Chem. 2000;275:20251-20254. 21. Dufer M, Neye Y, Krippeit-Drews P, Drews G. Direct interference of HIV
prote-ase inhibitors with pancreatic beta-cell function. Naunyn SchmiedebergsArch Pharmacol. 2004;369:583-590.
22. Lee GA, Seneviratne T, Noor MA, et al. The metabolic effects of lopinavir/ ritonavir in HIV-negative men.AIDS. 2004;18:641-649.
23. Martinez E, Domingo P, Galindo MJ, et al. Risk of metabolic abnormalities in pa-tients infected with HIV receiving antiretroviral therapy that contains lopinavir-ritonavir.Clin Infect Dis. 2004;38:1017-1023.
24. Lichtenstein KA, Delaney KM, Armon C, et al. Incidence of and risk factors for lipoatrophy (abnormal fat loss) in ambulatory HIV-1-infected patients.J Acquir Immune Defic Syndr. 2003;32:48-56.
25. Mauss S, Corzillius M, Wolf E, et al. Risk factors for the HIV-associated lipodys-trophy syndrome in a closed cohort of patients after 3 years of antiretroviral treatment.HIV Med. 2002;3:49-55.
26. David MH, Hornung R, Fichtenbaum CJ. Ischemic cardiovascular disease in per-sons with human immunodeficiency virus infection.Clin Infect Dis. 2002;34: 98-102.
27. Wu SC, Li CY, Ke DS. The agreement between self-reporting and clinical diag-nosis for selected medical conditions among the elderly in Taiwan.Public Health. 2000;114:137-142.
Multicenter AIDS Cohort Study
Baltimore, Md:The Johns Hopkins University Bloomberg School of Public Health: Joseph B. Margolick, MD, PhD (principal investigator); Haroutune Armenian, MD, DrPh; Adrian Dobs, MD, MHS; Homayoon Farzadegan, PhD: Shenghan Lai, MD; Justin McArthur, MD; Chloe Thio, MD.Chicago, Ill:Howard Brown Health Center, The Feinberg School of Medicine, Northwestern University, and Cook County (Illinois) Bureau of Health Services: John P. Phair, MD (principal investigator); Sheila Badri, MD; Bruce Cohen, MD; Craig Conover, MD, MPH; Mau-rice O’Gorman, PhD; Frank Pallela, MD; Daina Variako-jis, MD; Steven M. Wolinsky, MD.Los Angeles, Calif:
University of California, Los Angeles Schools of Public Health and Medicine: Roger Detels, MD, MS, and Beth Jamieson, PhD (principal investigators); Barbara R. Visscher, MD, DrPH (coprincipal investigator); An-thony Butch, PhD; John Fahey, MD, MS; Otoniel Mar-tínez-Maza, PhD; Eric N. Miller, PhD; John Oishi, MSPH; Paul Satz, PhD; Elyse Singer, MD; Harry Vinters, MD; Otto Yang, MD; Stephen Young, PhD.Pittsburgh, Pa: Uni-versity of Pittsburgh, Graduate School of Public Health: Charles R. Rinaldo, PhD (principal investigator); Lawrence Kingsley, DrPH (coprincipal investigator); James T. Becker, PhD; Phalguni Gupta, PhD; John Mellors, MD; Sharon Riddler, MD; Anthony Silvestre, PhD.
Correction
Error in Renumbering References in Text and Reference List.In the Original Investigation titled “Antiretroviral Therapy and the Prevalence and Incidence of Diabetes Mellitus in the Multicenter AIDS Cohort Study” by Brown et al, published in the May 23rd issue of the ARCHIVES(2005;165:1179-1184), the references were renumbered incorrectly in our publications office before publication. The list is correctly republished herein.
Also on page 1182 in the “Comment” section, paragraph 2, lines 11 to 16 should have read as follows:
“Justman et al8recently reported a relative risk of incident self-reported DM of 2.0 (95% CI, 1.0- 4.1) when
HIV-infected women receiving a PI were compared with an HIV-seronegative subgroup prospectively followed in the Women’s Interagency HIV Study.”
On page 1183, “Comment” section, right hand column, lines 13 to 16 should have read as follows:
“Finally, we did not examine the effect of hepatitis C infection on incident or prevalent DM27; we are investigating this
important issue.”
1. Nightingale SL. From the Food and Drug Administration.JAMA. 1997;278:379.
2. Carr A, Samaras K, Thorisdottir A, Kaufmann GR, Chisholm DJ, Cooper DA. Diagnosis, prediction, and natural course of HIV-1 protease-inhibitor-associated lipodystrophy, hyperlipidaemia, and diabetes mellitus: a cohort study.Lancet. 1999;353:2093-2099.
3. Tsiodras S, Mantzoros C, Hammer S, Samore M. Effects of protease inhibitors on hyperglycemia, hyperlipidemia, and lipodystrophy: a 5-year cohort study.
Arch Intern Med. 2000;160:2050-2056.
4. Walli R, Goebel FD, Demant T. Impaired glucose tolerance and protease inhibitors.Ann Intern Med. 1998;129:837-838.
5. Walli R, Herfort O, Michl GM, et al. Treatment with protease inhibitors associated with peripheral insulin resistance and impaired oral glucose tolerance in HIV-1-infected patients.AIDS. 1998;12:F167-F173.
6. Hadigan C, Meigs JB, Corcoran C, et al. Metabolic abnormalities and cardiovascular disease risk factors in adults with human immunodeficiency virus infection and lipodystrophy.Clin Infect Dis. 2001;32:130-139.
7. Saves M, Raffi F, Capeau J, et al. Factors related to lipodystrophy and metabolic alterations in patients with human immunodeficiency virus infection re-ceiving highly active antiretroviral therapy.Clin Infect Dis. 2002;34:1396-1405.
8. Justman JE, Benning L, Danoff A, et al. Protease inhibitor use and the incidence of diabetes mellitus in a large cohort of HIV-infected women.J Acquir Immune Defic Syndr. 2003;32:298-302.
9. Kaslow RA, Ostrow DG, Detels R, Phair JP, Polk BF, Rinaldo CR Jr. The Multicenter AIDS Cohort Study: rationale, organization, and selected character-istics of the participants.Am J Epidemiol. 1987;126:310-318.
10. Follow-up report on the diagnosis of diabetes mellitus.Diabetes Care. 2003;26:3160-3167.
11. Bondar RJ, Mead DC. Evaluation of glucose-6-phosphate dehydrogenase from Leuconostoc mesenteroides in the hexokinase method for determining glu-cose in serum.Clin Chem. 1974;20:586-590.
12. American Diabetes Association. Clinical practice recommendations 2004.Diabetes Care. 2004;27:1-150.
13. Dybul M, Fauci AS, Bartlett JG, Kaplan JE, Pau AK. Guidelines for using antiretroviral agents among HIV-infected adults and adolescents.Ann Intern Med. 2002;137:381-433.
14. Riddler SA, Smit E, Cole SR, et al. Impact of HIV infection and HAART on serum lipids in men.JAMA. 2003;289:2978-2982. 15. Zou G. A modified poisson regression approach to prospective studies with binary data.Am J Epidemiol. 2004;159:702-706.
16. Harrell FERegression Model Strategies: With Applications to Linear Models, Logistic Regression, and Survival Analysis.New York, NY: Springer Publishing Co Inc; 2001.
17. Cox DR, Oakes DAnalysis of Survival Data.New York, NY: Chapman & Hall; 1984.
18. Dever LL, Oruwari PA, Figueroa WE, O’Donovan CA, Eng RH. Hyperglycemia associated with protease inhibitors in an urban HIV-infected minority pa-tient population.Ann Pharmacother. 2000;34:580-584.
19. Murata H, Hruz PW, Mueckler M. The mechanism of insulin resistance caused by HIV protease inhibitor therapy.J Biol Chem. 2000;275:20251-20254. 20. Dufer M, Neye Y, Krippeit-Drews P, Drews G Direct interference of HIV protease inhibitors with pancreatic beta-cell function.Naunyn Schmiedebergs Arch
Pharmacol. 2004.
21. Lee GA, Seneviratne T, Noor MA, et al. The metabolic effects of lopinavir/ritonavir in HIV-negative men.AIDS. 2004;18:641-649.
22. Martinez E, Domingo P, Galindo MJ, et al. Risk of metabolic abnormalities in patients infected with HIV receiving antiretroviral therapy that contains lopinavir-ritonavir.Clin Infect Dis. 2004;38:1017-1023.
23. Lichtenstein KA, Delaney KM, Armon C, et al. Incidence of and risk factors for lipoatrophy (abnormal fat loss) in ambulatory HIV-1-infected patients.
J Acquir Immune Defic Syndr. 2003;32:48-56.
24. Mauss S, Corzillius M, Wolf E, et al. Risk factors for the HIV-associated lipodystrophy syndrome in a closed cohort of patients after 3 years of antiretroviral treatment.HIV Med. 2002;3:49-55.
25. David MH, Hornung R, Fichtenbaum CJ. Ischemic cardiovascular disease in persons with human immunodeficiency virus infection.Clin Infect Dis. 2002; 34:98-102.
26. Wu SC, Li CY, Ke DS. The agreement between self-reporting and clinical diagnosis for selected medical conditions among the elderly in Taiwan.Public Health. 2000;114:137-142.