UNDERSTANDING OF NOVEL CHEMISTRIES USING MASS SPECTROMETRY, DIFFERENTIAL ION MOBILITY SPECTROMETRY, AND THEORETICAL
CALCULATIONS
David M. Crizer
A dissertation submitted to the faculty at the University of North Carolina at Chapel Hill in partial fulfillment of the requirements for the degree of Doctor of Philosophy in the
Department of Chemistry.
Chapel Hill 2016
ABSTRACT
David M. Crizer: Understanding of Novel Chemistries Using Mass Spectrometry, Differential Ion Mobility Spectrometry, and Theoretical Calculations
(Under the direction of Gary Glish)
Mass spectrometry is a very powerful analytical method that can be used to study a variety of interesting chemistries. The work in this dissertation is generally focused on the understanding of novel chemistries through the use of mass spectrometry, electron capture dissociation (ECD), electron transfer dissociation (ETD), differential ion mobility
In memory of Amy Vess Crizer To Katey, thank you for all that you do.
I couldn’t have done this without all of your support, much love to you. “But I’m glad you finally finished it”
ACKNOWLEDGEMENTS
First, I would like to thank Gary for being supportive throughout my entire career in grad school, which has had quite a few trials and tribulations. I would also like to thank him for the freedom he gives us as students and researchers to do science that we really enjoy.
Thanks to all the Glish Lab members, past and present. You all have managed to keep things interesting and fun for many years. There have been many enlightening science discussions throughout the years and just as many enjoyable times outside of the lab. I wish you all the best.
I would like to thank all of my family members who have stood behind me all throughout my life. They have all been loving and supportive, which has always been
appreciated, especially during some very difficult moments during my time as a grad student. Many thanks go to Nick and Julia who I met while at UNC. They have always been there for me and were always willing to talk with me during times I needed it most. I look forward to our lifelong friendship and all that our futures hold.
TABLE OF CONTENTS
LIST OF TABLES………...xii
LIST OF FIGURES………xiv
LIST OF ABBREVIATIONS AND SYMBOLS………xx
CHAPTER 1: INTODCUCTION TO TECHNIQUES USED TO STUDY NOVEL CHEMISTRIES………...1
1.1 Investigation of Novel Chemistries……….1
1.2 Electron Transfer and Electron Capture Dissociation……….2
1.3 Differential Ion Mobility Spectrometry for Separations………..7
1.4 Energy Deposition in Differential Ion Mobility Spectrometry………....9
1.5 The Electrochemical Nature of the Electrospray Ionization Process……….10
1.6 Theoretical Calculations and Mass Spectrometry………..12
1.7 Summary………14
1.8 References………..16
CHAPTER 2: CATION RECOMBINATION ENERGY/COULOMB REPULSION EFFECTS IN ELECTRON CAPTURE DISSOCIATION AND ELECTRON TRANSFER DISSOCIATION………22
2.1 Electron Capture Dissociation and Electron Transfer Dissociation………..22
2.2 Experimental………..25
2.2.1 Samples and Methods……….25
2.2.2 Data Analysis………..27
2.3.1 Cation Charge and Recombination Energy………...29
2.3.2 Product Ion Partitioning………..31
2.3.3 H•-atom Loss………...39
2.3.4 c/z•-Ion Channels in ECD/ETD………..43
2.4 Conclusions………49
2.5 References………..51
CHAPTER 3: SEPARATING VITAMIN K2 PROTOMERS USING DIFFERENTIAL ION MOBILITY SPECTROMETRY………57
3.1 Introduction………57
3.2 Experimental………..59
3.2.1 Samples………...59
3.2.2 Differential Ion Mobility Spectrometry………..59
3.2.3 Computational Methods………..62
3.3 Results and Discussion………..62
3.3.1 Solution Conditions………62
3.3.2 Separation of Protonated and Sodiated Structures of Vitamin K2……..64
3.3.3 Decomposition of Vitamin K2………...68
3.4 Conclusions………72
3.5 References………..74
CHAPTER 4: ANALYSIS OF HALOBENZOQUINONES – MASS SPECTROMETRY, DIFFERENTIAL ION MOBILITY SPECTROMETRY, ELECTROCHEMISRY, AND THEORETICAL CALCULATIONS………77
4.1 Introduction………77
4.2 Experimental………..78
4.2.2 Low-Temperature Plasma Ionization………..79
4.2.3 Capillary-Skimmer Voltage Difference Studies……….80
4.2.4 Differential Ion Mobility Spectrometry………..81
4.2.5 Cyclic Voltammetry………82
4.2.6 Computational Methods………..82
4.3 Results and Discussion………..83
4.3.1 Unique Ion Types in Mass Spectrometry Formed via Electrochemical Reduction………..83
4.3.2 Separation of Halobenzoquinone Isomers using Differential Ion Mobility Spectrometry………...87
4.3.3 Effect of Increased Energy on Ion Types Observed using Differential Ion Mobility Spectrometry………...89
4.3.4 Electrochemistry and Cyclic Voltammetry……….92
4.3.5 Calculations……….99
4.4 Conclusions………..102
4.5 References………104
CHAPTER 5: A PROGRAM TO CALCULATE THEORETICAL PROPERTIES OF MOLECULES AND IONS……….107
5.1 Introduction………..107
5.2 Experimental………110
5.3 Results and Discussion………112
5.3.1 Graphical User Interface………...…112
5.3.2 Extraction of Important Information from NIST Webbook……...…..113
5.3.3 Conversion of NIST 3D Structure Files to Gaussian Input Files……..118
5.3.5 Extracting Structure Geometries from Gaussian Output Files……….124
5.3.6 Changing Neutral Molecules into Protonated Ions………...125
5.3.7 Changing Neutral Molecules into Molecular Ions………128
5.3.8 Extraction of energies from Gaussian Output Files and Calculation of Important Properties…...………129
5.3.9 Calculation of Heats of Formation………...……….135
5.4 Conclusions………..141
5.5 References………....143
CHAPTER 6: SUMMARY AND FUTURE DIRECTIONS………145
6.1 General Summary………145
6.2 Cation Recombination Energy/Coulomb Repulsion Effects in Electron Capture Dissociation and Electron Transfer Dissociation……….145
6.2.1 Summary………...145
6.2.2 Future Directions………..147
6.3 Separating Vitamin K2 Protomers Using Differential Ion Mobility Spectrometry………..147
6.3.1 Summary………...147
6.3.2 Future Directions………..148
6.4 Analysis of Halobenzoquinones – Mass Spectrometry, Differential Ion Mobility Spectrometry, Electrochemistry, and Theoretical Calculations…………..148
6.4.1 Summary………...148
6.4.2 Future Directions………..149
6.5 A Program to Calculate Theoretical Properties of Ions and Molecules………...149
6.5.1 Summary………...149
APPENDIX 1: AN INTRODUCTION TO ELECTRONIC STRUCTURE THEORY……152
APPENDIX 2: MOLECULAR FORMULAS DETERMINED BY HIGH MASS ACCURACY MASS SPECTROMETRY OF PYROLIZED CELLULOSE………158
APPENDIX 3: FULL CODE OF EXAMPLE.PL……….170
APPENDIX 4: FULL CODE OF GUI.PL……….200
APPENDIX 5: FULL CODE OF GEOMETRY_EXTRACT.PLX………..201
APPENDIX 6: FULL CODE OF WORKUP.PL………...206
APPENDIX 7: FULL CODE OF FIND_ENERGY.PLX……….214
APPENDIX 8: FULL CODE OF FIND_ZPE2.PLX……….215
APPENDIX 9: FULL CODE OF FIND_THERMAL.PLX………..216
APPENDIX 10: THEORETICAL RESULTS FROM CALCULATION PROGRAM……217
APPENDIX 11: FULL CODE OF EMAIL.PL……….228
APPENDIX 12: FULL CODE OF MERGE_FILES.PL………...229
APPENDIX 13: FULL CODE OF RUN.SH……….230
APPENDIX 14: GAUSSVIEW TUTORIAL………231
APPENDIX 15: OVERVIEW OF CALCULATION TYPES IN GAUSSIAN………252
APPENDIX 16: SIMULATED ANNEALING IN AMBER……….263
LIST OF TABLES
Table 2.1 - Product Ion Partitioning for the Ion/Ion Reactions of Doubly
Protonated Peptides with the Radical Anion of Azobenzene………...34
Table 2.2 - Product Ion Partitioning for the Ion/Ion Reactions of Doubly Protonated Peptides with the Radical Anion of 1,3-Dinitrobenzene………...34
Table 2.3 - Product Ion Partitioning from the Ion/Electron Reactions of Doubly Protonated Peptides with Near-Thermal Electrons……….35
Table 3.1 - Ratio of protonated species to sodiated speciesusing various spray solution conditions……….63
Table 4.1 - Ratio of intensities M-•/[M+H]- as the voltage difference between the capillary exit and skimmer is increased……….87
Table 4.2 - Compensation field at peak intensity for various dispersion fields for TetraC-1,2-BQ and TetraC-1,4-BQ for the [M+H]- species………..88
Table 4.3 - Compensation field at peak intensity for various dispersion fields for TetraC-1,2-BQ and TetraC-1,4-BQ for the M- species……….88
Table 4.4 - Cyclic voltammetry Reduction potentials (V) summary for all three halobenzoquinones studied where all values are referenced versus the Ferrocene couple………..99
Table 4.5 - Energetics summary from the theoretical calculations on TetraC-1,2-BQ and TetraC-1,4-BQ. All values are reported in eV. Energy values are reported as positive values for the M- species as that is the convention commonly used for reporting electron affinity values……….100
Table A2 - Molecular Formulas Determined by High Mass Accuracy Mass Spectrometry of Pyrolized Cellulose……….158
Table A10.1 - Theoretical Energy values for C11H12O5………217
Table A10.2 - Theoretical Energy values for C12H14O5………217
Table A10.3 - Theoretical Energy values for C10H10O4………217
Table A10.4 - Theoretical Energy values for C10H12O4………218
Table A10.5 - Theoretical Energy values for C11H12O4………219
Table A10.7 - Theoretical Energy values for C12H12O4………220
Table A10.8 - Theoretical Energy values for C12H14O4………220
Table A10.9 - Theoretical Energy values for C12H16O4………221
Table A10.10 - Theoretical Energy values for C13H14O4………..221
Table A10.11 - Theoretical Energy values for C13H16O4………..221
Table A10.12 - Theoretical Energy values for C14H18O4………..222
Table A10.13 - Theoretical Energy values for C10H18O3………..222
Table A10.14 - Theoretical Energy values for C12H14O3………..222
Table A10.15 - Theoretical Energy values for C12H16O3………..223
Table A10.16 - Theoretical Energy values for C13H16O3………..223
Table A10.17 - Theoretical Energy values for C13H18O3………..224
Table A10.18 - Theoretical Energy values for C14H18O3………..224
Table A10.19 - Theoretical Energy values for C9H10O2………225
Table A10.20 - Theoretical Energy values for C9H12O2………226
LIST OF FIGURES
Figure 1.1 - Peptide product ion nomenclature: For a, b, and c ions the charge is retained on the N-terminal fragment, while x, y, and z ions retain the
charge on the C-terminal fragment………...…….3
Figure 1.2 - Overview of the Cornell mechanism for N-Ca bond cleavage from ETD and ECD experiments of proteins and peptides. C-terminal donor amine group leads to formation of a charged c-type ion and a neutral z-type fragment………..4
Figure 1.3 - Overview of the Cornell mechanism for N-Ca bond cleavage from ETD and ECD experiments of proteins and peptides. N-terminal donor amine group leads to formation of a neutral c-type fragment and a charged z-type ion………..5
Figure 1.4 - Overview of the Utah-Washington mechanism for N-Ca bond cleavage
from ETD and ECD experiments of proteins and peptides………...6 Figure 1.5 - Simple representation of ion mobility as a function of electric field strength
for three ions. DIMS separates ion based on the differential ion mobility between high-field (red bar) and low-field (green bar)………8 Figure 1.6 - Schematic representation of three ions being separated by a DIMS device
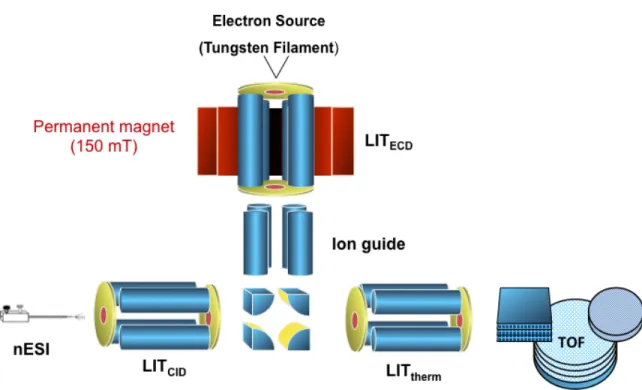
with an applied dc compensation voltage which corrects for the ion trajectory of the ion represented in purple. At this specific dc compensation voltage applied the red and green ions would be neutralized on the electrodes. Alternatively, this dc compensation voltage can be scanned to sequentially pass the different ions through the device………..9 Figure 1.7 - Schematic of the electrospray ionization process………11 Figure 2.1 - Schematic of the NanoFrontier LIT-TOF provided by the Hitachi
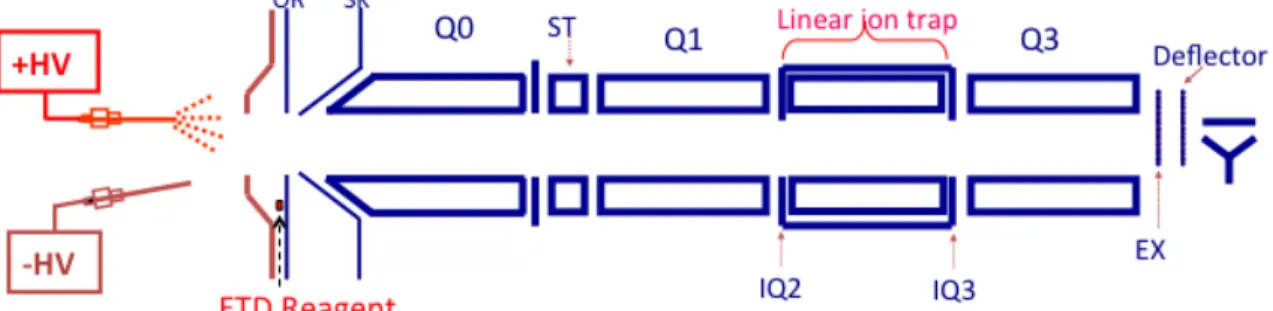
Corporation (Hitachi High Technologies)………...26 Figure 2.2 - Schematic of the triple quadrupole/linear ion trap mass spectrometer
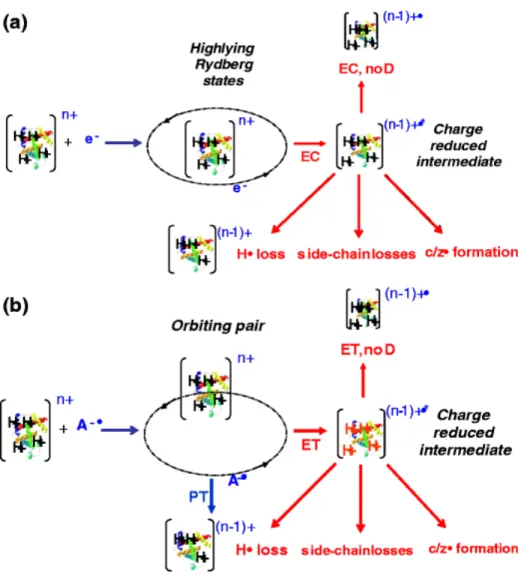
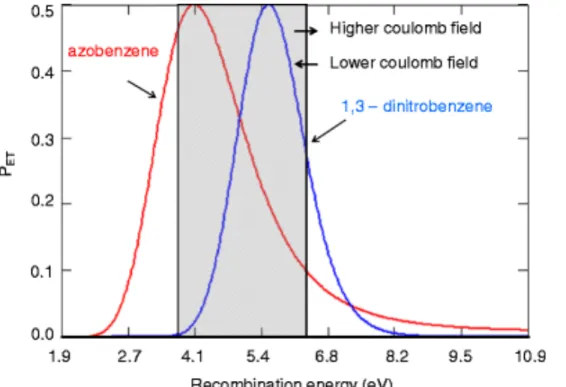
(QTRAP, AB Sciex)………27 Figure 2.3 - Schematic representation of product partitioning in (a) ECD and (b) ETD……33 Figure 2.4 - Plots of PET for the formation of ground state product cations as a
function of cation recombination energy for azobenzene (left-most curve) and 1,3-dinitrobenzene (right-most curve) radical anions generated using the model summarized above. The gray area indicates the range of cation recombination
energies likely to apply to the cations in Tables 2.1, 2.2, and 2.3…...38 Figure 2.5 - Relative abundances of product ions resulting from: (a) ECD (top) and
of [KAGAGK + 2H+]2+………44 Figure 2.6 - Relative abundances of product ions resulting from: (a) ECD (top) and
ETD (bottom) of [KAGAGAGAGK + 2H+]2+, (b) ECD (top) and ETD (bottom) of [KAGAGKAGAG + 2H+]2+, (c) ECD (top) and ETD (bottom)
of [KAGKAGAGAG+ 2H+]2+……….45
Figure 2.7 - Relative abundances of product ions resulting from: (a) ECD (top) and ETD (bottom) of [RAGR+ 2H+]2+, (b) ECD (top) and ETD (bottom) of [RAGAGR + 2H+]2+, (c) ECD (top) and ETD (bottom) of
[RAGAGAGAGR + 2H+]2+……….47
Figure 2.8 - Relative abundances of product ions resulting from: (a) ECD (top) and ETD (bottom) of [HAGH+ 2H+]2+, (b) ECD (top) and ETD (bottom) of [HAGAGH + 2H+]2+, (c) ECD (top) and ETD (bottom) of
[HAGAGAGAGH + 2H+]2+………48
Figure 3.1 - Structures of vitamin K1 and vitamin K2………..58 Figure 3.2 - DIMS assemblies a) AutoCAD drawing of G3 b) Esquire 3000 source
with spray shield c) picture of source with removed spray shield and DIMS assembly in its place d) G4 DIMS device without housing and e) AutoCAD
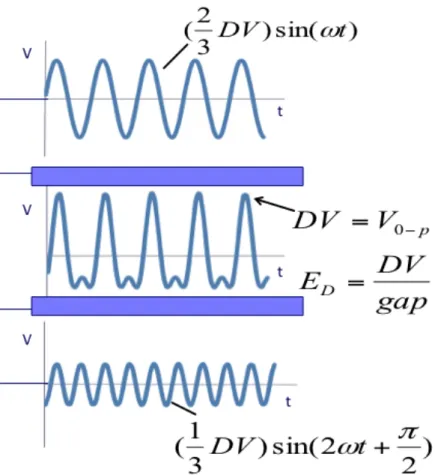
drawing of G4 design………...60 Figure 3.3 - Summation of two sinsusoidal waveforms to form a bisinusoidal waveform
to approximate a rectangular wave………..61 Figure 3.4 - DIMS-MS scan with G3 device of 5 µM vitamin K2 at dispersion field
strength of 30 kV/cm. Two peaks are observed for protonated vitamin K2,
while only one peak is observed for sodiated vitamin K2………64 Figure 3.5 - DIMS-MS scan with G4 device of 5 µM vitamin K2 at dispersion field
strength of 36.7 kV/cm. Two peaks were observed for protonated vitamin K2,
while only one peak was observed for sodiated vitamin K2………65 Figure 3.6 - MS/MS of two vitamin K2 protonated peaks. (a) MS/MS of protonated
vitamin K2 that passes at a lower CV shows less fragmentation along the side-chain (b) MS/MS of protonated vitamin K2 that passes at a higher CV shows more fragmentation along the side-chain which corresponds to the lowest energy structure that has the extended side chain. (c) Fragmentation
scheme of vitamin K2………...66 Figure 3.7 - Proposed vitamin K2 structures from DFT calculations fully optimized at
B3LYP/6-31G(d,p) level of theory. (a) vitamin K2 protonated near the methyl
group (b) vitamin K2 sodiated near side-chain………68 Figure 3.9 - DIMS-MS scan with G4 device of 5 µM Vitamin K2 taken 5 days apart to
show the decomposition of vitamin K2 at dispersion field strength of 36.7 kV/cm. Fresh spray sample (left) and same sample used 5 days later (right)………..69 Figure 3.10 - High mass accuracy MS scan of decomposed vitamin K2 sample on
LTQ-FT Ultra………...70 Figure 3.11 - MS scan of decomposed vitamin K2 sample with Bruker HCT’s supply
gas changed from nitrogen to air…...71 Figure 3.12 - CID of products from the decomposition of vitamin K2 taken at same
activation voltage. (a) [vitamin K2 - H + H+]+ and (b) [vitamin K2 - 2H + H+]+…...72 Figure 4.1 - Halobenzoquinone molecules investigated in this study……….78 Figure 4.2 - Low temperature plasma ionization (LTPI) probe schematic………..80 Figure 4.3 - Bruker HCT ion trap schematic showing Capillary-Skimmer
Voltage Difference………...80 Figure 4.4 - ESI of HBQs using settings of capillary exit at -150 V and skimmer
at -60 V (a) TetraC-1,4-BQ and (b) TetraC-1,2-BQ (the behavior of 2,6-DCBQ is identical to that of tetraC-1,4-BQ and therefore is not shown)………85 Figure 4.5 - DIMS-MS scans for LTPI ionized 2,6-DCBQ at a dispersion field of
36.7 kV/cm in various solvents (a) ethanol (b) acetonitrile and
(c) solid, no solvent………..89 Figure 4.6 - DIMS-MS scans for ESI ionized 2,6-DCBQ at a dispersion field of
36.7 kV/cm at varying dry gas flow rates of (a) 2.5 L/min (b) 5.0 L/min and
(c) 7.5 L/min………90 Figure 4.7 - DIMS-MS scans for ESI ionized TetraC-1,4-BQ at a dispersion field of
36.7 kV/cm at varying dry gas flow rates of (a) 2.5 L/min (b) 5.0 L/min and
(c) 7.5 L/min………91 Figure 4.8 - DIMS-MS scans for ESI ionized TetraC-1,2-BQ at a dispersion field of
36.7 kV/cm at varying dry gas flow rates of (a) 2.5 L/min (b) 5.0 L/min and
(c) 7.5 L/min………92 Figure 4.9 - Cyclic voltammetry of (a) 2,6-DCBQ, (b) TetraC-1,4-BQ, and
(C) TetraC-1,2-BQ in phosphate buffer at pH 7 with a scan rate of 25 mV/sec
(C) TetraC-1,2-BQ in 0.1 M Bu4NPF6 in acetonitrile with a scan rate of 1 V/sec using a silver/silver nitrate reference electrode. Background uncorrected…………..97 Figure 4.11 - Cyclic voltammetry of 0.1 M Bu4NPF6 in acetonitrile with a scan rate
of 1 V/sec using a silver/silver nitrate reference electrode………..98 Figure 4.12 - Schematic showing the important species that are formed via the
electrochemical reduction of halobenzoquinones. These structures served
as a starting points for theoretical calculations………..100 Figure 4.13 - Optimized structures for the [M+H]- ions of TetraC-1,2-BQ (left) and
TetraC-1,4-BQ (right)………102 Figure 5.1 - Example mass spectrum for pyrolized cellulose………110 Figure 5.2 - Graphical User Interface (GUI) for user input………...113 Figure 5.3 - Using Perl module WWW::Mechanize to access the NIST Webbook………..114 Figure 5.4 - Example of NIST Webbook for compounds with formula C12H14O4…………115 Figure 5.5 - Web scrapping url and compound name from NIST Webbook……….116 Figure 5.6 - Accessing url for each compound and saving 2D and 3D
chemical structures……….117 Figure 5.7 - Using Open babel to convert 3D chemical structures from NIST
Webbook into Gaussian input file format………..118 Figure 5.8 - Creating header information for Gaussian input file………..119 Figure 5.9 - Using Perl program merge_files.pl to combiner header and geometry
information to create a complete Gaussian input file………119 Figure 5.10 - Example of complete Gaussian input file. Blank lines around the title
of the calculation and the blank line at the end of the file are necessary for
correct submission to Gaussian………..120 Figure 5.11 - Creating a tarball (archive of files, similarly to a zipped folder of files)…….121 Figure 5.12 - Secure copy of files from user’s computer to the KillDevil supercomputer…121 Figure 5.13 - Commands to move Gaussian input files to appropriate directory
Figure 5.15 - Communicating with KillDevil to determine when the calculations have
finished running……….124 Figure 5.16 - Extracting optimized geometries from Gaussian output file into new
file to be used for Gaussian calculation at next level of theory……….124 Figure 5.17 - Finding all available oxygens in the neutral structure……….126 Figure 5.18 - Converting coordinates for oxygens atoms into coordinates for
hydrogen atom………...127 Figure 5.19 - Determining the number of oxygens in the structure………...128 Figure 5.20 - Command to start program to workup data from calculations……….129 Figure 5.21 - Creating and formatting Excel workbook for data entry and processing…….129 Figure 5.22 - Extracting compound ID numbers and writing them into the
Excel workbook……….130 Figure 5.23 - Extracting total energy values from Gaussian output files and writing
the values into Excel workbook……….131 Figure 5.24 - Inserting formulas into Excel to calculate ionization energy………...132 Figure 5.25 - Determining number of protonated structures for each compound………….133 Figure 5.26 - Writing formulas into Excel to calculate proton affinity……….134 Figure 5.27 - Example output of calculation data for the compound C12H14O4………135 Figure 5.28 - Creating and setting up new worksheet in Excel workbook to calculate
heats of formation………..137 Figure 5.29 - Importing literature values needed to calculate heats of formation into
the Excel worksheet………...139 Figure 5.30 - Inserting formulas into excel to calculated heats of formation at 0 K
and 298 K………...140 Figure 5.31 - Example Excel worksheet output for the heats of formation calculations
Figure A16.1 - Schematic of a potential energy surface………263
Figure A16.2 - Simulated annealing process……….264
Figure A16.3 - AMBER Minimization script………268
Figure A16.4 - AMBER Simulated annealing script……….268
Figure A16.5 - LSF run script………269
LIST OF ABBREVIATIONS AND SYMBOLS
A alanine
Å angstrom
a polarizability of neutral
Ac N-terminal acetylation
ACN acetonitrile
AcOH acetic acid
Ag+ silver ion
an a-type peptide fragment ions
APCI atmospheric pressure chemical ionization
b impact parameter
B3LYP density functional theory method: Becke’s three parameter exchange potential and the correlation functional of Lee, Yang, and Parr
bn b-type peptide fragment ions
Bu4NPF6 tetra-n-butyl-ammonium hexafluoro phosphate
c neutral c-type peptide fragment species
13C carbon-13 isotope
°C degrees Celsius
c+ positively charged c-type peptide fragment ion
cc-pVXZ form of correlation consistent basis sets
cc indicates correlation consistent basis set
CE capillary electrophoresis
CID collision induced dissociation
cm centimeter
cn c-type peptide fragment ions
CV compensation voltage
c/z• c-type or z-type peptide fragment ions
c1n’|c2n’’ Franck-Condon overlap between reactant and product vibrational wave
functions
DBPs disinfection byproducts
dc direct current
DfH°(M,0K) heat of formation of molecular at 0 K
DfH°(X,0K) heat of formation of atom at 0 K
DFT density functional theory
DHET reaction enthalpy of the electron transfer reaction
DIMS differential ion mobility spectrometry
DIMS-MS differential ion mobility spectrometry mass spectrometry scan
DNA deoxyribonucleic acid
dr/dt radial velocity at the crossing point
DTIMS drift-tube ion mobility spectrometry
DV dispersion voltage
E electric field
E energy
e- electron
e0(X) total energy of atom
e0(M) total energy of molecule
EA electron affinity
ECD electron capture dissociation
EC, noD electron capture without dissociation
ED dispersion field
E/N ratio of electric field strength over number density of the gas
ESI electrospray ionization
ET electron transfer
ETD electron transfer dissociation
ET, noD electron transfer without dissociation
eV electron volt
eZPE(M) zero-point energy of molecule
F-C Franck-Condon factor
fµ basis function
FTICR Fourier transform ion cyclotron resonance
G glycine
G indicates that Gaussian type orbitals are used
G3 generation three differential ion mobility spectrometry device
G4 generation four differential ion mobility spectrometry device
GTO Gaussian type orbital
GUI graphical user interface
H histidine
! Hamiltonian of the system
H+ proton
H12 coupling matrix element at the point of closest approach
HCT high capacity trap
HF Hartree-Fock
H• loss hydrogen atom loss
HASTE high amplitude short time excitation
HBQs halobenzoquinones
HPLC high performance liquid chromatography
H°
M enthalpy of molecule
H°x enthalpy of atom
i current
i.d. inner diameter
IE ionization energy
IMS ion mobility spectrometry
IRMPD infrared multiphoton dissociation
J angular momentum of the collision complex
K mobility
K lysine
K Kelvin
K number of sp-type inner shell Gaussian type orbitals
K+ potassium ion
kcal/mol kilocalorie per mole
kJ/mol kilojoule per mole
K-LMG notation of Pople basis set
kV kilovolt
L angular momentum
L number of inner valence s-type and p-type Gaussian type orbitals
Li+ lithium ion
LIT-TOF linear ion trap/time-of-flight mass spectrometer
LITECD linear ion trap ECD cell
LITtherm linear ion trap thermalize cell
LTPI low temperature plasma ionization
LTQ-FT linear ion trap/Fourier transform mass spectrometer
M molar
M number of outer valence s-type and p-type Gaussian type orbitals
µ reduced mass of the collision partners
M+• positive molecular ion
M-• negative molecular ion
[M+H]+ protonated molecule
[M+Na]+ sodiated molecule
[M+2H] neutral species that is molecule with two added protons and two added electrons
[M+H]- negatively charged species with one added proton and one added electron
[M-nH]n- deprotonated ion
µA microamp
mg milligram
MHz megahertz
min minute
MK-n menaquinone molecule with n number of isoprenoid groups in side-chain
mM millimolar
µM micromolar
MS mass spectrometry
MSAE mass selective axial ejection
m/z mass-to-charge ratio
ms millisecond
mT millitesla
mTorr milliTorr
n integer number
n number of protons
N number density of the gas
Na+ sodium ion
N-Ca nitrogen to alpha-carbon bond in peptide
nESI nano electrospray ionization
ng/L nanogram per liter
NH4OOCH ammonium formate
nrel relative velocity of the ions
w radial frequency (2pf)
o.d. outer diameter
PA proton affinity
PET probability of electron transfer reaction
PLZ non-adiabatic probability between states at avoided crossing, based on
Ladau-Zener theory
PTMs post-translational modifications
pV indicates a polarized valence basis
Q1 quadrupole mass spectrometer
Q2 quadrupole ion trap collision cell
Q3 quadrupole mass spectrometer
QTRAP triple quadrupole/linear ion trap mass spectrometer
R arginine
REcat recombination energy of the cation
rET distance at which electron transfer occurs
rf radio frequency
Rn amino acid side-chain residue
s second
sc loss side-chain loss
sec second
sET cross section for the two-body interaction between analtye ion and reagent ion
sin sine wave
t time
"e kinetic energy of electrons
tetraC-1,2-BQ tetrachloro-1,2-benzoqunione
tetraC-1,4-BQ tetrachloro-1,4-benzoqunione
TOF time-of-flight
TOFMS time-of-flight mass spectrometer
"n kinetic energy of nuclei
V volt
V/cm volt per centimeter (electric field strength)
Veff,rot magnitude of the rotational barrier
#ee potential energy of electron-electron interactions
V0-p voltage zero to peak
#ne potential energy of electron-nuclei interactions
#nn potential energy of nuclei-nuclei interactions
X any basic amino acid
X zeta number: D for double, T for triple, or Q for quadruple
x number of atoms
xn x-type peptide fragment ions
x1 x Cartesian coordinate
x2 x Cartesian coordinate
XZ indicates the zeta number for correlation consistent basis set
Y many particle wave function
Y0 wave function
yi one electron wave function
yn y-type peptide fragment ions
y1 y Cartesian coordinate
y2 y Cartesian coordinate
zn z-type peptide fragment ions
z1 z Cartesian coordinate
z• neutral radical z-type peptide fragment species
z+• positively charged radical z-type fragment ion
Zan unit charge of anionic reactant
Zcat unit charge of cationic reactant
2,6-DCBQ 2,6-dichlorobenzoquinone
3-21G Pople basis set
6-31G Pople basis set
6-31G(d,p) Pople basis set with added polarized functions
Chapter 1
Introduction to Techniques Used to Study Novel Chemistries
1.1Investigation of Novel Chemistries
This work is focused on the understanding of novel chemistries using a variety of
techniques. In this work, novel chemistries are probed on the basis of ion energetics. The
analysis of proteins using mass spectrometry is of great interest to the scientific community.
Fragmentation of proteins and peptides gives information about the sequence and structure of
the precursor ions. Investigating the underlying fundamental aspects of peptide
fragmentation allows for a more thorough understanding of the processes involved which
often leads to improvement of these techniques. Fragmentation of peptide ions can be
studied using electron transfer dissociation (ETD) and electron capture dissociation (ECD).
Which are useful alternatives to other dissociation techniques such as collision induced
dissociation (CID) and ultraviolet photo dissociations (UVPD). The ion energetic factors
that affect ETD and ECD are studied in detail in Chapter 2.
The use of differential ion mobility spectrometry (DIMS) in combination with mass
spectrometry aids in the understanding of other novel chemical systems. DIMS has been
well studied as a means for the gas-phase separation of isomeric species. Differences in ion
energetics of isomers plays a role in which isomers (in this case protomers) can be formed.
Gas-phase separations are used to distinguish different protomers (isomers that differ in
Furthermore, the use of DIMS allows some control on the amount of energy that is
imparted to ions as they enter into a mass spectrometer. Subjecting ions to differing electric
field strengths via DIMS allows for the investigation of unique ion types that are observed
when ionizing halobenzoquinones. The electrochemical nature of electrospray ionization
leads to the formation of electrochemically reduced species which results in unique ion types.
The ion energetics associated with different isomeric halobenzoquinones was studied using
the ability to control the energy imparted to these ions via DIMS.
The final chapter in this work discusses a computer program that was written to run
theoretical calculations to obtain theoretical energetic data to aid in the determination of
species observed in mass spectrometry experiments. The program minimizes the need for
user control to determine a variety of theoretical energy values. This program is designed to
be used to aid in the determination of products formed via the pyrolysis of cellulose. This is
of major importance as cellulose is a major component of cigarettes and leads to a
fundamental basis to allow for further research into the products formed during the smoking
process.
1.2Electron Transfer and Electron Capture Dissociation
Electron transfer dissociation (ETD) and electron capture dissociation (ECD) are radical
driven reactions that are used for tandem mass spectrometry [1, 2]. Both of these methods
are most commonly used in the analysis of proteins and peptides. However, ETD and ECD
have also been used to study other species. The significance of ETD and ECD in protein
identification has led to a variety of studies, both experimental and theoretical, that provide
insights into the factors that affect ETD and ECD processes. This discussion will focus on
reagent or from a free electron in vacuo. Upon capture of the low energy electron
fragmentation occurs at primarily the N-Ca bond, but can also occur at amino acid
side-chains and disulfide bonds, while preserving post-translational modifications (PTMs) [3, 4].
Peptide fragmentation gives rise to a variety of fragment ion types (Figure 1.1).
Fragmentation via ETD and ECD breaks the N-Ca bond which results in c-type ions (charge
on N-terminus) and z-type ions (charge on C-terminus).
Figure 1.1. Peptide product ion nomenclature: For a, b, and c ions the charge is retained on the N-terminal fragment, while x, y, and z ions retain the charge on the C-terminal fragment
The mechanism of the fragmentation of peptides/proteins via ECD and ETD has been
of much discussion. Most of this discussion has been focused on two suggested mechanisms.
The first mechanism published is referred to as the Cornell mechanism and was proposed by
Fred McLafferty and coworkers at Cornell University (Figures 1.2 and 1.3) [1]. The
difference in these two schemes is the location of the amine donor group, which determines
where the charge ends up in the fragment species. Electron capture happens at positively
charged sites, which are located at protonated amine groups of N-terminus or a basic amino
acid (lysine, arginine, or histidine) side chain. This captured electron can then reach the
an amide oxygen thus forming an aminoketyl radical intermediate species. Fragmentation
then occurs at the N-Ca bond to the C-terminal side of the aminoketyl radical. This
fragmentation results in the formation of c-type ions and radical z-types ions. The charge of
these products ions depends upon the location of charges in the precursor peptide/protein.
Figure 1.2. Overview of the Cornell mechanism for N-Ca bond cleavage from ETD and
ECD experiments of proteins and peptides. C-terminal donor amine group leads to formation of a charged c-type ion and a neutral z-type fragment
C N C C N C C O O O H H H R H R NH3 H2 N e C N C C N C C O O O H H H R H R
NH3 H2N
C N C C N C C O O O H H H R H R NH3
H2N
H H H C N C C N C C O O O H H H R H R NH3 H2 N H
Figure 1.3. Overview of the Cornell mechanism for N-Ca bond cleavage from ETD and
ECD experiments of proteins and peptides. N-terminal donor amine group leads to formation of a neutral c-type fragment and a charged z-type ion
An alternative to the Cornell mechanism was first proposed by Jack Simons and
coworkers at the University of Utah and by Frank Tureček and coworkers at the University
of Washington [5-7]. Thus this mechanism has become to be known as the Utah-Washington
mechanism (Figure 1.4). The basis of this mechanism is the direct capture of an electron at
an amide group which results in the formation of the aminoketyl radical. Anion
neutralization then occurs via proton transfer from a charged site resulting in the cleavage of
C N C C N C C O O O H H H R H R e C N C C N C C O O O H H H R H R C N C C N C C O O O H H H R H R NH3 H2 N H C N C C N C C O O O H H H R H R NH3 H2 N H NH3 NH2 H NH3 NH2 H
Washington) is the order in which the previously discussed process occurs. The Washington
mechanism suggests proton transfer followed by cleavage of the N-Ca bond, while the Utah
mechanism proposes the reverse order.
Figure 1.4. Overview of the Utah-Washington mechanism for N-Ca bond cleavage from
ETD and ECD experiments of proteins and peptides.
The importance of different factors that affect ETD and ECD have been studied in
detail. The role that different protonation sites have within a given charge state has been
studied for both ETD and ECD [8]. The characteristics of reagent anions for ETD has been
investigated with a major focus on the competition that takes place between electron transfer
and proton transfer[9]. The role of cation charge state and the possible role of the amide
C N C C N C C O O O H H H R H R
NH3 H3N
e C N C C N C C O O O H H H R H R
NH3 H3N
C N C C N C C O O O H H H R H R
NH3 H3N
C N C C N C C O O O H H H R H R NH3
H3N
hydrogen in the mechanism of ETD have also been studied [10]. The work reported on ETD
and ECD in Chapter 2 of this work follows these studies as to the different factors that affect
ETD and ECD.
1.3Differential Ion Mobility Spectrometry for Separations
The importance of mass spectrometry as an analytical technique can be attributed to the
fact that it is highly sensitive and rapid; however, difficulties in analyzing complex mixtures
can arise from low signal-to-background ratios and isomeric/isobaric interferences.
Separation techniques such as liquid chromatography and capillary electrophoresis are often
used prior to mass spectrometry to help aid in reducing sample complexity, but these
methods can often take a significant amount of time [11]. Separation techniques that occur
post ionization such as ion mobility spectrometry (IMS) are significantly faster and can be
used with or without prior separation techniques such as liquid chromatography [12-15].
Techniques based on the low-field mobility of ions as they move through low electric field
strengths have been used extensively.
Another mobility based separation, which is used in this work, is differential ion mobility
spectrometry (DIMS). DIMS differs from the previously mentioned low field mobility
techniques in that as the electric field strength (E) is increased ion mobility becomes
dependent on E/N, where N is the number density of the gas [16-19]. The dependence of ion
mobility on E/N is used in DIMS to separate ions based upon differences in ion mobility in
high and low electric fields. Thus a distinct advantage of DIMS is that it can separate ions
that have equal low field mobilities, which could not be separated with low field techniques
(Figure 1.5). At low electric field strengths only ions represented by the red and light blue
mobilities and therefore can not be separated with low field techniques. However, the ion
mobilities of the ion represented by the orange and blue lines differ at high field strengths
and therefore can be separated using DIMS.
Figure 1.5. Simple representation of ion mobility as a function of electric field strength for three ions. DIMS separates ion based on the differential ion mobility between high-field (red bar) and low-field (green bar).
Differential ion mobility spectrometers consist of two parallel electrodes that are
separated by a gap. A simplified schematic of the DIMS device that is used in this work in
shown in Figure 1.6. The DIMS electrodes are shown in gray and the three colored circles
represent ions that have various differential ion mobilities. When a DIMS device is coupled
to a mass spectrometer, as is done in this work, the gas that flows into the mass spectrometer
serves to pull ions through the device. An asymmetric rf waveform that oscillates between
high and low electric field strengths is applied to the electrodes. The ions move between the
electrodes dependent on their mobilities in high and low electric fields. For all experiments
in this work a dc compensation voltage is applied to one of the electrodes to control
displacement of ions to direct ions of a specific differential ion mobility through the
K
(c
m
2
/V
s)
device[20]. Experiments discussed herein scan the dc compensation voltage to sequentially
pass ions with various differential ion mobilities.
Figure 1.6. Schematic representation of three ions being separated by a DIMS device with an applied dc compensation voltage which corrects for the ion trajectory of the ion represented in purple. At this specific dc compensation voltage applied the red and green ions would be neutralized on the electrodes. Alternatively, this dc compensation voltage can be scanned to sequentially pass the different ions through the device.
DIMS has been studied extensively to separate isomeric and isobaric species. This
technique has been shown capable of separating different conformations of model peptides
such as ubiquitin and cytochrome C [21, 22]. DIMS has also been shown to be useful in
separation of isobaric peptides [23]. Other applications include the separation of isomeric
saccharides [24]. DIMS is used as a separation technique in Chapter 3 of this work to
separate different protomers (isomers differing in protonation site location) of vitamin K2.
1.4Energy Deposition in Differential Ion Mobility Spectrometry
As ions moves through the dynamic electric field of the DIMS device they are
accelerated and decelerated which causes increases and decreases in the kinetic energy of
ions. These ions can then undergo collisions with the carrier gas that can cause them to gain
Most of these studies have been focused around the minimization of the internal energy that
is deposited into ions and the changes that occur in the effective temperature of the ions
[25-29]. The impact of the energy imparted to ions in DIMS is due to the fact that separations
take place at atmospheric pressure, thus causing the ions to be subjected to repeated
collisions with the DIMS carrier gas which is at a different kinetic temperature [30-32].
Increases in the DIMS dispersion field causes ions to accelerate which causes these repeated
collisions to increase the internal energy deposited into the ions. The amount of energy that
is deposited is dependent on ion velocity, gas number density, carrier gas used, and the
temperature of the carrier gas [33-35]. The extent of these collisions, causing collisional
heating, has been studied using a variety of approaches [26, 27, 36, 37]. Collisions in the
DIMS device have been shown previously to cause enough of an increase in internal energy
to cause multiply charged protein ions to isomerize as well as the fragmentation of proton
bound dimers and small molecules [33, 38, 39].
Chapter 4 in this work discusses the effect that this energy that ions are subjected to has
on the ion type that is observed in the mass spectrum. Increased energy imparted to ions is
shown to cause loss of hydrogen atoms to change the ion type observed in mass spectrometry
experiments of electrospray ionized halobenzoquinones.
1.5The Electrochemical Nature of the Electrospray Ionization Process
Electrospray ionization (ESI) has become widely used in analytical analyses [40, 41]. It
is well suited for use in the analysis of biomolecules due to the fact that ESI can produce
multiply charged ions, which can move the mass-to-charge ratio of the ions into the
detectable range for mass spectrometers that have a limited mass range (i.e. quadrupole ion
the coupling with separation techniques such as high performance liquid chromatography
(HPLC) and capillary electrophoresis (CE) [42-44]. ESI mass spectrometry is also more
rapid, sensitive, and accurate to other methods for the analysis of proteins; thus becoming an
essential tool for the analysis of proteins and other biological species [45-48].
ESI occurs when a dilute solution of the analyte of interest is pushed through a capillary
and a voltage is applied to the emitter or the entrance of the mass spectrometer (Figure 1.7).
The electric field that is formed via the application of this voltage causes charge separation at
the liquid surface which pushes the solution through the capillary tip. This produces a Taylor
cone at the tip and when the Rayleigh limit is reached droplets are formed. The droplets
move through the atmosphere towards the mass spectrometer interface and form ions via one
of the several proposed mechanisms.
Figure 1.7. Schematic of the electrospray ionization process. Adapted from [49].
These underlying processes that occur during ESI are still under debate today, over thirty
years after its introduction. While the mechanism of formation of ions during the ESI
ESI Solution - + ++ + + + + - -+ + + + + Mass Spectrometer + + + 2-5 kV Power supply +
-Spray Current (i)
Reduction Oxidation + - + + + + + + + + ++ -+ + + ++ -+ + + ++ -+ + + ++ ++ + ++ + ++ +
Solvent and neutralized ions Taylor Cone ESI Droplets
Metal Plate -100 V
Spray Emitter 2-5 kV
process is still up for debate, the importance of electrochemistry to the process is not [50-52].
The inventor of ESI, John Fenn, when asked about the significance of electrochemistry in
ESI responded that “the idea that electrochemical reactions might be taking place in an ESI
source was too obvious to mention” [50]. While the electrochemistry involved in the ESI
process might be obvious to John Fenn, that is unlikely the case for most users of ESI due to
the fact that the electrochemical processes inherent in ESI are not of importance to the
majority of mass spectrometry experiments that use ESI. For this discussion it is best to
think of an ESI source as s simple two electrode system. Where the ESI emitter serves as
one electrode, while the interface to the mass spectrometer serves as the other.
The ESI source used in this work consists of a grounded ESI emitter with a high voltage
applied to the interface of the mass spectrometer. A thorough examination of this
electrochemical system has been previously published [53]. To summarize, when operated in
positive ion mode electrochemical oxidation can occur at the ESI emitter and conversely
when operated in negative ion mode electrochemical reduction can occur at the emitter.
This is of great importance to the discussion in Chapter 4 of this work on the analysis of
halobenzoquinones using mass spectrometry. The ions observed when halobenzoquinone
compounds are ionized via ESI are not species that are normally observed during ESI mass
spectrometry experiments. Essentially during the ESI process the halobenzoquinone
compounds are electrochemically reduced to form the [M+2H] species which can then lose a
proton to form the unique ion [M+H]-.
1.6 Theoretical Calculations and Mass Spectrometry
Theoretical calculations have long been used to support and help interpret experimental
chemical laws to aid in understanding and predicting chemical phenomena. The availability
of computer programs used for theoretical calculations and fast computer systems has made
the use of theoretical calculations even more widespread. Mass spectrometry is an ideal
situation in which theoretical calculations can be of use due to it being a gas-phase technique
[54]. This is because of the fact that experiments are done in low pressure systems which is
very closely related to isolated systems which is the focus of many theoretical methods.
Theoretical studies have aided in the analysis of mass spectrometry data in many ways.
Calculations have been used to help determine ion structures observed in the gas-phase. This
has become of greater importance in recent years with the increase of research into ion
mobility and ion spectroscopy experiments in combination with mass spectrometry. Low
field ion mobility experiments can result in the determination of collisional cross-sections
which can be compared to theoretically calculated structures and cross-sections [55-59].
Comparison of experimental and theoretical data can aid in identifying the gas-phase
structures that are observed experimentally. Likewise, theoretically calculated vibrational
spectra can be compared to experimental ion spectroscopy data to determine the ion
structures observed experimentally. These experiments have been found to be particularly
useful in the understanding of gas-phase dissociation mechanisms [60-62].
Furthermore, theoretical methods can be used in understanding reaction mechanisms by
doing a thorough analysis of the potential energy surface. The calculation of theoretical
energetic values can be used to determine the relative stability of different ions observed in
mass spectrometry experiments. Calculating basic properties such as ionization energy and
in mass spectrometry experiments, thus aiding in determining what species are observed in
the mass spectrometer.
Theoretical studies in this work are used in a variety of ways to aid in understanding the
experimental data obtained. Chapter 3 and Chapter 4 include the use of theoretical work to
determine why different behavior is observed in the differential ion mobility spectrometry
and mass spectrometry experiments. The work discussed in chapter 5 is entirely theoretical.
A computer program was written to automate the calculation of fundamental energy values to
aid in the determination of species that are presented in an extremely complex sample.
1.7 Summary
This chapter serves to introduce the reader to the basic fundamentals associated with the
techniques that are used in this work to investigate and understand novel chemistries. It
serves as a foundation for understanding the more in depth discussions of these techniques
used in each chapter. This also gives the reader context in which to place the information in
this work in the experimental and theoretical aspects of investigating novel chemistries.
The work in Chapter 2 is focused on fundamental aspects of electron based dissociation
methods (ETD and ECD). It focuses on the dissociation of doubly charged peptides of the
form X(AG)nX as a function of different experimental values. These include the identity of
the basic amino acids present in the peptide (X = K, R, or H), the length of the peptide (n=1,
2, or 4), and the reagent (near-thermal electrons, anions of azobenzene, or anions of
1,3-dinitrobenzene). A full accounting of the various competitive product ion channels is
discussed. A major emphasis is placed on the variation of cation recombination energy
without changing net cation charge via variation of peptide size as well as variation of
Chapter 3 presents work focused on the ability of DIMS to separate isomeric species.
Specifically, the separation of protomers (isomers that differ in protonation site location) of
vitamin K2. Differences in the collision induced dissociation of these protomers are
discussed. DIMS data and DFT calculations are utilized to propose structures for protonated
vitamin K2. Finally, a discussion on the decomposition of vitamin K2 over time is included.
The investigation of unique ion types observed when halobenzoquniones are studied
using electrospray ionization mass spectrometry is discussed in Chapter 4. Included in this
work are studies about the role that electrochemical reduction during the ionization process
plays in the formation of these unique ion types. The ability of DIMS to impart energy to
ions and manipulate the ion type observed is examined. A discussion on the results of
theoretical calculations is used to better understand the behavior of different
halobenzoquinone isomers. Finally, the ability of DIMS to separate halobenzoquinone
isomers is studied.
A program designed to calculate fundamental energetic values is discussed in Chapter 5.
This program is designed in such a way as to automate all steps in the process, thus allowing
for very little needed input from users of the program. All steps involved in the process to
calculate these values are covered. Example results from this program are included. Finally,
Chapter 6 serves as a summary of all results presented in each chapter and includes potential
1.8 REFERENCES
1. Zubarev, R.A., Kelleher, N.L., McLafferty, F.W.; Electron Capture Dissociation of Multiply Charged Protein Cations. A Nonergodic Process. Journal of the American Chemical Society. 1998, 120, 3265-3266.
2. Syka, J.E.P., Coon, J.J., Schroeder, M.J., Shabanowitz, J., Hunt, D.F.; Peptide and Protein Sequence Analysis by Electron Transfer Dissociation Mass Spectrometry. Proceedings of the National Academy of Sciences of the United States of America. 2004, 101, 9528-9533.
3. Zubarev, R.A.; Reactions of Polypeptide Ions with Electrons in the Gas Phase. Mass Spectrometry Reviews. 2003, 22, 57-77.
4. Chi, A., Huttenhower, C., Geer, L.Y., Coon, J.J., Syka, J.E.P., Bai, D.L., et al.; Analysis of Phosphorylation Sites on Proteins from Saccharomyces Cerevisiae by Electron Transfer Dissociation (ETD) Mass Spectrometry. Proceedings of the National Academy of Sciences. 2007, 104, 2193-2198.
5. Sawicka, A., Skurski, P., Hudgins, R.R., Simons, J.; Model Calculations Relevant to Disulfide Bond Cleavage via Electron Capture Influenced by Positively Charged Groups. The Journal of Physical Chemistry B. 2003, 107, 13505-13511.
6. Syrstad, E.A., Tureček, F.; Toward a General Mechanism of Electron Capture Dissociation. Journal of the American Society for Mass Spectrometry. 2005, 16, 208-224.
7. Tureček, F., Chen, X., Hao, C.; Where Does the Electron Go? Electron Distribution and Reactivity of Peptide Cation Radicals Formed by Electron Transfer in the Gas phase. Journal of the American Chemical Society. 2008, 130, 8818-8833.
8. Xia, Y., Gunawardena, H.P., Erickson, D.E., McLuckey, S.A.; Effects of Cation Charge-Site Identity and Position on Electron-Transfer Dissociation of Polypeptide Cations. Journal of the American Chemical Society. 2007, 129, 12232-12243. 9. Gunawardena, H.P., He, M., Chrisman, P.A., Pitteri, S.J., Hogan, J.M., Hodges,
B.D.M., et al.; Electron Transfer versus Proton Transfer in Gas-Phase Ion/Ion Reactions of Polyprotonated Peptides. Journal of the American Chemical Society. 2005, 127, 12627-12639.
10. Crizer, D.M., McLuckey, S.A.; Electron transfer dissociation of amide nitrogen methylated polypeptide cations. Journal of the American Society for Mass Spectrometry. 2009, 20, 1349-1354.
12. Kolakowski, B.M., Mester, Z.; Review of Applications of High-Hield Asymmetric Waveform Ion Mobility Spectrometry (FAIMS) and Differential Mobility
Spectrometry (DMS). Analyst. 2007, 132, 842-864.
13. Hatsis, P., Kapron, J.T.; A Review on the Application of High-Field Asymmetric Waveform Ion Mobility Spectrometry (FAIMS) in Drug Discovery. Rapid Communications in Mass Spectrometry. 2008, 22, 735-738.
14. Xia, Y.-Q., Wu, S.T., Jemal, M.; LC-FAIMS-MS/MS for Quantification of a Peptide in Plasma and Evaluation of FAIMS Global Selectivity from Plasma Components. Analytical Chemistry. 2008, 80, 7137-7143.
15. Kanu, A.B., Dwivedi, P., Tam, M., Matz, L., Hill, H.H.; Ion Mobility–Mass Spectrometry. Journal of Mass Spectrometry. 2008, 43, 1-22.
16. Shvartsburg, A.A. CRC Press, Boca Raton, FL 2009.
17. Eiceman, G.A.K., Z. CRC Press, 2005.
18. Mason, E.A.M., E. W. Wiley, New York, NY 1988.
19. Purves, R.W., Guevremont, R., Day, S., Pipich, C.W., Matyjaszczyk, M.S.; Mass Spectrometric Characterization of a High-Field Asymmetric Waveform Ion Mobility Spectrometer. Review of Scientific Instruments. 1998, 69, 4094-4105.
20. Dharmasiri, U., Isenberg, S.L., Glish, G.L., Armistead, P.M.; Differential Ion Mobility Spectrometry Coupled to Tandem Mass Spectrometry Enables Targeted Leukemia Antigen Detection. Journal of Proteome Research. 2014, 13, 4356-4362. 21. Purves, R.W., Barnett, D.A., Ells, B., Guevremont, R.; Elongated Conformers of
Charge States +11 to +15 of Bovine Ubiquitin Studied using ESI-FAIMS-MS. Journal of the American Society for Mass Spectrometry. 2001, 12, 894-901. 22. Purves, R.W., Guevremont, R.; Electrospray Ionization High-Field Asymmetric
Waveform Ion Mobility Spectrometry−Mass Spectrometry. Analytical Chemistry. 1999, 71, 2346-2357.
23. Isenberg, S.L., Armistead, P.M., Glish, G.L.; Optimization of Peptide Separations by Differential Ion Mobility Spectrometry. Journal of the American Society for Mass Spectrometry. 2014, 25, 1592-1599.
25. Merenbloom, S.I., Flick, T.G., Williams, E.R.; How Hot are Your Ions in TWAVE Ion Mobility Spectrometry? Journal of the American Society for Mass Spectrometry. 2012, 23, 553-562.
26. Shvartsburg, A.A., Prior, D.C., Tang, K., Smith, R.D.; High-Resolution Differential Ion Mobility Separations Using Planar Analyzers at Elevated Dispersion Fields. Analytical Chemistry. 2010, 82, 7649-7655.
27. Kendler, S., Lambertus, G.R., Dunietz, B.D., Coy, S.L., Nazarov, E.G., Miller, R.A., et al.; Fragmentation Pathways and Mechanisms of Aromatic Compounds in
Atmospheric Pressure Studied by GC–DMS and DMS–MS. International Journal of Mass Spectrometry. 2007, 263, 137-147.
28. Shvartsburg, A.A., Danielson, W.F., Smith, R.D.; High-Resolution Differential Ion Mobility Separations Using Helium-Rich Gases. Analytical Chemistry. 2010, 82, 2456-2462.
29. Chen, S.-H., Russell, D.H.; How Closely Related Are Conformations of Protein Ions Sampled by IM-MS to Native Solution Structures? Journal of the American Society for Mass Spectrometry. 2015, 26, 1433-1443.
30. Krylov, E., Nazarov, E.G., Miller, R.A., Tadjikov, B., Eiceman, G.A.; Field Dependence of Mobilities for Gas-Phase-Protonated Monomers and Proton-Bound Dimers of Ketones by Planar Field Asymmetric Waveform Ion Mobility
Spectrometer (PFAIMS). The Journal of Physical Chemistry A. 2002, 106, 5437-5444.
31. Shvartsburg, A.A., Creese, A.J., Smith, R.D., Cooper, H.J.; Separation of a Set of Peptide Sequence Isomers Using Differential Ion Mobility Spectrometry. Analytical Chemistry. 2011, 83, 6918-6923.
32. Levin, D.S., Vouros, P., Miller, R.A., Nazarov, E.G., Morris, J.C.; Characterization of Gas-Phase Molecular Interactions on Differential Mobility Ion Behavior Utilizing an Electrospray Ionization-Differential Mobility-Mass Spectrometer System. Analytical Chemistry. 2006, 78, 96-106.
33. Nazarov, E.G., Coy, S.L., Krylov, E.V., Miller, R.A., Eiceman, G.A.; Pressure Effects in Differential Mobility Spectrometry. Analytical Chemistry. 2006, 78, 7697-7706.
35. An, X., Eiceman, G.A., Räsänen, R.-M., Rodriguez, J.E., Stone, J.A.; Dissociation of Proton Bound Ketone Dimers in Asymmetric Electric Fields with Differential
Mobility Spectrometry and in Uniform Electric Fields with Linear Ion Mobility Spectrometry. The Journal of Physical Chemistry A. 2013, 117, 6389-6401.
36. Shvartsburg, A.A., Li, F., Tang, K., Smith, R.D.; Distortion of Ion Structures by Field Asymmetric Waveform Ion Mobility Spectrometry. Analytical Chemistry. 2007, 79, 1523-1528.
37. Robinson, E.W., Shvartsburg, A.A., Tang, K., Smith, R.D.; Control of Ion Distortion in Field Asymmetric Waveform Ion Mobility Spectrometry via Variation of
Dispersion Field and Gas Temperature. Analytical Chemistry. 2008, 80, 7508-7515. 38. Menlyadiev, M.R., Tarassov, A., Kielnecker, A.M., Eiceman, G.A.; Tandem
Differential Mobility Spectrometry with Ion Dissociation in Air at Ambient Pressure and Temperature. Analyst. 2015, 140, 2995-3002.
39. Veasey, C.A., Thomas, C.L.P.; Fast Quantitative Characterisation of Differential Mobility Responses. Analyst. 2004, 129, 198-204.
40. Cole, R.B., Ed. . Wiley, New York, NY 1997.
41. Pramanik, B.N., Ganguly, A. K., Gross, M. L., Eds. Marcel Dekker, New York, NY 2002.
42. Gelpí, E.; Biomedical and Biochemical Applications of Liquid Chromatography-Mass Spectrometry. Journal of Chromatography A. 1995, 703, 59-80.
43. Niessen, W.M.A., Tinke, A.P.; Liquid Chromatography-Mass Spectrometry General Principles and Instrumentation. Journal of Chromatography A. 1995, 703, 37-57.
44. Slobodník, J., van Baar, B.L.M., Brinkman, U.A.T.; Column Liquid
Chromatography-Mass Spectrometry: Selected Techniques in Environmental Applications for Polar Pesticides and Related Compounds. Journal of
Chromatography A. 1995, 703, 81-121.
45. Fenn, J.B., Mann, M., Meng, C.K., Wong, S.F., Whitehouse, C.M.; Electrospray Ionization for Mass Spectrometry of Large Biomolecules. Science. 1989, 246, 64. 46. Cao, P., Moini, M.; Capillary Electrophoresis/Electrospray Ionization High Mass
Accuracy Time-of-Flight Mass Spectrometry for Protein Identification using Peptide Mapping. Rapid Communications in Mass Spectrometry. 1998, 12, 864-870.
48. Shen, X., Perreault, H.; Characterization of Carbohydrates Using a Aombination of Derivatization, High-Performance Liquid Chromatography and Mass Spectrometry. Journal of Chromatography A. 1998, 811, 47-59.
49. Cech, N.B., Enke, C.G.; Practical Implications of Some Recent Studies in
Electrospray Ionization Fundamentals. Mass Spectrometry Reviews. 2001, 20, 362-387.
50. Mora, J.F.d.l., Van Berkel, G.J., Enke, C.G., Cole, R.B., Martinez-Sanchez, M., Fenn, J.B.; Electrochemical Processes in Electrospray Ionization Mass Spectrometry.
Journal of Mass Spectrometry. 2000, 35, 939-952.
51. Blades, A.T., Ikonomou, M.G., Kebarle, P.; Mechanism of Electrospray Mass Spectrometry. Electrospray as an Electrolysis Cell. Analytical Chemistry. 1991, 63, 2109-2114.
52. Kertesz, G.J.V.B., Vilmos; Using the Electrochemistry of the Electrospray Ion Source. Analytical Chemistry. 2007, 79, 5510-5520.
53. Jackson, G.S., Enke, C.G.; Electrical Equivalence of Electrospray Ionization with Conducting and Nonconducting Needles. Analytical Chemistry. 1999, 71, 3777-3784. 54. Alcamí, M., Mó, O., Yáñez, M.; Computational Chemistry: A Useful (Sometimes
Mandatory) Tool in Mass Spectrometry Studies. Mass Spectrometry Reviews. 2001, 20, 195-245.
55. von Helden, G., Hsu, M.T., Kemper, P.R., Bowers, M.T.; Structures of Carbon Cluster Ions from 3 to 60 Atoms: Linears to Rings to Fullerenes. The Journal of Chemical Physics. 1991, 95, 3835-3837.
56. von Helden, G., Hsu, M.T., Gotts, N., Bowers, M.T.; Carbon Cluster Cations with Up to 84 Atoms: Structures, Formation Mechanism, and Reactivity. The Journal of Physical Chemistry. 1993, 97, 8182-8192.
57. Wyttenbach, T., Helden, G.v., Batka, J.J., Carlat, D., Bowers, M.T.; Effect of the Long-Range Potential on Ion Mobility Measurements. Journal of the American Society for Mass Spectrometry. 1997, 8, 275-282.
58. Wyttenbach, T., Witt, M., Bowers, M.T.; On the Stability of Amino Acid Zwitterions in the Gas Phase: The Influence of Derivatization, Proton Affinity, and Alkali Ion Addition. Journal of the American Chemical Society. 2000, 122, 3458-3464.
60. Bakker, J.M., Aleese, L.M., Meijer, G., von Helden, G.; Fingerprint IR Spectroscopy to Probe Amino Acid Conformations in the Gas Phase. Physical Review Letters. 2003, 91, 203003.
61. Kapota, C., Lemaire, J., Maître, P., Ohanessian, G.; Vibrational Signature of Charge Solvation vs Salt Bridge Isomers of Sodiated Amino Acids in the Gas Phase. Journal of the American Chemical Society. 2004, 126, 1836-1842.
Chapter 2
Cation Recombination Energy/Coulomb Repulsion Effects in Electron Capture Dissociation and Electron Transfer Dissociation
2.1 Electron Capture Dissociation and Electron Transfer Dissociation
Mass spectrometry has become increasingly useful for the identification and
characterization of proteins and peptides with collision induced dissociation (CID) being the most frequently used technique for investigating these types of ions [1]. Infrared
multiphoton dissociation (IRMPD) produces similar results to that of CID as they both depend on vibrational excitation of the precursor ion [2]. Electron capture dissociation (ECD) is one of several methods that have been developed to avoid the need to use slow heating vibrational excitation methods. ECD relies on a multiply charged precursor ion capturing a low energy thermal electron, which results in dissociation [3]. The ion/ion analog of ECD is electron transfer dissociation (ETD) [4,5]. During an ETD ion/ion reaction an electron is transferred from a reagent ion, such as the radical anions of fluoranthene or azobenzene, to a multiply charged cation [6,7]. Upon transfer of the electron, the charge-reduced ion undergoes fragmentation similar to ECD.
ECD and ETD both result in dissociation of backbone N-Ca bonds as well as
cleavage of disulfide bonds. Electron based dissociation techniques are complementary to CID, as ECD/ETD is less dependent on amino acid sequence and labile
biomolecules. Preservation of CID-labile PTMs has been given as support for the claim that ECD and ETD are non-ergodic processes [8]. It is still unclear as to what extent
intramolecular energy transfer occurs [9].
The mechanism by which ECD and ETD occurs is a subject of much debate. The initial proposed mechanism was developed by McLafferty and co-workers, referred to as the Cornell mechanism, suggested that electron localization occurred at a protonated arginine (R) or lysine (K) side chain resulting in neutralization and hydrogen atom loss [10]. The
hydrogen atom is then transferred to either a carbonyl oxygen of an amide group leading to
cleavage of the N-Ca bond or to a disulfide bond which results in cleavage of that bond
[11,12]. A coulomb stabilized dissociation, known as the Utah-Washington model, was developed independently by Tureček and co-workers and Simons and co-workers [13-15]. This mechanism considers electron capture at a π* orbital delocalized over an amide group which gives rise to an electronic excited state of the charge-reduced radical cation. Then a proton can be abstracted to form a fragile aminoketyl radical, thus causing backbone
dissociation. Alternatively, the charge stabilized amide π* excited state can undergo N-Ca
bond cleavage to form an enole-imidate anion which can be stabilized by abstracting a proton intramolecularly to form product ions.
ECD and ETD mechanisms have much in common, especially when just considering the dynamics that take place after the electron has been captured by the ion. The dissociation
that occurs during ECD and ETD result in N-Ca cleavage, preservation of labile PTMs, and
preferential cleavage of disulfide bonds. However, there are still both fundamental
transfer requires that the electron affinity of the reagent species be overcome in order to transfer the electron. Another major difference is that only electron capture occurs during the ion/electron process, while proton transfer always competes with electron transfer during the ion/ion reaction. Most reagents tested for ETD only remove protons from multiply charged biomolecules and show no propensity for electron transfer [16-23]. Only a few reagents have been shown to have electron transfer that competes with proton transfer, which has been described using a model based on Landau-Zener theory [24,25]. For electron transfer to compete with proton transfer, the reagent should have a low electron affinity and favorable Franck-Condon factors for vertical electron detachment [26,27].
Complications in comparing ECD and ETD data arise due to differences in how ECD and ETD experiments are implemented. ETD is typically done in electrodynamic ion traps with bath gas pressures of 1-10 mTorr, whereas ECD is done in ion cyclotron resonance cells with pressure in the 10-8 Torr range or lower. There are a few examples of ECD being implemented in ion traps with higher bath gas pressures [28-31]. These instruments employ reaction conditions that are much closer to those used for ETD.
In this work ECD and ETD experiments were both performed in ion traps operated in the presence of a bath gas in the 1-10 mTorr pressure range allowing for more direct
comparisons to be made. The focus of this work is on systematically studying the product partitioning of ECD and ETD reactions. Emphasis was placed in the variation of cation recombination energy without changing net cation charge via variation of peptide size as well as variation of reaction exothermicity by changing the identity of the reagent (i.e., thermal electrons, radical anions of azobenzene and radical anions of