Sales Reporting and Analysis
1Richard J. Petti ModelSheet Software, LLC E-mail: [email protected] URL: http://www.modelsheetsoft.com
Customizable Spreadsheet: http://templates.modelsheetsoft.com/modelsheettemplates/sales-report-templates.aspx Blog: http://blog.modelsheetsoft.com
Group: http://groups.yahoo.com/group/modelsheet
October 25, 2011
Abstract: This paper briefly summarizes how the Customizable Spreadsheet Solution for Sales Reporting and Analysis can help you improve your business. A brief case study is included.
Contents
1
Introduction
1
2
Case Study
1
2.1 Case Situation 1 2.2 The Challenge 2 2.3 Solution 2 2.4 Case Outcome 53
Customizable Spreadsheet Solution
5
4
Conclusion
7
1
Introduction
Your sales data is the first and best source of information about your business. It tells you where you are succeeding by product and market segment over time. Totals give you an overview, and the details exposes issues in specific business segments.
The Sales Reporting and Analysis model gives you maximum flexibility with the least effort to explore your sales data and extract valuable information that can improve decisions in many areas. The model uses pivot tables and charts that help you view top-down totals and segment details in one report, in which all the numbers are consistent.
Spreadsheets led the “desktop revolution” that freed business experts to experiment and self-serve with less dependence on IT professionals. A Customizable Spreadsheet Solution is a spreadsheet model that you can adapt to your situation by filling in a simple online form, without editing a spreadsheet or its formulas. You get a customized spreadsheet that matches your needs better than any conventional template.
The company already had good sales reports for the largest segments. However, the reports did not adjust for systemic distortions in prices, exchange rates, license types that served more users and were price higher, timing of payment of service orders. For example, Japan looked roughly half its real size in revenue reports because it was served by indirect distribution that had lower transfer prices than company-owned distribution channels.
Discussions at the dozen segment management board meetings were revealing. People asked many perceptive questions whose answers had actionable consequences, but the company did not have reliable answers. Important issues were often decided by anecdotes and speculation.
2.2 The Challenge
The key management challenge was to improve the quality of decisions and organizational buy-in by providing reliable quantitative answers to many key questions that arise in business reviews. The company's databases often contained adequate data to address the issues.
The challenge in business analysis was to design and implement reports that could provide answers to key questions arising in business reviews. The solution should use analytic tools that executives, middle managers and professionals can use without a lot of training.
2.3 Solution
The sales reporting system presented many views.
• Revenue and sales units by tens of thousands of segments, rollup up to company totals.
• Trailing four-quarter reports that eliminate seasonality and diminish the distortion of trends caused by random large orders
• Installed base reports that answered many important questions about where the company’s products were used. • Product correlation reports that quantified which products were purchased together in which market segments. • Application reports that quantified how often each product was used in each major application area.
• Customer reports that showed how many of each product a customer owned and had recently purchased. The new reports that adjusted for the major factors that distorted trends in the regular reports.
• Adjust for distributor pricing, exchange rates, and other regional pricing factors
• Adjust for concurrent licenses that effectively serve more users (and cost more) than individual named user licenses.
• Measure the effects of discounting, especially volume discounting by market segment.
• Eliminate the effect of early payment of service contracts, which was large, and distorted trends.
The following sales reporting application was not generated by ModelSheet. Sales reporting involves large volumes of reports with relatively little analytical complexity. Therefore it is not among the first applications we have done with ModelSheet.
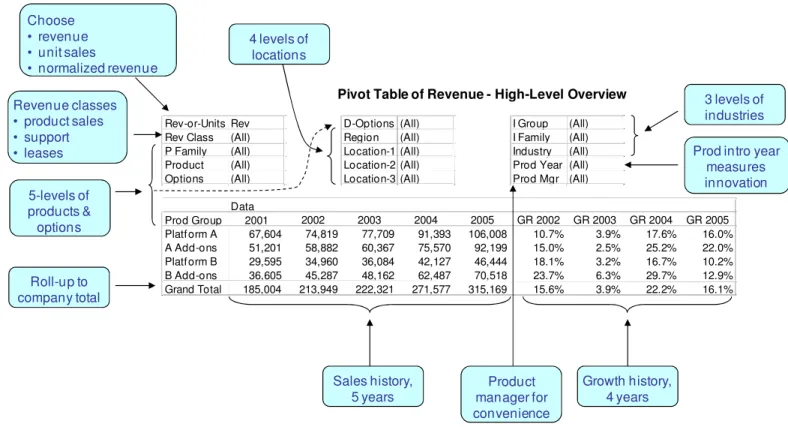
Figure 1: Pivot Sales Report with High-level and Low-level Views
Figure 2: Sales reports should show appropriate detail for all levels of management Pivot Table of Revenue - High-Level Overview Rev-or-Units Rev D-Options (All) I Group (All) Rev Class (All) Region (All) I Family (All) P Family (All) Location-1 (All) Industry (All) Product (All) Location-2 (All) Prod Year (All) Options (All) Location-3 (All) Prod Mgr (All)
Data Prod Group 2001 2002 2003 2004 2005 GR 2002 GR 2003 GR 2004 GR 2005 Platf orm A 67,604 74,819 77,709 91,393 106,008 10.7% 3.9% 17.6% 16.0% A Add-ons 51,201 58,882 60,367 75,570 92,199 15.0% 2.5% 25.2% 22.0% Platf orm B 29,595 34,960 36,084 42,127 46,444 18.1% 3.2% 16.7% 10.2% B Add-ons 36,605 45,287 48,162 62,487 70,518 23.7% 6.3% 29.7% 12.9% Grand Total 185,004 213,949 222,321 271,577 315,169 15.6% 3.9% 22.2% 16.1% Choose • revenue • unit sales • normalized revenue 5-levels of products & options 4 levels of locations Revenue classes • product sales • support
• leases Prod intro year
measures innovation Product manager for convenience Sales history, 5 years Growth history, 4 years Roll-up to company total 3 levels of industries Data
Region Location-1 Location-2 Location-3 2002 2003 2004 2005
EMEA France 18,924 31,789 45,331 35,634 Germany 32,077 43,970 47,089 48,574 Nordic 8,868 23,509 3,280 28,703 UK 28,758 22,718 27,321 44,693 EMEA-Tier 2 Benelux 15,706 -3,284 15,045 11,273 Israel 5,512 20,296 -1,364 23,076 Italy 5,186 4,794 21,493 4,208 Spain 15,768 9,587 1,603 11,524 Switzerland 17,337 13,304 8,484 13,490
EMEA-Other Czech Republic 6,142 3,282 -6,382 -9,105
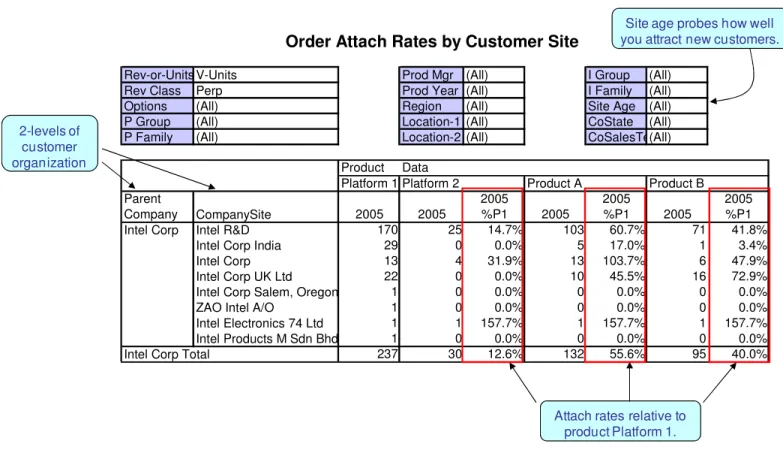
Figure 3: Customer-level Sales Report with Order Attach Rates
The figure above shows an example of using customer-specific sales reports to identify sales opportunities. It shows customer sites in the same company doing similar work that have very different ratios between the company’s products. There may be a good reason for the different product ratios, but this is the sort of situation that merit exploration with the customer.
This kind of analysis is also useful for comparing companies in similar industries with similar applications.
A useful variant of this approach is “market basket analysis.” This analysis reports how often certain combinations of products are purchased together, and compares the market baskets purchased by different customers.
Order Attach Rates by Customer Site
Rev-or-Units V-Units Prod Mgr (All) I Group (All)
Rev Class Perp Prod Year (All) I Family (All)
Options (All) Region (All) Site Age (All)
P Group (All) Location-1 (All) CoState (All)
P Family (All) Location-2 (All) CoSalesTeam(All)
Product Data
Platform 1 Platform 2 Product A Product B
Parent Company CompanySite 2005 2005 2005 %P1 2005 2005 %P1 2005 2005 %P1
Intel Corp Intel R&D 170 25 14.7% 103 60.7% 71 41.8%
Intel Corp India 29 0 0.0% 5 17.0% 1 3.4%
Intel Corp 13 4 31.9% 13 103.7% 6 47.9%
Intel Corp UK Ltd 22 0 0.0% 10 45.5% 16 72.9%
Intel Corp Salem, Oregon 1 0 0.0% 0 0.0% 0 0.0%
ZAO Intel A/O 1 0 0.0% 0 0.0% 0 0.0%
Intel Electronics 74 Ltd 1 1 157.7% 1 157.7% 1 157.7%
Intel Products M Sdn Bhd 1 0 0.0% 0 0.0% 0 0.0%
Intel Corp Total 237 30 12.6% 132 55.6% 95 40.0%
2-levels of customer organization
Attach rates relative to product Platform 1.
Site age probes how well you attract new customers.
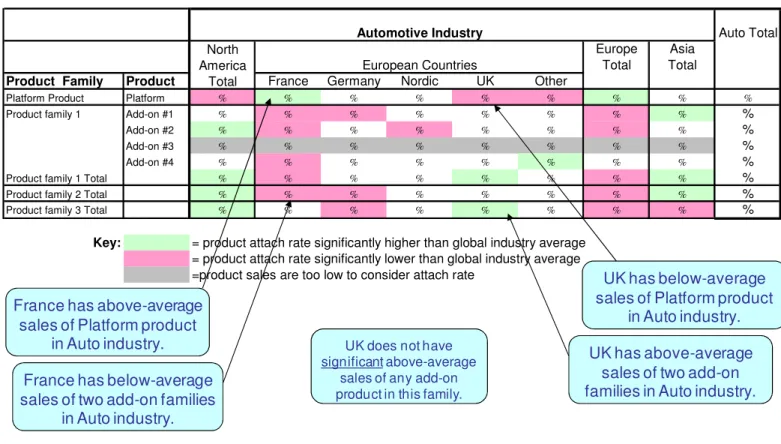
Figure 4: Color Maps help spot segments with above and below-average performance
The color map above gives you a quick sense of what segments are doing better or worse than the global average. The company in the case study presented these tools to their largest foreign office, showing how to zero in on a problem.
• Show that a country has lower attach rates for some key products in certain industries, compared to global averages.
• Trace the deficiency in sales to specific customer companies and sites.
• Related the deficiency to specific marketing programs that were not carrying their weight. When Marketing introduced these methods to the foreign office, they got an ovation.
2.4 Case Outcome
The quality and depth of discussions and decisions at operating and strategy reviews improved rapidly. Many questions that were formerly answered with a "finger to the wind" were now answered with hard data. Pivot tables are so flexible that answers to many questions could be provided in 1-5 minutes during the review meetings.
Automotive Industry Auto Total
European Countries
Europe Total
Asia Total
Product Family Product France Germany Nordic UK Other
Platform Product Platform % % % % % % % % %
Product family 1 Add-on #1 % % % % % % % % %
Add-on #2 % % % % % % % % %
Add-on #3 % % % % % % % % %
Add-on #4 % % % % % % % % %
Product family 1 Total % % % % % % % % %
Product family 2 Total % % % % % % % % %
Product family 3 Total % % % % % % % % %
Key: = product attach rate significantly higher than global industry average
= product attach rate significantly lower than global industry average =product sales are too low to consider attach rate
North America
Total
France has below-average
sales of two add-on families
in Auto industry.
UK has above-average
sales of two add-on
families in Auto industry.
UK does not have significant above-average
sales of any add-on product in this family.
UK has below-average
sales of Platform product
in Auto industry.
France has above-average
sales of Platform product
in Auto industry.
region, sale channel, and customer industry. The reports include trailing year summaries. Order attach rates, color maps, customer reports, and installed base reports show above for the case study are not included.
Visitors can customize and download spreadsheets for Sales Reporting and Analysis at
http://templates.modelsheetsoft.com/modelsheettemplates/sales-report-templates.aspx.
Figure 5: Sample pivot table showing revenue by sales location and customer industry Pivot tables make it easy to drill down in one product family or geographic region or industry
Figure 6: Sample pivot chart showing revenue growth by geographic region
Trailing year revenue makes long-term trends easier to see.
Revenue by geographic region Trailing year revenue by geographic region
Sales, 1999-06Q2 7/13/06
Rev-or-Units Rev
P Family (All)
Product (All)
Ind Family (All)
06Q2 T 4Q Ind Group
Region Location Aero Defense Auto Electronics Ind Equip T ier 2
Grand T otal NA NA-National $35,860 $3,962 $4,069 $245 $832 $44,968 NA-Regional $6,839 $2,297 $9,098 $1,645 $6,435 $26,314 NA-Other $6 $21 $7 $1 $6 $41 NA T otal $42,704 $6,280 $13,174 $1,891 $7,273 $71,322 EMEA France $2,840 $2,051 $1,858 $222 $2,094 $9,065 Germany $2,474 $6,007 $2,304 $1,123 $1,896 $13,803 Nordic $1,620 $1,318 $2,409 $988 $1,212 $7,546 UK $3,029 $1,086 $1,719 $159 $885 $6,878 EMEA-Other $3,554 $1,455 $3,904 $2,040 $2,585 $13,538 EMEA T otal $13,518 $11,917 $12,194 $4,531 $8,672 $50,831 APLA Japan $419 $3,893 $3,598 $1,427 $1,255 $10,592 APLA-Other $1,090 $1,265 $2,963 $631 $1,032 $6,981 APLA T otal $1,509 $5,158 $6,561 $2,058 $2,288 $17,574 Grand T otal $57,731 $23,355 $31,930 $8,479 $18,232 $139,727
4
Conclusion
ModelSheet's Customizable Spreadsheet Solution for Sales Reporting and Analysis gives you flexible reports for spotting macro trends in sales total and smaller trends in small segments. Pivot tables and pivot charts provide exceptional flexibility and make it easy to view sales data in many ways. This model can help you make better decisions about resource allocation in marketing, sales, and product development.
I would like to acknowledge collaboration with Howard I. Cannon of ModelSheet Software who wrote the software that makes the spreadsheet models.
© 2011 ModelSheet Software, LLC. All rights reserved. ModelSheet and the ModelSheet logo are registered trademarks of ModelSheet Software LLC in the United States and/or other countries. Microsoft, Excel, Internet Explorer, PivotChart, and PivotTable are trademarks of Microsoft Corporation. All other trademarks are property of their respective owners.