Abstract
Background: Dental caries, commonly known as tooth decay, is one of the most prevalent chronic diseases in the United States despite being largely preventable. Early childhood caries
(ECC) are particularly detrimental to pediatric health and are more prevalent among children of
lower socioeconomic status, presenting a problem to poorer states with a low
dentist-to-population ratio such as North Carolina (NC). Into the Mouths of Babes (IMB) is an NC program
that addresses ECC and dentist shortage by reimbursing physicians for administering preventive
dental treatments and providing oral health education to children enrolled in Medicaid.
Objective: This study determines the effect of distance a child must travel to an IMB provider on utilization of IMB services, controlling for dentist utilization and demographic factors. Data
sources: Claims data from 2013 to 2015 for children who utilized IMB services in North Carolina. Methods: This retrospective longitudinal study used data provided by North Carolina
Division of Medical Assistance (NC-DMA), the organization that administers Medicaid in NC.
A zero-truncated Poisson regression model was used to determine the effect of distance to an
IMB provider on number of IMB visits, while including dentist visits, age at first IMB visit, race,
ethnicity, and gender as predictors. Results: Distance travelled to an IMB provider slightly
decreased IMB utilization. The most influential predictor of IMB utilization was a child’s
utilization of dental services. Demographic factors such as race and ethnicity were related to
IMB utilization. Conclusions: These results show that there is a substantial relationship between
dentist visits and utilization of IMB services; future research should investigate this relationship.
Travel distance does not appear to be an influential barrier to IMB participation, so NC-DMA
and state policymakers should consider focusing on reducing other barriers to pediatric access to
Problem Description & Significance
Dental caries, commonly known as tooth decay, affects 92 percent of adults ages 20 to
64. Caries prevalence in recent years has decreased among adults, but it continues to increase
and remains the most prevalent chronic disease among children. Effects of childhood caries
include tooth loss requiring treatment by a dentist, severe weight loss due to oral pain and
reduced metabolism, and missed school days. More seriously, if left untreated caries can result in
early childhood death due to bacteria from a tooth abscess spreading to a child’s brain.
Despite being largely preventable through proper oral hygiene and regular dental exams,
almost 60 percent of American elementary school children from 2011 to 2012 had caries
experience in primary or permanent teeth. There are many risk factors that influence childhood
caries development, but perhaps the most salient is socioeconomic status; children of low
socioeconomic status experience caries at an earlier age and at a higher rate.
Dentists and physicians can prevent caries development through fluoride varnish
treatments. Research shows fluoride varnish is safe, effective at preventing caries, and cost
saving due to avoiding expensive dental treatments associated with untreated caries. However,
some children in states such as North Carolina (NC) face barriers to obtaining fluoride varnish.
NC has the fourth worst dentist-to-population ratio nationwide, and seven counties have one or
fewer dentist to serve the county’s population. NC also ranks 34th in poverty, with approximately 1.2 million children enrolled in public insurance such as Medicaid or NC’s Children’s Health
Insurance Plan.
Dentist participation in public insurance is low – less than 40 percent of dentists
statewide actively participate, and four counties have no dentist accepting public insurance.
percent of the national average, therefore little incentive exists to provide care for children on
public insurance.
Into the Mouths of Babes (IMB) is a program implemented by NC’s Division of Medical
Assistance designed to address oral health among low-income children and the dental provider
shortage across rural regions of the state. The program educates medical providers on the
importance of oral health, how to assess childhood oral health, and how to administer fluoride
varnish to children. Additionally, the program provides reimbursement to medical providers
through Medicaid. Since low-income children in rural areas face poor oral health compounded
by a shortage of dental providers, allowing medical providers to administer a preventive dental
treatment increases childhood access to dental care.
Results of IMB have largely been positive. From 2000 to 2006, approximately 30 percent
of the 630,000 Medicaid-enrolled children ages six to 35 months received oral health medical
visits through IMB. Children receiving at least four IMB visits experienced a 17 percent
reduction in caries-related treatments. Additionally, utilization was highest in rural counties; a
lower dentist-to-population ratio increased the likelihood of child and medical provider
participation. IMB providers faced barriers to program implementation including staff and
colleague resistance, difficulties integrating the dental treatments into normal clinical practice,
and low availability of local dentists for referrals.
Problem Statement
There is currently no research regarding barriers children experience to IMB
participation. While IMB is targeted at children who lack access to a dentist, children may also
face geographic, logistical, or financial barriers to visiting a medical provider for IMB visits.
Research question
How is geographic distance to an IMB-participating medical provider associated with the level of IMB utilization among Medicaid-enrolled children in NC?
Review of the Literature
Dental caries is the most prevalent chronic disease among children, is experienced more frequently by children in low-income households, and is preventable through application of fluoride varnish.
Dental caries, commonly known as tooth decay, is one of the most prevalent chronic
diseases in the United States.1 Ninety-two percent of adults ages 20 to 64 have had caries in their permanent teeth.2 Caries can form at any stage of life, and are caused by the interaction of oral bacteria, host saliva, and carbohydrate fermentation.3 While caries prevalence has decreased among adults in recent years, it continues to increase and remains the most prevalent chronic
disease among children.4,5 The obvious effects of childhood caries are acute tooth pain and tooth loss requiring treatment by a dentist. However, less apparent long-term effects include missed
school days, severe weight loss due to oral pain and reduced metabolism, impaired cognitive
development, and foregone parental wages due to trips to the dentist.6,7 In rare cases, caries can result in early childhood death; one example is Deamonte Driver, the twelve-year-old boy who
died due to bacteria from a tooth abscess spreading to his brain.8
Although 57.7 percent of American elementary school children from 2011 to 2012 had
caries experience in primary and permanent teeth, caries is largely preventable through proper
oral hygiene, an appropriate diet, fluoride varnish, and regular dental exams and cleanings.9,10 However, these individual interventions greatly depend on one’s self-efficacy, sociodemographic
example, children of low socioeconomic status experience early childhood caries (ECC) at a
higher rate and at an earlier age, putting even more of a burden on financially strained parents.13 Early detection of ECC is critical, as prompt intervention by a dentist may prevent
painful and expensive surgeries later in a child’s life.14 Additionally, ECC is reversible when diagnosed at an early age.15 Children who see a dentist regularly have fewer caries and better oral health than children who do not.16 One way dentists and physicians prevent ECC is through fluoride varnish treatments. Numerous studies have shown that childhood fluoride varnish is an
effective measure in preventing caries, and that there may be a dose-dependent relationship
between fluoride varnish and caries development.17,18,19 Weintraub et al. found that children who did not receive fluoride varnish had twice the odds of developing caries than those who received
fluoride varnish once a year, and almost four times the odds compared to children who received
fluoride varnish twice a year.20 Fluoride varnish is safe and generates cost-savings, as it is relatively inexpensive compared to the surgical and restorative solutions for untreated ECC.21 However, there are significant barriers to obtaining fluoride varnish for certain populations. For
example, states such as North Carolina (NC) where some counties have no dentist and residents
rely heavily on public assistance programs such as Medicaid face geographic, financial, and
access barriers to obtaining preventive dental services.
For NC children in low-income households, there is lack of dental access due to provider shortage, reliance on public insurance, and low provider reimbursement rates.
Children in NC experience barriers to accessing and paying for dental care. NC has the
fourth worst dentist-to-population ratio nationwide, and in 2011 there were 4.3 dentists per
issue for children in NC, as poor access and low socioeconomic status are risk factors to caries
development.26
Many children in NC rely on public insurance, but low utilization, provider participation,
and reimbursement create oral health disparities. Children in NC with household incomes of up
to 211 percent of the federal poverty line are eligible for Medicaid or NC Health Choice, the
state’s Children’s Health Insurance Plan (CHIP).27 These public insurance programs provide dental coverage for approximately 1.2 million children living in poverty statewide.28 However, utilization of the preventive services required to avoid oral diseases such as dental caries is poor
– between 42 and 45 percent of children enrolled in a public insurance program received any
preventive dental services in 2011.29 Dentist participation in these public payer programs is low – less than 40 percent of the 4,600 practicing dentists statewide actively participate, and four
counties have no dental providers accepting public insurance.30 Low dentist participation is a result of broken appointments, patient noncompliance, and burdensome paperwork, but the most
salient factor is likely low provider reimbursement rates.31
Sixty-two percent of dentist revenues on average go towards provider overhead (rent,
staff wages, clinical supplies), but Medicaid and NC Health Choice payments for preventive
dental services are anywhere from 44 to 58 percent of the national average.32,33 Dental providers in NC may not be able to cover their overhead costs when accepting public insurance, therefore
little incentive exists to provide care for children on public insurance. As 31 percent of children
had decay in primary teeth and 13 percent experienced decay in permanent teeth, these barriers
to dental care must be addressed to improve the oral health of children in NC.34,35
Significant statewide efforts to increase primary prevention of dental caries began in the
mid-1990s. The North Carolina Partnership for Children created Smart Smiles to address
low-income preschool children’s poor oral health in the western Appalachian part of the state,
containing counties with up to 66 percent pediatric caries prevalence.36 Barriers to dental care in this part of the state included a 16 percent dentist participation in Medicaid and a 10 percent
utilization of dental services by child Medicaid enrollees.37 Smart Smiles was a grant-funded demonstration program that utilized five dental hygienists to develop oral health interventions
specific to the children in their regions.38 All five hygienists recognized that low-income children in Western NC could access primary care providers (PCPs) better than dental providers, so
interventions were directed at PCP provision of oral health screening, education, and preventive
services. Private medical practices and local health departments provided caries screening, oral
health education, and application of fluoride varnish to at-risk children up to three years old.39 Preventive services were delivered at over 3,000 visits when the program concluded in 2001.
Success with the program was attributed to the multidisciplinary approach to community health
and the integration of the program into the existing medical care delivery system.40 Success of the Smart Smiles program led to the creation of a pilot study to gauge
feasibility of a statewide intervention. NC Division of Medical Assistance (NC-DMA), the
agency that administers Medicaid in NC, recruited practitioners in 66 medical offices to
participate in a pilot continuing medical education (CME) course. The course was designed to
educate medical providers about oral health and preventive dental care; it provided feedback to
Centers for Medicare and Medicaid Services (CMS), Health Resources and Services
Administration (HRSA), and the Centers for Disease Control and Prevention (CDC).42 Known as Into the Mouths of Babes (IMB), the statewide program has two main
components critical to its success: a CME course teaching oral health screening, fluoride varnish
application, and child oral health education, and medical provider reimbursement for preventive
dental services.43 Physicians or physician extenders are reimbursed for up to six medical visits for children under the age of three.44 Participating providers are reimbursed by NC-DMA if their visits satisfy IMB’s three-component approach to ECC prevention: oral health screening,
assessment, and referral to dentist if necessary, application of fluoride varnish to child’s teeth,
and health education of primary caregivers regarding child oral health.45 Oral health screening consists of a visual inspection of the oral cavity, and a patient encounter form to identify child
risk factors for ECC.46 Samples of fluoride varnish are provided initially to IMB providers, and IMB provides a list of which vendors to purchase future supplies from. The CME toolkit
provided through the program contains educational handouts for parents as well as information
for dentist referrals. By 2006, all 100 counties in NC had at least one IMB provider.47
IMB results have been mixed at the child and provider level; children with at least four visits had a significant reduction in caries, but physicians faced barriers to referring children to a dentist for further treatment.
From 2000 to 2006, roughly 30 percent of the approximately 630,000 Medicaid-enrolled
children ages six to 35 months received oral health medical visits through IMB.48 Visits were most frequent at the IMB-recommended ages of 9, 12, 15 18, and 24 months.49 Between approximately 30 percent of all participating children had at least one fluoride varnish
increased the likelihood of medical provider participation.51 Additionally, utilization was highest in rural counties.52 Pahel et al. found children with ≥4 IMB visits received 17 percent fewer dental treatments related to caries compared to children with no IMB visits.53 The reductions in caries-related treatments varied with age and number of IMB visits. There was no statistically
significant reduction in caries-related treatments among children with three or fewer IMB visits,
and so at least four visits were required to observe an effect on caries.54
Results of IMB are consistent with literature. A meta-analysis of 10 clinical trials found a
37 percent decrease in caries among children who received fluoride varnish applications between
two and four times a year.55 Slade et al. found between a 24 and 36 percent reduction in caries among children who received fluoride varnish application twice a year for two years.56 Pahel et al. described a threshold effect where at least four visits were required to observe a significant
reduction in caries; previous studies are moderately consistent with these findings. Weintraub et
al. found a dose-dependent relationship between number of fluoride varnish applications and
caries reduction beginning at the first application, indicating there is no threshold effect.57
However, an observational study by Holve found that children with at least four fluoride varnish
applications had a caries reduction of 35 percent, but children with fewer than four applications
had no significant caries reduction.58 Discrepancies in results may be due to IMB study design (observational vs. randomly controlled trial) and differences in caries prevalence in study
populations.59 Additionally, using number of caries-related treatments as the outcome measure instead of caries incidence may have underestimated the effectiveness of IMB, as not every child
who received fluoride varnish application followed up later with a dentist for treatment.60
From the provider perspective, participation in IMB has been positive. Over 70 percent of
providers reported that they were likely to refer children to a dentist upon screening, and over
half of providers called a dental office personally to schedule an appointment for the child to be
referred.62 The most common method of referral was providing the child’s parents with a dentist’s name.63 IMB providers identified barriers to program adoption including difficulties in applying fluoride varnish, staff resistance, and integrating the dental treatments into normal
clinical practice.64 Providers were clinically accurate in their caries screening and identification, but faced significant barriers in referring patients to dentists.65,66 Providers cited the low
availability of dentists as a major barrier to referrals; likelihood of referral was correlated more
strongly with availability of dentists than provider knowledge, experience, or opinion.67 No studies, however, have analyzed barriers to child participation in IMB. Children
seeking dental care from IMB providers may face geographic, logistical, or financial barriers to
visiting the provider. In order for IMB to effectively address childhood caries in NC, such
barriers must be identified and overcome. Therefore, there is a need to identify factors affecting
child access to and utilization of IMB treatments. Many studies have reported that distance to an
outpatient medical provider negatively affects patients’ level of medical service utilization.68,69 However, to this author’s knowledge, there are no studies that assess the effect of distance to a
pediatric medical provider on utilization of preventive dental services through a program such as
IMB. By analyzing the effect of distance to an IMB-participating medical provider on level of
IMB utilization, this study will inform the NC Division of Medical Assistance as well as
policymakers on how best to use their resources to address the oral health of the low-income
Research Design
This study utilized a retrospective longitudinal design to assess influences on healthcare
utilization over a period of time. Through a secondary data analysis, geographic information
system (GIS) mapping technology along with R Statistical Programming Language
(www.r-project.org, Version 3.2.4) was used to analyze existing North Carolina Division of Medical
Assistance (NC-DMA) claims data for IMB-participating children from 2013 to 2015.
Research Methods & Data Sources
Patient data from 2013 to 2015 was abstracted from electronic claims provided by
NC-DMA. Each claim represents a provider billing NC-DMA for either or both procedure codes
(D0145 & D1206) associated with IMB. Claims were de-identified; consistently masked IDs for
both the provider and patient were assigned to each claim. The dataset contained month and year
of service, patient ID, provider ID, straight line distance between patient and provider in miles,
number of non-IMB dental visits (HCPCS codes D0100-D9999) made to non-IMB providers in
the month of service, race, ethnicity, sex, age at time of provider visit, and precision of provider
and patient locations. Addresses of patients and IMB providers were converted to latitude and
longitude using street-level geocoding in SAS (SAS Institute, Cary, NC). When street-level
geocoding failed, the program defaulted to zip code- or city-level determination. Proximity to
provider was calculated using SAS by finding the Euclidian (straight line) distance between a
patient’s residence and provider’s office based on latitude and longitude. While travel time is the
most likely determinant of healthcare utilization, straight-line distance is a robust proxy and can
Participants & Sampling Methods
This research focused specifically on children enrolled in either Medicaid or NC Health
Choice for Children who had at least 1 visit to a provider participating in the IMB program
between 2013 and 2015. The original dataset contained 210,354 records (individual IMB visits)
from 93,640 children from 2013 to 2015. The dataset was cleaned by removing 1,851 claims of
children who were not between the ages of 0 and 42 months at the time of their visit, the age
range allowed under IMB. This resulted in a total sample size of 208,503 visits across 92,496
children.
Data Analysis Methods
Statistical analysis was performed using open-source R software.71 A zero-truncated Poisson (ZTP) regression was used to assess the relationship between distance to an
IMB-participating medical provider and the level of IMB utilization among children enrolled in
Medicaid or NC Health Choice for Children, after controlling for possible covariates. ZTP
regression is useful to model count data where the value zero cannot occur.72 Significance was considered at p<0.05.
The influence of each explanatory variable (distance travelled to provider visit
[continuous], number of non-IMB dental visits in the IMB visit month [continuous], age at first
IMB visit between 2013 and 2015 [continuous], race [reference: white], ethnicity [reference: not
Hispanic/Latino], and sex [reference: male]) on number of IMB visits (count) was assessed with
Ethical Considerations
Institutional Review Board (IRB) approval was obtained at the University of North
Carolina at Chapel Hill for this study (IRB Study #16-0230). A confidentiality agreement as well
as a data release form between the researcher and NC-DMA were obtained.
Instruments
R code for the statistical analysis is included in the Appendix.
Results
Descriptive Statistics of Study Population
Table 1 summarizes the demographic makeup of the 92,496 children who visited an IMB
medical provider between January 1, 2013 and December 31, 2015 and were under 42 months
old at the time of visit. The total number of IMB visits for the study population was 208,503. The
largest demographic groups were male, white, and not Hispanic/Latino. The largest proportion of
visits came from children ages 19 to 24 months old. The first IMB visit between 2013 and 2015
for these children tended to be between ages 7 and 12 months old. It is important to note that the
study population likely had IMB visits before 2013, but these were not captured in the claims
data starting January 1, 2013. Therefore, “Age at First Visit from 2013 to 2015” in Table 1
represents the study population’s ages at the first IMB visit recorded between January 1, 2013
Table 1. Demographic characteristics of children participating in IMB from 2013-2015 IMB Beneficiaries January 2013 – December 2015 n = 92,496
Characteristics Counts (n) Percents (%)
Sex
Female 45,470 49.16
Male 47,026 50.84
Race
Asian 2,126 2.3
Black 36,389 39.34
American Indian 2,613 2.82
Hawaiian or Pacific Islander 168 0.18
White 49,666 53.70
Unreported 1,534 1.66
Ethnicity
Hispanic Cuban 569 0.62
Hispanic Other 14,976 16.19
Hispanic Mexican American 5,365 5.80
Not Hispanic/Latino 58,103 62.82
Hispanic Puerto Rican 169 0.18
Unreported 13,314 14.39
Total Visits per Age Group
0-6 months old 2,986 1.43
7-12 months old 42,894 20.57
13-18 months old 55,219 26.48
19-24 months old 46,771 22.43
25-30 months old 25,835 12.39
31-36 months old 20,813 9.98
37-42 months old 13,985 6.71
Age at First Visit from 2013-2015
0-6 months old 2,959 3.2
7-12 months old 30,219 32.67
13-18 months old 20,066 21.69
19-24 months old 14,976 16.19
25-30 months old 9,113 9.85
31-36 months old 8,438 9.12
37-42 months old 6,725 7.27
Table 2 shows the number of IMB visits, number of non-IMB dental visits, and average
distance travelled to an IMB provider for the study population, separated by sex, race, and
dental provider that billed NC-DMA for HCPCS (Healthcare Common Procedure Coding
System) codes D0100-D9999 in the same month a child had an IMB visit. Visits to a dentist
were only captured in the study data if it occurred in the same month as an IMB visit. Therefore,
the number of non-IMB dental visits represents the number of visits to a dentist in the 3-year
period that occurred in the same month as an IMB visit, not necessarily the total number of
dentist visits in the 3-year period. While this isn’t an accurate characterization of the total
number of dentist visits by children in the study period, it was nevertheless included to assess the
relationship between visiting a dentist and visiting an IMB provider in the same month.
Taking an initial look at the utilization data summarized in Table 2, the study population
had an average of 2.25 IMB visits in the 3-year period, and travelled an average of 8.85 miles to
an IMB provider. The average number of both IMB and non-IMB dental visits were similar
between females and males, while females tended to travel slightly farther to an IMB provider.
In terms of race, Asians and Hawaiian/Pacific Islanders tended to have more IMB visits and
non-IMB dental visits, while black children had the lowest number of non-IMB/non-non-IMB visits. While
Hawaiian/Pacific Islander children tended to have higher utilization of IMB and non-IMB
Table 2. IMB Utilization, Non-IMB Dental Visits, and Distance Travelled to IMB Provider by Demographic Characteristic
IMB visits n=208,503
Non-IMB dental visits n=8,530
Distance travelled to IMB provider
(miles)
Demographic Characteristic n % 𝒙 n % 𝒙 n % 𝒙
SEX Female 101941 48.89% 2.24 4149 48.64% 0.091 - - 8.77
Male 106562 51.11% 2.26 4381 51.36% 0.093 - - 8.68
RACE
Asian 5260 2.52% 2.47 283 3.32% 0.133 - - 8.43
Black 79767 38.26% 2.19 3004 35.22% 0.082 - - 8.12
American
Indian 6365 3.05% 2.43 232 2.72% 0.088 - - 9.16
Hawaiian or
Pacific Islander 414 0.20% 2.46 23 0.27% 0.136 - - 9.46
Unreported 3468 1.66% 2.26 201 2.36% 0.131 - - 7.74
White 113229 54.31% 2.27 4787 56.12% 0.096 - - 9.16
ETHNICITY
Hispanic Cuban 1254 0.60% 2.20 36 0.42% 0.063 - - 9.76
Hispanic Other 34424 16.51% 2.29 2194 25.72% 0.146 - - 7.39
Hispanic Mexican
American 12680 6.08% 2.36 738 8.65% 0.137 - - 8.32
Not
Hispanic/Latino 130802 62.73% 2.25 4562 53.48% 0.078 - - 9.02
Hispanic Puerto
Rican 373 0.18% 2.20 15 0.18% 0.088 - - 7.49
Unreported 28970 13.89% 2.17 985 11.55% 0.073 - - 9.14
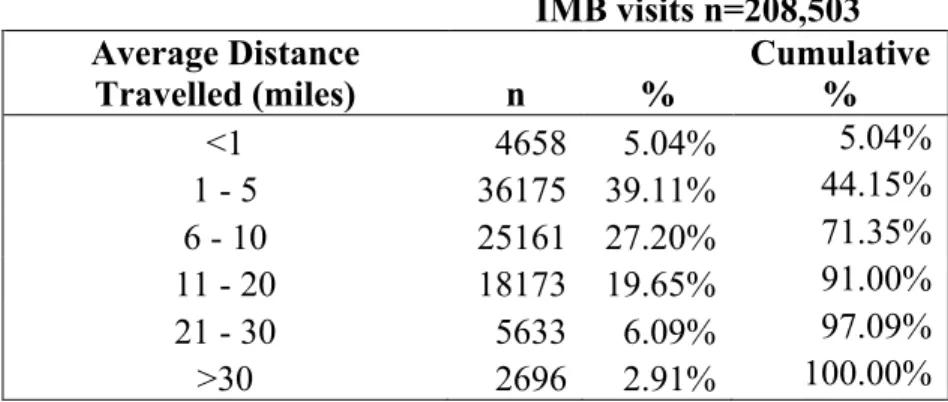
Table 3 shows the percentages of the population that had to travel various distances to
their IMB visit. Over 70 percent of the study population travelled less than 10 miles to an IMB
Table 3. Average Distance Study Population Travelled to IMB Provider
IMB visits n=208,503 Average Distance
Travelled (miles) n % Cumulative %
<1 4658 5.04% 5.04%
1 - 5 36175 39.11% 44.15%
6 - 10 25161 27.20% 71.35%
11 - 20 18173 19.65% 91.00%
21 - 30 5633 6.09% 97.09%
>30 2696 2.91% 100.00%
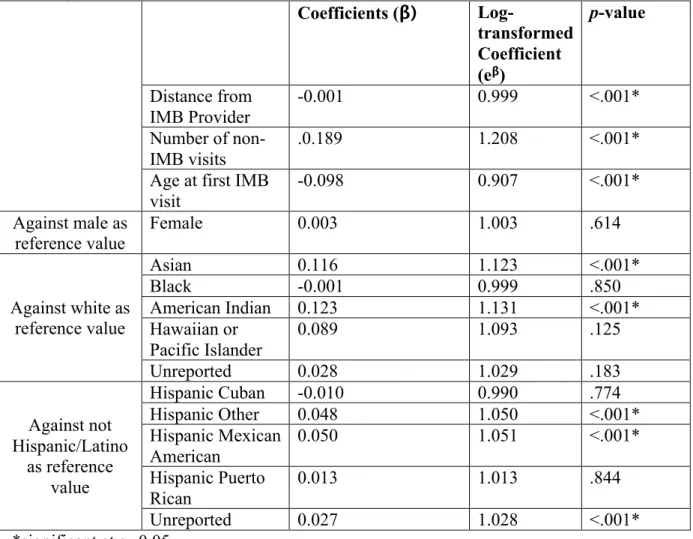
Zero-Truncated Poisson Regression Model
The results from the zero-truncated Poisson regression are summarized below in Table 4.
As the Poisson regression is a log-linear model, slope estimates (β) were exponentiated (eβ) to
find the multiplicative changes in the number of IMB visits for each one-unit change in
predictors. The average distance the study population had to travel to an IMB visit was found to
significantly influence the number of IMB visits in the 3-year study period. Keeping all other
predictors constant, increasing the distance from an IMB provider by 1 mile slightly decreased
the expected number of IMB visits by 0.1 percent. To put this in context, the model predicts that
a child that living 20 miles away from an IMB provider would have approximately 2 percent
fewer visits than a child living less than a mile from the provider.
The number of non-IMB dental visits and a child’s age at first IMB visit between 2013
and 2015 were more influential predictors on number of IMB visits. Keeping other predictors
constant, a one-unit increase in the number of non-IMB dental visits increased the expected
number of IMB visits by 20.8 percent. The model predicts that a child who regularly visited a
would have more than 3 times the number of visits than a child who did not visit a dental
provider at all during the study period. In terms of a child’s age at the first recorded visit in the
study period, a one-month increase in the child’s age decreased the expected number of IMB
visits by 9.3 percent. The model predicts that a child whose first recorded IMB visit in the study
period was at 12 months old would have approximately 70 percent fewer visits than a child
whose first recorded IMB visit was at 0 months old.
While sex did not significantly predict the number of IMB visits, race and ethnicity were
significant predictors in the model. Asian and American Indian children had 12.3 percent and
13.1 percent more IMB visits, respectively, compared to the white reference group. Additionally,
children who identified as either “Hispanic Other” or “Hispanic Mexican American” had
approximately 5 percent more visits than the “Not Hispanic/Latino” reference group. Children
with unreported ethnicities had 2.8 percent more visits in the study period than the reference
Table 4. Zero-truncated Poisson regression model of number of IMB visits adjusted for average distance from IMB provider, number of non-IMB visits, age at first IMB visit, sex, race, and ethnicity
Coefficients (β)
Log-transformed Coefficient (eβ)
p-value
Distance from IMB Provider
-0.001 0.999 <.001*
Number of
non-IMB visits .0.189 1.208 <.001*
Age at first IMB visit
-0.098 0.907 <.001*
Against male as reference value
Female 0.003 1.003 .614
Against white as reference value
Asian 0.116 1.123 <.001*
Black -0.001 0.999 .850
American Indian 0.123 1.131 <.001*
Hawaiian or Pacific Islander
0.089 1.093 .125
Unreported 0.028 1.029 .183
Against not Hispanic/Latino
as reference value
Hispanic Cuban -0.010 0.990 .774
Hispanic Other 0.048 1.050 <.001*
Hispanic Mexican American
0.050 1.051 <.001*
Hispanic Puerto Rican
0.013 1.013 .844
Unreported 0.027 1.028 <.001*
*significant at α=0.05
Discussion
The purpose of this study was to analyze the relationship between the distance a pediatric
Medicaid population had to travel to receive an IMB visit and their subsequent utilization of
IMB services in NC. The average distance travelled to an IMB provider was found to
significantly decrease the predicted number of IMB visits in the study period, even when
controlling for individual demographic characteristics and utilization of non-IMB dental
services. However, the decrease in the number of IMB visits was small, with a 20-mile increase
somewhat consistent with a previous study that found that distance to a provider was
significantly related to utilization of regular medical checkups.73 Since distance travelled only slightly influenced the number of visits, proximity to an IMB provider may not be a substantive
barrier to IMB utilization for this study population.
The number of non-IMB dental visits in the study period was found to be significantly
positively associated with the number of IMB visits in the study period. Children who had more
visits from dentists tended to have a higher utilization of IMB services. However, this model
cannot assess the temporal relationship between dental visits and IMB utilization. One possibility
is that a child first visited a dentist who referred the child to an IMB provider based on a medical
need. Another possibility, perhaps more likely, is that when children visited an IMB provider,
they presented with an oral healthcare need that could only be addressed by a dentist, so the IMB
provider referred them appropriately. Since the study data only counted dentist visits in the same
month as IMB visits and did not include which visit happened first, a directional relationship
cannot be established. This is obliquely consistent with existing literature; to this authors
knowledge there have been no studies reporting on the relationship between dental visits and
medical visits among children. However, among an elderly population, Atchison et al. found that
recent dental visits were significantly associated with an increase in utilization of other health
services.74
A child’s age at their first IMB visit between 2013 and 2015 had a significant negative
association with number of IMB visits; a one-month increase in age at first IMB visit decreased
the predicted number of visits by 9.3 percent. The IMB program only will reimburse medical
providers for preventive dental services for children aged 0 to 42 months. This data suggests that
they had. This is logical because younger children (closer to 0 months old) were enrolled for a
greater proportion of the study period than older children (closer to 42 months old), and therefore
had more opportunities to have an IMB visit.
Individual demographic characteristics also influenced IMB utilization. While sex did not
have a significant influence on number of IMB visits, certain aspects of race and ethnicity did
have an effect. Compared to white children, Asian and American Indian children had
significantly more IMB visits on average. In terms of ethnicity, children who identified as
“Hispanic Mexican American” and “Hispanic Other” had significantly higher utilization of IMB
services with “not Hispanic/Latino” as the reference group. Andersen et al. found that race and
ethnicity were moderate predictors of utilization of both physicians and dentists.75 Somewhat contradicting the findings of this study, a literature review by Flores found that African
American, Asian American, American Indian, and Hispanic American children experienced
extensive disparities in terms of health outcomes and access to and utilization of physician
services.76 While this study did not assess the health outcomes of the study population, the results of this study contradict previous literature suggesting Asian, American Indian, and
Hispanic have lower utilization of health services. However, it is important to note that the study
population represented a unique population in NC of children who were enrolled in a social
health insurance program (Medicaid/NC Health Choice) and participated in a program providing
preventive dental care at medical offices (IMB), and therefore may not be wholly representative
of the entire American population that other studies have reported on.
Limitations and Opportunities for Future Research
There are several limitations inherent to this study due to the source of data and the
causality between the exposure (distance to IMB-participating medical provider) and the
outcome variable (number of IMB visits). Additionally, some data that would be ideally
controlled for were not captured in the claims data. For example, children receiving fluoride
varnish from a school-based program or mobile community dental clinic may not seek
preventive dental services from IMB, potentially resulting in an overestimation of the effect of
distance on utilization. This information would not be captured in claims data, so cannot be
controlled for.
Another limitation to consider is the precision of the patient-provider distance
calculation. Not every claim in the data set had an address-address match between the child and
IMB provider. Over 90 percent of IMB visits could be matched to a specific provider address,
and approximately 80 percent of visits could be matched to a specific patient address.
Approximately 70 percent of all claims had the most precise, address-address match between a
child and provider. Visits without an address match required researchers to assign provider or
patient geocodes to visits either based on city of residence or 5-digit zip code, which are
inherently less precise than an address. The least precise geocoding matches (zip code-zip code,
city-city, zip code-city, and city-zip code) made up approximately 2 percent of all records.
Additionally, the dataset contained some outlier data, with distances over 300 miles. It is
unknown whether those outlier distances actually represent a proxy for the distance a child’s
parent or guardian had to drive for an IMB provider visit, or if the child was staying with a friend
or relative, or was out of town and had to visit an IMB provider. Since this could not be assessed
with the available data, and ground-truthing was not possible due to confidentiality requirements,
Another limitation of this study involves the data analysis. Due to time constraints and
capabilities of the author, a zero-truncated Poisson regression model was chosen to assess the
influence of proximity to an IMB provider and IMB utilization. However, there may be more
advanced and precise methods that give a more accurate representation of the relationship
between distance, utilization, and the covariates assessed in this study. A zero-truncated negative
binomial regression may be a better model for this data, particularly if assumptions of the
Poisson model are not strong.77 With more time, more advanced statistical techniques such as this could be used to increase accuracy of the results.
One final limitation to consider is that distance to IMB-participating medical provider
was measured using the straight-line method as opposed to travel time on roads. This method has
been shown to be a reasonable proxy for travel time in hospital demand models, but it may not
be accurate when dealing with a dense urban areas involving reliance on walking.78 Moreover, the claims data do not include whether or not the family has access to a car, so whether a child
and/or parent walked or used public transportation to an IMB provider is unknown. Further
research on this subject may examine the relationship between family ownership of a car and
utilization of IMB services to identify how to increase access and utilization.
Conclusion
This study has shown that an increase in travel distance is associated with a slight
decrease in the number of IMB visits in a 3-year period. More influentially, children who see a
dentist regularly have over 3 times as many IMB visits than children who do not. Additionally,
racial and ethnic differences exist among children in terms of IMB utilization. While distance to
an IMB provider was identified as a modest barrier to IMB utilization in this study population,
research should analyze the relationship between dentist and IMB visits to assess if IMB visits
are driving dental visits, or if the opposite is more likely. As travel distance does not appear to be
an influential barrier to IMB participation, North Carolina Division of Medical Assistance as
well as state policymakers can more effectively marshal and direct their resources towards
reducing other barriers to pediatric access to IMB services. The results of this study can inform
various stakeholders regarding pediatric access to preventive oral health care at medical offices
Appendix
# Code used for data analysis in R
#load required packages install.packages("foreign") install.packages("ggplot2") install.packages("VGAM") install.packages("boot") library("foreign") library("ggplot2") library("VGAM") library("boot")
#upload claims data file into R and defines variables PoissonData=read.csv("Claims Data Here",header=T) attach(PoissonData)
#zero-truncated Poisson regression: Number of IMB visits on average distance to provider, number of non-IMB dental visits, age at first IMB visit between 2013 and 2015, race, ethnicity, and gender
PoissonTest <- vglm(NUMBER_VISITS ~ AVERAGE_DISTANCE + NUMBER_NON_IMB + AGE_FIRST_VISIT + RACE_FIXED + ETHNICITY_FIXED + GENDER_FIXED, family = pospoisson(), data = PoissonData)
summary(PoissonTest)
References
1 Dye, B. A., Tan, S., Smith, V., Lewis, B. G., Barker, L. K., Thornton-Evans, G., et al. (2007). Trends in oral health status: United states, 1988-1994 and 1999-2004. Vital and Health Statistics.Series 11, Data from the National Health Survey, (248)(248), 1-92.
2 Centers for Disease Control and Prevention (CDC), National Center for Health Statistics (NCHS). National health and nutrition examination survey questionnaire No. 2012). Hyattsville, MD: U.S. Department of Health and Human Services, Centers for Disease Control and Prevention.
3 Selwitz, R. H., Ismail, A. I., & Pitts, N. B. (2007). Dental caries. Lancet (London, England), 369(9555), 51-59. doi:S0140-6736(07)60031-2
4 Dye, B. A., Tan, S., Smith, V., Lewis, B. G., Barker, L. K., Thornton-Evans, G., et al. (2007). Trends in oral health status: United states, 1988-1994 and 1999-2004. Vital and Health Statistics.Series 11, Data from the National Health Survey, (248)(248), 1-92.
5 NCHS dataline.(2007). Public Health Reports, 122(5), 705-706. doi:21_NCHS
6 Sheiham, ,A. Dental caries affects body weight, growth and quality of life in pre-school children.
7 Jackson, S. L., Vann, W. F., Kotch, J. B., Pahel, B. T., & Lee, J. Y. (2011). Impact of poor oral health on children's school attendance and performance. Am J Public Health, 101(10), 1900-1906. doi:10.2105/AJPH.2010.200915
8 Edelstein, B. L. (2009). Putting teeth in CHIP: 1997–2009 retrospective of congressional action on children's oral health. Academic pediatrics, 9(6), 467-475.
9 Centers for Disease Control and Prevention (CDC), National Center for Health Statistics (NCHS). National health and nutrition examination survey questionnaire No. 2012). Hyattsville, MD: U.S. Department of Health and Human Services, Centers for Disease Control and Prevention.
10 Fontana, M. The tooth decay process: How to reverse it and avoid a cavity. Bethesda, MD: National Institute of Dental and Craniofacial Research.
11 Litt, M. D., Reisine, S., & Tinanoff, N. (1995). Multidimensional causal model of dental caries development in low-income preschool children. Public Health Reports, 110(5), 607-617. 12 Fontana, M. (2015). The clinical, behavioral, and environmental factors that foster early
childhood caries: Evidence for caries risk assessment. Pediatric Dentistry, 37(3), 217-229. 13 Fontana, M. (2015). The clinical, behavioral, and environmental factors that foster early
childhood caries: Evidence for caries risk assessment. Pediatric Dentistry, 37(3), 217-229. 14 Ismail, A. I., Nainar, S., & Sohn, W. (2003). Children's first dental visit: Attitudes and
practices of US pediatricians and family physicians. Pediatric Dentistry, 25(5), 425-430. 15 Ismail, A. I., Nainar, S., & Sohn, W. (2003). Children's first dental visit: Attitudes and
practices of US pediatricians and family physicians. Pediatric Dentistry, 25(5), 425-430. 16 US Department of Health and Human Services. (2000). Oral health in america: A report of the
surgeon general-- executive summary. Rockville, MD: US Department of Health and Human Services, National Institute of Dental and Craniofacial Research, National Institutes of Health.
18 Zimmer, S., Robke, F. J., & Roulet, J. (1999). Caries prevention with fluoride varnish in a
socially deprived community. Community Dentistry and Oral Epidemiology, 27(2), 103-108. doi:10.1111/j.1600-0528.1999.tb01998.x
19 Weintraub, J. A., Ramos-Gomez, F., Jue, B., Shain, S., Hoover, C. I., Featherstone, J. D. B., et al. (2006). Fluoride varnish efficacy in preventing early childhood caries. Journal of Dental Research, 85(2), 172-176. doi:10.1177/154405910608500211
20 Weintraub, J. A., Ramos-Gomez, F., Jue, B., Shain, S., Hoover, C. I., Featherstone, J. D. B., et al. (2006). Fluoride varnish efficacy in preventing early childhood caries. Journal of Dental Research, 85(2), 172-176. doi:10.1177/154405910608500211
21 Azarpazhooh, A., & Main, P. A. (2008). Fluoride varnish in the prevention of dental caries in children and adolescents: A systematic review. Journal-Canadian Dental Association, 74(1), 73.
22 North Carolina Institute of Medicine. (2013). The north carolina oral health action plan for children enrolled in medicaid and NC health choice. Morrisville, NC: North Carolina Institute of Medicine.
23 North Carolina Institute of Medicine. (2013). The north carolina oral health action plan for children enrolled in medicaid and NC health choice. Morrisville, NC: North Carolina Institute of Medicine.
24 Short, K. (2013). The Research Supplemental Poverty Measure. Suitland, Maryland: United States Census Bureau.
25 Stanford Center on Poverty and Equality. (2015). State of the states: The poverty and inequality report. Stanford, CA: Stanford Center on Poverty and Equality.
26 Fontana, M. (2015). The clinical, behavioral, and environmental factors that foster early childhood caries: Evidence for caries risk assessment. Pediatric Dentistry, 37(3), 217-229. 27 North Carolina Division of Medical Assistance. (2015). Medicaid income and resource
requirements. Retrieved 10/20, 2015, from http://dma.ncdhhs.gov/medicaid/get- started/eligibility-for-medicaid-or-health-choice/medicaid-income-and-resources-requirements
28 North Carolina Institute of Medicine. (2013). The north carolina oral health action plan for children enrolled in medicaid and NC health choice. Morrisville, NC: North Carolina Institute of Medicine.
29 North Carolina Division of Medical Assistance. (2015). Medicaid income and resource requirements. Retrieved 10/20, 2015, from http://dma.ncdhhs.gov/medicaid/get- started/eligibility-for-medicaid-or-health-choice/medicaid-income-and-resources-requirements
30 North Carolina Institute of Medicine. (2013). The north carolina oral health action plan for children enrolled in medicaid and NC health choice. Morrisville, NC: North Carolina Institute of Medicine.
31 Mofidi, M., Rozier, R. G., & King, R. S. (2002). Problems with access to dental care for medicaid-insured children: What caregivers think. American Journal of Public Health, 92(1), 53-58.
33 North Carolina Division of Medical Assistance. (2014). NC medicaid dental reimbursement
rates. Morrisville, NC: North Carolina Division of Medical Assistance.
34 Rozier, R. G., & King, R. S. (2005). Defining the need for dental care in north carolina: Contributions of public health surveillance of dental diseases and conditions. North Carolina Medical Journal, 66(6), 438-444.
35 Tomlinson, S. (2013). Oral health data: North carolina (Online Report. Atlanta, GA: Centers for Disease Control and Prevention.
36 Rozier, R. G., Stearns, S. C., Pahel, B. T., Quinonez, R. B., & Park, J. (2010). How A north carolina program boosted preventive oral health services for low-income children. Health Affairs, 29(12), 2278-2285. doi:10.1377/hlthaff.2009.0768
37 Rozier, R. G., Stearns, S. C., Pahel, B. T., Quinonez, R. B., & Park, J. (2010). How A north carolina program boosted preventive oral health services for low-income children. Health Affairs, 29(12), 2278-2285. doi:10.1377/hlthaff.2009.0768
38 Rozier, R., Sutton, B., Bawden, J., Haupt, K., Slade, G., & King, R. (2003). Prevention of early childhood caries in north carolina medical practices: Implications for research and practice. Journal of Dental Education, 67(8), 876-885.
39 Rozier, R., Sutton, B., Bawden, J., Haupt, K., Slade, G., & King, R. (2003). Prevention of early childhood caries in north carolina medical practices: Implications for research and practice. Journal of Dental Education, 67(8), 876-885.
40 Rozier, R., Sutton, B., Bawden, J., Haupt, K., Slade, G., & King, R. (2003). Prevention of early childhood caries in north carolina medical practices: Implications for research and practice. Journal of Dental Education, 67(8), 876-885.
41 Rozier, R., Sutton, B., Bawden, J., Haupt, K., Slade, G., & King, R. (2003). Prevention of early childhood caries in north carolina medical practices: Implications for research and practice. Journal of Dental Education, 67(8), 876-885.
42 Rozier, R. G., Stearns, S. C., Pahel, B. T., Quinonez, R. B., & Park, J. (2010). How A north carolina program boosted preventive oral health services for low-income children. Health Affairs, 29(12), 2278-2285. doi:10.1377/hlthaff.2009.0768
43 Rozier, R., Sutton, B., Bawden, J., Haupt, K., Slade, G., & King, R. (2003). Prevention of early childhood caries in north carolina medical practices: Implications for research and practice. Journal of Dental Education, 67(8), 876-885.
44 Rozier, R., Sutton, B., Bawden, J., Haupt, K., Slade, G., & King, R. (2003). Prevention of early childhood caries in north carolina medical practices: Implications for research and practice. Journal of Dental Education, 67(8), 876-885.
45 Rozier, R. G., Stearns, S. C., Pahel, B. T., Quinonez, R. B., & Park, J. (2010). How A north carolina program boosted preventive oral health services for low-income children. Health Affairs, 29(12), 2278-2285. doi:10.1377/hlthaff.2009.0768
46 Rozier, R., Sutton, B., Bawden, J., Haupt, K., Slade, G., & King, R. (2003). Prevention of early childhood caries in north carolina medical practices: Implications for research and practice. Journal of Dental Education, 67(8), 876-885.
48 Rozier, R. G., Stearns, S. C., Pahel, B. T., Quinonez, R. B., & Park, J. (2010). How A north
carolina program boosted preventive oral health services for low-income children. Health Affairs, 29(12), 2278-2285. doi:10.1377/hlthaff.2009.0768
49 Pahel, B. T., Rozier, R. G., Stearns, S. C., & Quinonez, R. B. (2011). Effectiveness of preventive dental treatments by physicians for young medicaid enrollees. Pediatrics, 127(3), e682-9. doi:10.1542/peds.2010-1457
50 Rozier, R. G., Stearns, S. C., Pahel, B. T., Quinonez, R. B., & Park, J. (2010). How A north carolina program boosted preventive oral health services for low-income children. Health Affairs, 29(12), 2278-2285. doi:10.1377/hlthaff.2009.0768
51 Rozier, R. G., Stearns, S. C., Pahel, B. T., Quinonez, R. B., & Park, J. (2010). How A north carolina program boosted preventive oral health services for low-income children. Health Affairs, 29(12), 2278-2285. doi:10.1377/hlthaff.2009.0768
52 Rozier, R. G., Stearns, S. C., Pahel, B. T., Quinonez, R. B., & Park, J. (2010). How A north carolina program boosted preventive oral health services for low-income children. Health Affairs, 29(12), 2278-2285. doi:10.1377/hlthaff.2009.0768
53 Pahel, B. T., Rozier, R. G., Stearns, S. C., & Quinonez, R. B. (2011). Effectiveness of preventive dental treatments by physicians for young medicaid enrollees. Pediatrics, 127(3), e682-9. doi:10.1542/peds.2010-1457
54 Pahel, B. T., Rozier, R. G., Stearns, S. C., & Quinonez, R. B. (2011). Effectiveness of preventive dental treatments by physicians for young medicaid enrollees. Pediatrics, 127(3), e682-9. doi:10.1542/peds.2010-1457
55 Marinho, V., Worthington, H., Tanya, W., & Clarkson, J. (2013). Fluoride varnishes for preventing dental caries in children and adolescents. Cochrane database of systematic reviews () doi:10.1002/14651858.CD002279.pub2
56 Slade, G. D., Bailie, R. S., Roberts-Thomson, K., Leach, A. J., Raye, I., Endean, C., et al. (2011). Effect of health promotion and fluoride varnish on dental caries among australian aboriginal children: Results from a community-randomized controlled trial. Community Dentistry and Oral Epidemiology, 39(1), 29-43. doi:10.1111/j.1600-0528.2010.00561.x 57 Weintraub, J. A., Ramos-Gomez, F., Jue, B., Shain, S., Hoover, C. I., Featherstone, J. D. B., et
al. (2006). Fluoride varnish efficacy in preventing early childhood caries. Journal of Dental Research, 85(2), 172-176. doi:10.1177/154405910608500211
58 Holve, S. (2008). An observational study of the association of fluoride varnish applied during well child visits and the prevention of early childhood caries in american indian children. Maternal and Child Health Journal, 12 Suppl 1, 64-67. doi:10.1007/s10995-007-0294-0 59 Pahel, B. T., Rozier, R. G., Stearns, S. C., & Quinonez, R. B. (2011). Effectiveness of
preventive dental treatments by physicians for young medicaid enrollees. Pediatrics, 127(3), e682-9. doi:10.1542/peds.2010-1457
60 Pahel, B. T., Rozier, R. G., Stearns, S. C., & Quinonez, R. B. (2011). Effectiveness of preventive dental treatments by physicians for young medicaid enrollees. Pediatrics, 127(3), e682-9. doi:10.1542/peds.2010-1457
61 Close, K., Rozier, R. G., Zeldin, L. P., & Gilbert, A. R. (2010). Barriers to the adoption and implementation of preventive dental services in primary medical care. Pediatrics, 125(3), 509-517. doi:10.1542/peds.2009-1008
63 dela Cruz, G. G., Rozier, R. G., & Slade, G. (2004). Dental screening and referral of young
children by pediatric primary care providers. Pediatrics, 114(5), e642-52. doi:114/5/e642 64 Close, K., Rozier, R. G., Zeldin, L. P., & Gilbert, A. R. (2010). Barriers to the adoption and
implementation of preventive dental services in primary medical care. Pediatrics, 125(3), 509-517. doi:10.1542/peds.2009-1008
65 Pierce, K. M., Rozier, R. G., & Vann, W. F.,Jr. (2002). Accuracy of pediatric primary care providers' screening and referral for early childhood caries. Pediatrics, 109(5), E82-2. 66 Close, K., Rozier, R. G., Zeldin, L. P., & Gilbert, A. R. (2010). Barriers to the adoption and
implementation of preventive dental services in primary medical care. Pediatrics, 125(3), 509-517. doi:10.1542/peds.2009-1008
67 dela Cruz, G. G., Rozier, R. G., & Slade, G. (2004). Dental screening and referral of young children by pediatric primary care providers. Pediatrics, 114(5), e642-52. doi:114/5/e642 68 Schmitt, S. K., Phibbs, C. S., & Piette, J. D. (2003). The influence of distance on utilization of
outpatient mental health aftercare following inpatient substance abuse treatment. Addictive Behaviors, 28(6), 1183-1192. doi:S0306460302002186
69 Burgess, J. F.,Jr, & DeFiore, D. A. (1994). The effect of distance to VA facilities on the choice and level of utilization of VA outpatient services. Social Science & Medicine (1982), 39(1), 95-104.
70 Phibbs, C.S., Luft, H.S. (1995). Correlation of Travel Times on Roads versus Straight Line
Distance. Medical Care Research and Review, 52(4), 532-‐42.
71 www.r-‐project.com
72 R Data Analysis Examples: Zero-‐Truncated Poisson Regression. UCLA: Statistical
Consulting Group. Retrieved from: http://www.ats.ucla.edu/stat/r/dae/ztp.htm (accessed April 10, 2016).
73 Arcury, T. A., Gesler, W. M., Preisser, J. S., Sherman, J., Spencer, J., Perin, J. (2005). The
Effects of Geography and Spatial Behavior on Health Care Utilization among the Residents of a Rural Region. Health Services Research, 40(1), 135-‐156.
74 Atchison, K. A., Mayer-‐Oakes, S. A., Schweitzer, S. O., Lubben, J. E., De Jong, F. J., Matthias,
R. E. (2007). The Relationship Between Dental Utilization and Preventive Participation Among a Well-‐elderly Sample. Public Health Dentistry, 53(2), 88-‐95.
75 Andersen, R., Newman, J. F. (2005). Societal and Individual Determinants of Medical Care
Utilization in the United States. The Milbank Quarterly, 83(4), n.p.
76 Flores, G. (2010). Racial and Ethnic Disparities in the Health and Health Care of Children. Pediatrics, 125(4), 281.
77 Simonoff, J. S. (2003). Analyzing Categorical Data. New York, NY: Springer Science &
Business Media.
78Phibbs, C.S., Luft, H.S. (1995). Correlation of Travel Times on Roads versus Straight Line